Yes, but only because it was so extremely high recently.
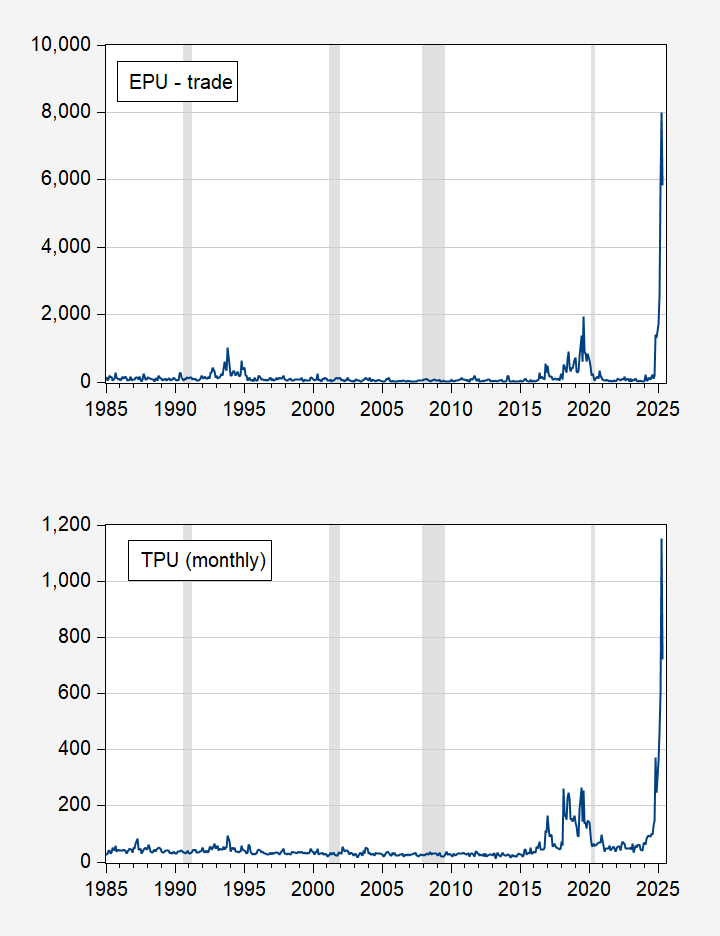
Figure 1: Top panel – Economic Policy Uncertainty – trade category (blue); Bottom panel – Trade Policy Uncertainty (blue). NBER defined peak-to-trough recession dates shaded gray. Source: policyuncertainty.com, Iacoviello, NBER.
Off topic – The economic effect of Israel’s war against peace:
WTI up 7.6% today, Brent up 7.0%. The rule of thumb is that oil price increases are inflationary when growth is above trend, contractionary when growth is below trend. That has to do with the preponderance of the effect, not the only effect. Still stagflationary. The Fed can only choose to run tight picy, easy policy or do nothing, so the preponderant effect matters.
DXY added 0.3% today, less that you’d normally expect when war breaks out in the Middle East, but still up. Ten-year yield up 0.1%. So we aren’t seeing a safe-haven bid, even though the S&P shed 1.1% today.
So Israel’s effort to prevent an Iran nuke deal has delivered a modest stagflationary shock, while erosion of U.S. safe-haven status continues apace. The extension of steel and aluminim tariffs to appliances may have contributed to dollar and equity losses today:
https://www.msn.com/en-us/money/markets/trump-s-50-steel-tariffs-are-coming-for-your-next-fridge-and-dishwasher/ar-AA1GEewd
Off topic – CBO’s latest score of distributional effects of the Big Bloated Budget Bill:
https://www.cbo.gov/publication/61387
The CBO report (in the form of a letter) is only 6 pages long and worth a read. Here’s the NYT summary:
https://www.nytimes.com/interactive/2025/06/12/upshot/gop-megabill-distribution-poor-rich.html
The NYT adds quite a bit to the story by comparing the Bloat to earlier tax and benefits legislation, showing how much more this bill hurts the poor:
“The shape of that distribution is rare: Tax cut packages have seldom left the poor significantly worse off. And bills that cut the safety net usually haven’t also included benefits for the rich. By inverting those precedents, congressional Republicans have created a bill unlike anything Washington has produced since deficit fears began to loom large in the 1990s.
“I’ve never seen anything that simultaneously really goes after poor people and then really helps rich people,” said Chuck Marr, the vice president for federal tax policy at the left-leaning Center on Budget and Policy Priorities.”
Really goes after poor people – that’s nice.
By the way, the rules of the game don’t allow the CBO to answer questions that haven’t been asked, even if they have previously been asked and answered. What’s missing from the CBO’s most recent report is any reflecting PAYGO sequestrations. In a May 20th response to a Congressional information request, CBO offered this about PAYGO sequestration:
“Under S-PAYGO, reductions in Medicare spending are limited to 4 percent— or an estimated $45 billion for fiscal year 2026. That would leave $185 billion to be sequestered from the federal budget’s remaining direct spending accounts in that year.
“S-PAYGO exempts many large accounts, including those that provide funding for Social Security and low-income programs. Therefore, in CBO’s estimation, OMB would have roughly $120 billion in budgetary resources available for cancellation in 2026—less than the remaining amount that would be required to be sequestered.”
Those are first-year estimates. The process of sequestration continues in subsequent years, with dollar sequestration amounts increasing. Medicare beneficiaries suffer cuts, as do a number of other unprotected programs, but the deficit still grows pretty substantially because the Bloat Bill expands the deficit by more than PAYGO rules can sequester. All that PAYGO does is make cuts that Republican lawmakers don’t have the guts to vote for, but know will happen. PAYGO turns the Bloat bill from being historically bad for the poor to historically even worse. The NYT missed that part.
So when reading the distributional effects in the CBO’s latest response, know that the reality is considerably worse for lower-income households, somewhat worse for the middle class because of the effect on middle-class retirees and beneficiaries of transfer programs, educational budgets and so on.
One more thing. Optimistic but Sceptic has pointed out the fiscal buffer that the Bloat Bill provides against recession. PAYGO sequestrations, to the extent they reduce the deficit, reduce that fiscal buffer against recession.
One more thing about distributional effects of the Big Bloated Budget Bill – the Yale Budget Lab has recently done an estimate of the combined effect of the Bloat and tariffs:
https://budgetlab.yale.edu/research/combined-distributional-effects-one-big-beautiful-bill-act-and-tariffs
On top of the lowest income decile losing 3.9% of its income to the Bloat, they also lose another 2.6% to the price effects of tariff. That’s a total of 6.5% for the poorest households; “more than” 6.5%, says Yale. Meanwhile, the top ten percent of households get a 1.5% boost, ’cause they need it, I guess.
Of course, we don’t actually know what tariffs will be imposed because the felon-in-chief seems to TACO out most of the time. We’re all just doing the best analysis we can. WAGs all around.
Recession watch – the number of unemployed:
The Sahm Rule runs on the unemployment rate. Claudia Sahm has said that her Rule, which serves as an early warning that recession has arrived, may not be reliable these days because of the effect of immigration on the denominator of the unemployment rate. We can, however, look at the level of unemployment, rather than the rate, and avoid the effect of swings in the denominator. Here’s a picture of the Sahm Rule indicator against the level of unemployment:
https://fred.stlouisfed.org/graph/?g=1JBVv
The level of unemployment is up considerably from its cycle low, and still trending upward. The Sahm indicator is also up from its cycle low, but not enough to trigger a recession positive, and down from its cycle peak.
As I’ve pointed out before, a rising Sahm indicator has fairly reliably recession forecast, on the way to indicating a recession is underway. A look at the picture will confirm that a steady rise in unemployment is also quite reliable at forecasting recession. The level of unemployment has risen more from its cycle low now than prior to other recessions. Unemployment in this series is defined as iseeking work. No drop-outs.
Over the past year, the Sahm indicator has fallen, but unemployment has risen:
https://fred.stlouisfed.org/graph/?g=1JBVX
That’s odd. If Claudia’s suspicion about the denominator is correct, maybe we should be looking at the unemployment level; notice what’s been happening since January. Uh Oh.