A compilation:
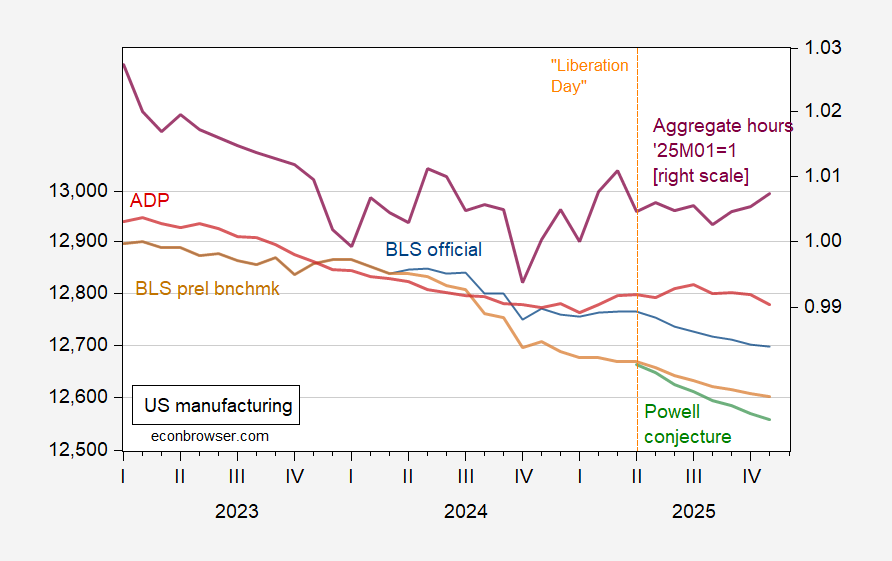
Figure 1: Official BLS manufacturing employment (blue, left log scale), implied BLS preliminary benchmark (tan, left scale), Powell conjecture on implied preliminary benchmark (green, left scale), ADP (red, left scale), all in 000’s, s.a., and official aggregate hours, 2025M01=1.00 (purple, log right scale). Aggregate hours calculated by multiplying average weekly hours by production and nonsupervisory workers. Powell conjecture is prorated 60K overcount applied to manufacturing employment, April-November. Source: BLS via FRED, BLS, and author’s calculations.
While aggregate hours are up since January, manufacturing employment by any BLS related measure is down, and even the ADP measure is just even with the beginning of the year number (and is as of November trending down). Note that the ADP measure, while relying on BLS weights, is not directly subject to the vagaries of the birth-death model.
If we focus on manufacturing employment (implied benchmark), we can see a acceleration in employment decline with “Liberation Day” and the average effective tariff rate.
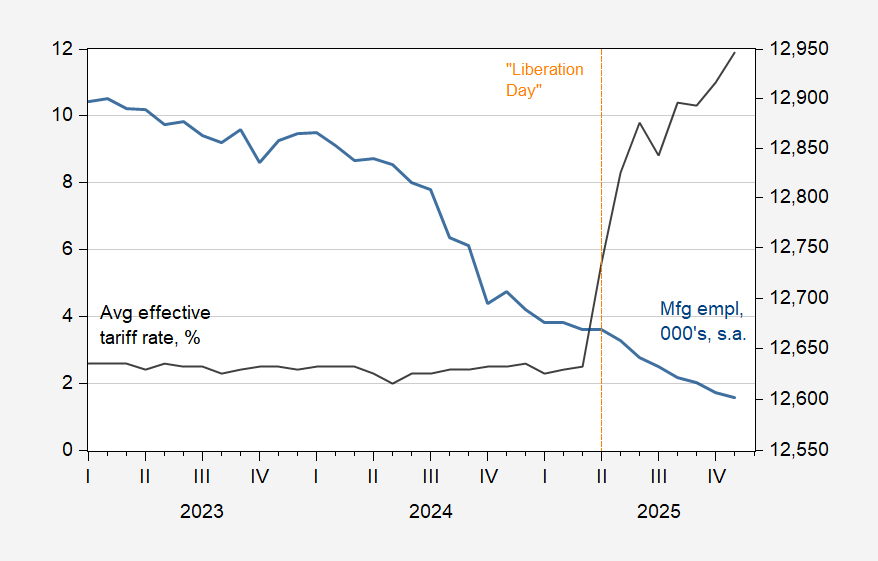
Figure 2: Average effective tariff rate, % (black, left scale), and implied preliminary benchmark revision manufacturing employment, 000’s (blue, left log scale). Source: BLS, Paweł Skrzypczyński, and author’s calculations.
It should be noted that, like aggregate employment, manufacturing gross output and value added measures have diverged from employment series, both having risen slightly relative to January 2025 and 2024Q4 (2.1% through September, 1.3% through Q2).
Addendum:
Just saw this Dean Baker article highlighted on Bluesky.
The first GDP report for Q3 is due tomorrow. GDPNow looks for a 3.5% pace of growth. The belated release of Q3 data means tomorrow will also bring the belated first GDPNow estimate of Q4 GDP. The Hutchins Center anticipates a 1.5% drag on growth from the shutdown:
https://www.brookings.edu/articles/hutchins-center-fiscal-impact-measure/
I don’t know what GDPNow will do, if anything, to anticipate the effect of the shutdown. If nothing, until the effects show up in various data releases, then the initial estimate for Q4 could be misleadingly high.
Oh and, silly me, I think I’ve figured out why, as of its December meeting, the FOMC suddenly expects 2.3% grow in 2026, rather than 1.8%. That projection is Q4 2026 relative to Q4 this year. The government shutdown will have depressed the Q4 GDP base, thereby flattering Q4 next year. Egg, meet face.