Real exports, Manufacturing employment both down relative to 2024M12.
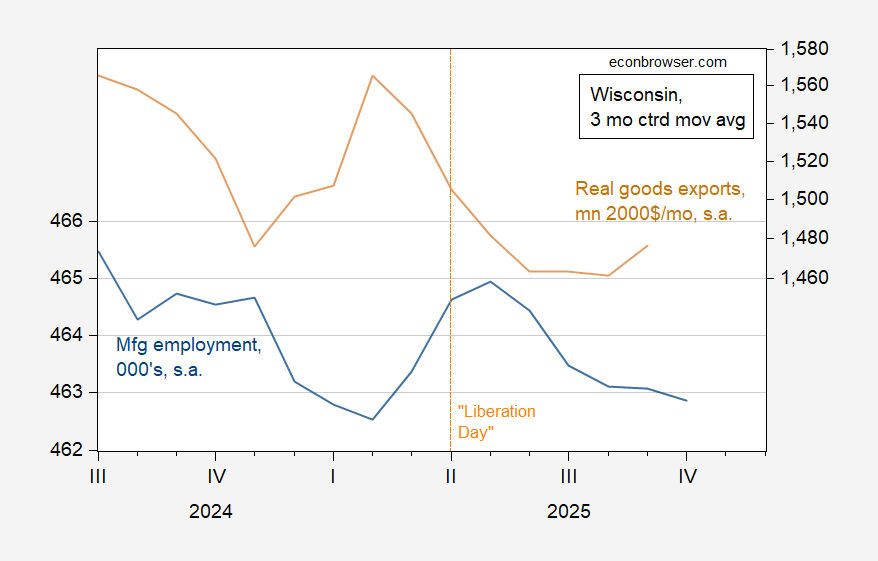
Figure 1: Wisconsin manufacturing employment, 000’s (blue, left log scale), Wisconsin real exports, mn 2000$ (right log scale), both s.a., 3 month centered moving averages. Wisconsin goods exports deflated using US commodities export price index, and seasonally adjusted by author using Census X-13. Source: BLS, BEA, via FRED, and author’s calculations.
Were you surprised? A lot of tariffs imposed on inputs (and Wisconsin does not produce raw steel), so downstream users — particularly exporters — would experience negative effective rates of protection.
See the predictions from back in May, 2025.