GDPNow for Q4 at 5.1% is considerably higher than Goldman Sachs at 3.1%, and St. Louis Fed at essentially zero.
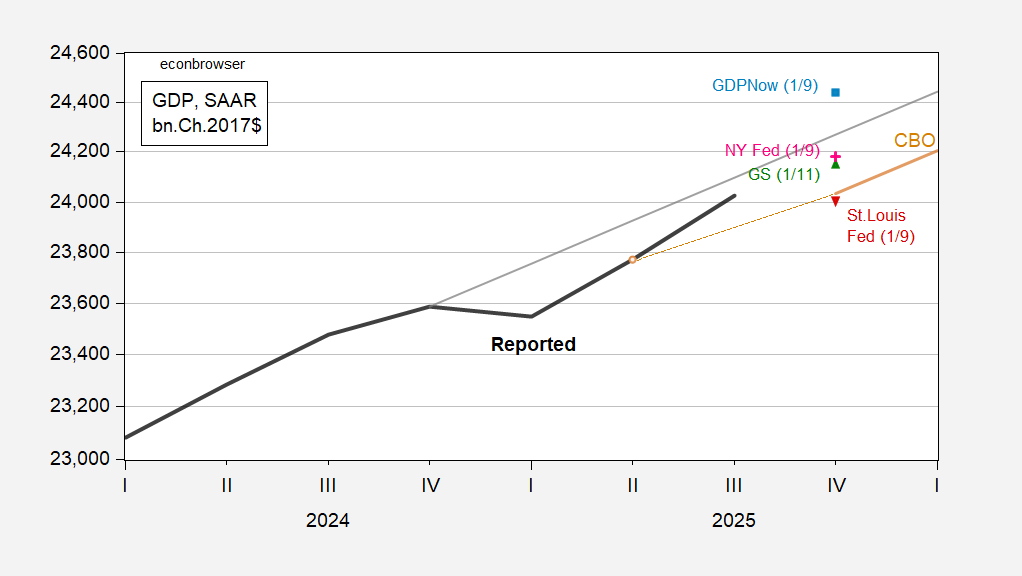
Figure 1: GDP as reported (bold black), CBO January projection (tan), 2023-24 stochastic trend (gray), Goldman Sachs of 1/11 (green triangle), GDPNow of 1/9 (light blue square), NY Fed of 1/9 (pink +), St. Louis Fed (inverted red triangle), all in bn.Ch.2017$, SAAR. Source: BEA, CBO, Goldman Sachs, Atlanta Fed, NY Fed, St. Louis Fed, and author’s calculations.
Employment indicators continue to diverge from output indicators, most recently monthly GDP:
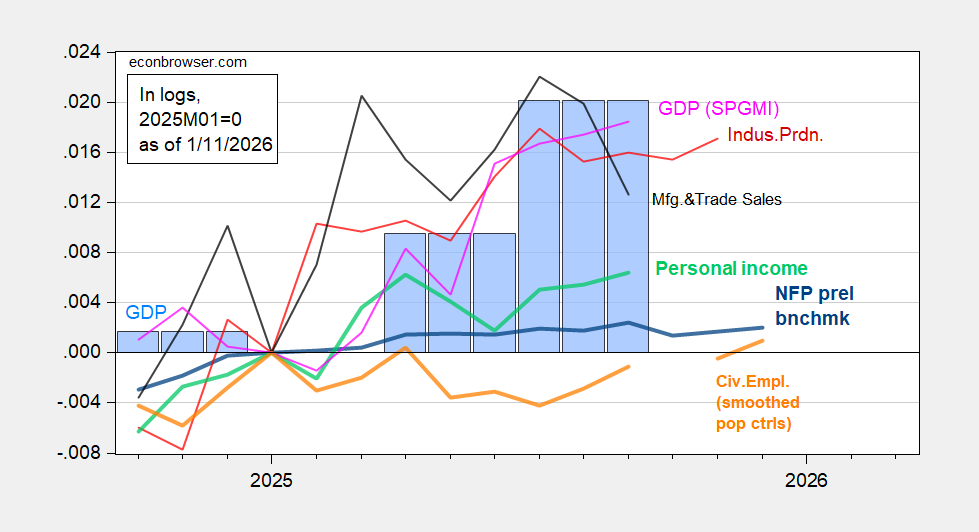
Figure 2: Implied NFP preliminary benchmark revision (bold blue), civilian employment with smoothed population controls (bold orange), industrial production (red), personal income excluding current transfers in Ch.2017$ (bold light green), manufacturing and trade sales in Ch.2017$ (black), and monthly GDP in Ch.2017$ (pink),GDP (blue bars), GDP (blue bar), all log normalized to 2025M01=0. Source: BLS, ADP, via FRED, Federal Reserve, BEA 2025Q3 initial release,S&P Global Market Insights (nee Macroeconomic Advisers, IHS Markit) (1/6/2026 release), and author’s calculations.
Employment is flat (both measures) since the beginning of the year, while September monthly GDP is about 1.8% above January level.
If executing alleged drug runners at sea is not enough a a war crime, it seems they have upped the ante.
The NYT reports that at least the first attack used an military airplane disguised as a civilian aircraft.
“.. laws of armed conflict forbid combatants from feigning civilian status to fool adversaries into dropping their guard, then attacking and killing them. That is a war crime called ‘perfidy.’
Perfidy is not just an international war crime, it is discussed in US military manuals as a crime.
The reason for making perfidy a crime is that it then justifies an enemy considering all civilians and civilian vehicles as enemy targets. It’s why you don’t use Red Cross vehicles for furtive attacks. It puts all non-combatants at risk.
It’s another clear war crime. Military officers should refuse illegal orders. I can see why Hegseth considers Senator Mark Kelly such a threat. He wants to intimidate all officers who might dare to refuse his illegal orders.
https://www.nytimes.com/2026/01/12/us/politics/us-boat-attacks-law.html
Couple of things. Net exports add 1.9% to the GDPNow estimate, based on October trade data. That’s the real thing, within limits – still have revisions to come, and data for the rest of the quarter. That’s not part of real final sales to domestic purchasers, which is generally thought to give a better feel for the underlying growth trend. Similarly, GDPNow has inventories adding about 0.8%, also not “core GDP”. It’s odd that trade and inventories make large adds in the same period, especially with imports falling.
With the two non-core categories adding 2.8 ppts to the estimate, core growth is 2.8 ppts slower. I assume other, lower estimates of Q4 GDP growth take some part of that 2.8 ppts into account, but make a judgement to leave some of it out based on assumptions about November and December. I also assume that other forecasts take account of the government shutdown, which GDPNow can’t do.
Note S&P (among others) has revised PCE’s contribution to Q3 lower based on a downward revision to September data, which would mean slower Q3 GDP growth and a lower base for Q4. That reduces the disconnect between GDP and hours worked a little bit.
Consumption collapsed during the shutdown. Once its put on the books, GDP numbers will collapse. Now and GS is ignored until they correct their errors.