Q4 GDP growth halved, Q4 consumption undershoots consensus by nearly half percentage point (ann’d):
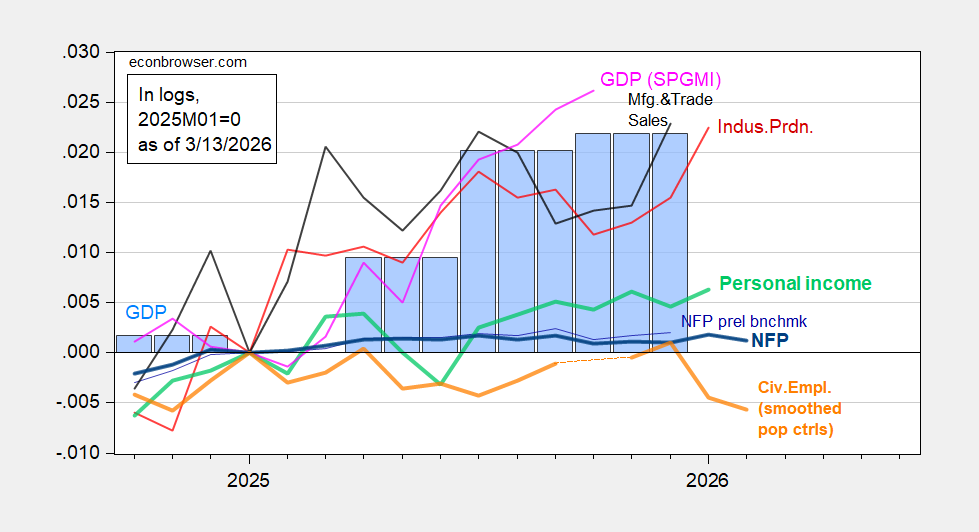
Figure 1: Implied nonfarm payroll (NFP) employmennt preliminary benchmark revision (thin blue), NFP employment (bold blue), civilian employment with smoothed population controls (bold orange), industrial production (red), personal income excluding current transfers in Ch.2017$ (bold light green), manufacturing and trade sales in Ch.2017$ (black), and monthly GDP in Ch.2017$ (pink),GDP (blue bars), all log normalized to 2025M01=0. Source: BLS via FRED, BLS, Federal Reserve, BEA 2025Q4 2nd release,S&P Global Market Insights (nee Macroeconomic Advisers, IHS Markit) (1/22/2026 release), and author’s calculations.
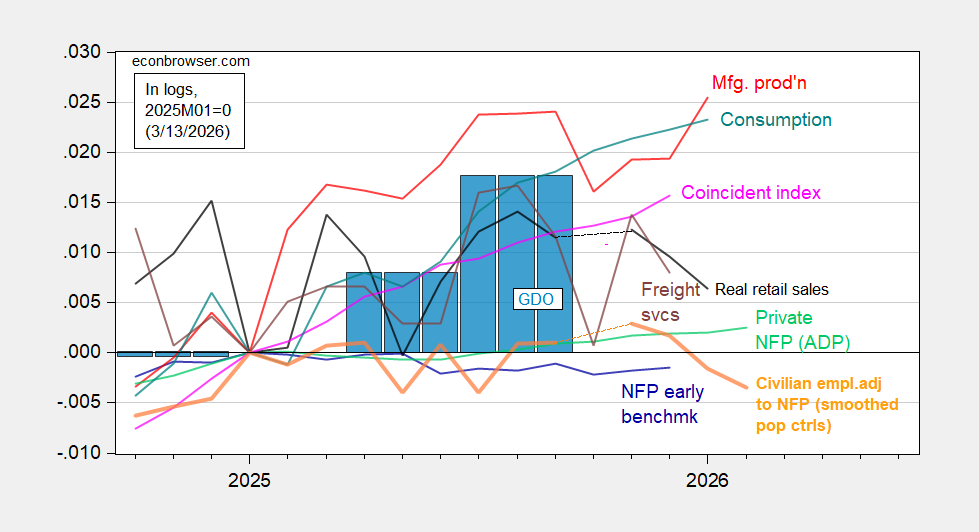
Figure 2: Implied Nonfarm Payroll early benchmark (NFP) (blue), civilian employment adjusted to NFP concept smoothed population controls (bold orange), manufacturing production (red), ADP private nonfarm payroll employment (green), real retail sales, CPI deflated (black), freight services indexes (brown), and coincident index in Ch.2017$ (pink), GDO (blue bars), all log normalized to 2021M11=0. Source: BLS, ADP,via FRED, Philadelphia Fed [1], Philadelphia Fed [2], Bureau of Transportation Statistics, Federal Reserve via FRED, BEA 2025Q4 2nd release, and author’s calculations.
Nitrogen fertilizer is produced primarily by using natural gas to create hydrogen, which is then combined with nitrogen from the air under high pressure (Haber-Bosch process) to make ammonia, later converted to urea. Roughly 30% to 50% of global seaborne urea-based fertilizer exports transit the Strait of Hormuz, making it a critical choke point for global food supply. The Trump administration is creating a global humanitarian crisis of epic proportions. A potential “Super El Niño” is forecasted to develop in the Pacific Ocean later in 2026, with a high probability (62% chance) of emerging by June-August and strengthening through the fall and winter. It is expected to peak between October and December 2026, causing significant global temperature increases. A global famine is in the making.
I bet Stephen Miller is cheering this employment decline because it is a sign of success of his racial and intellectual purge campaign. And now, young white men looking for honest work can be trained to fight the ten year campaign in the Zagros mountains.
The felon-in-chief has threatened to bomb Kharg Island’s oil infrastructure if Iran doesn’t open the Strait of Hormuz. This is a game of chicken, and sound like desparation to me. His threat came while oil markers are closed, so we won’t know for a while how oil prices respond. Iran has been shipping oil from Kharg to China, and hasa deal to let Indian oil through so this is a threat to China’s and India’s interests, as well as to Iran’s oil exports.
On the assumption that the felon hasn’t thought clearly about the likely outcome of this threat, let’s do it for him:
– Iran chickens out. That would mean that Iran loses it’s most important leverage in this war, with no reason to think the U.S. and Israel would stop bombing. It would also make future attacks on Iran more likely, because Iran becomes known for chickening out. This option can be reversed at Iran’s choice, so might have appeal to Irab, despite the obvious drawback.
– Iran doesn’t chicken out, and we bomb Kharg Island oil facilities. That would shut down something like 3.5% to 4.5% of global oil supply for as long as it would take to rebuild export facilities for Iran, and wouldn’t open Hormuz. This option is permanent – you can’t unbomb Kharg Island.
– The felon chickens out. That leaves the Strait closed and Iran picks up a win. This option can be reversed, and would be called a delay; the felon would not admit to having initially chickened out.
Because options 1 and 3 leave the most flexibility, they seem to me the most likely, but I’m the wrong guy to handicap this one. I mean, the worst people in the world are making the decision on both sides. One side is trapped in a corner, the other unable to absorb information or think through complex problems.
We probably shouldn’t ignore the possibility that bombing Iran’s military sites on Kharg Island is a precursor to invasion, and that the threat of bombing is a feint.
On that point:
“Defense Secretary Pete Hegseth has approved a request from U.S. Central Command, responsible for American forces in the Middle East, for an element of an amphibious-ready group and attached Marine expeditionary unit to head to the region, according to U.S. officials.”
https://www.wsj.com/world/middle-east/us-strait-of-hormuz-ship-escort-95d6daf0