Gallup and U.Michigan way down, Conference Board trending sideways.
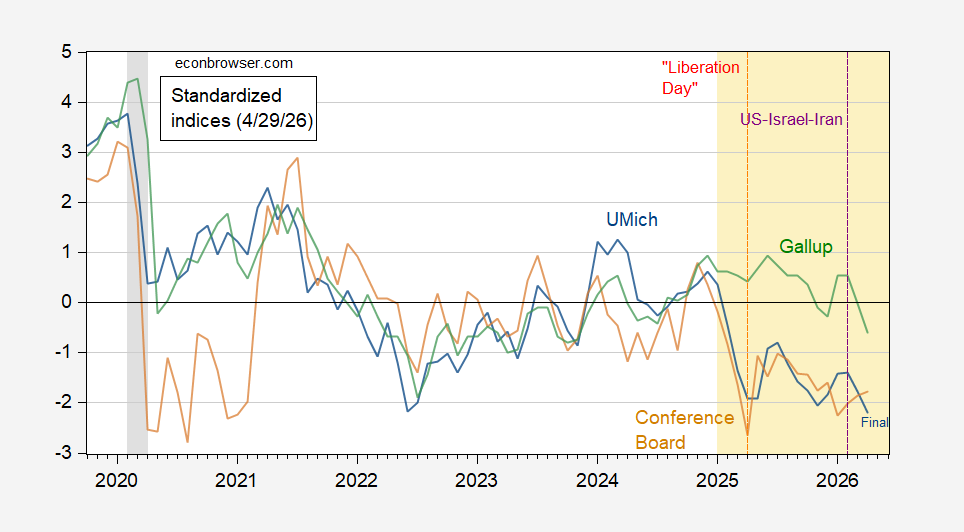
Figure 1: U.Michigan Economic Sentiment (blue), Conference Board Confidence Index (brown), Gallup Confidence (green), all demeaned and divided by standard deviation 2021M01-2025m02. NBER defined peak-to-trough recession dates shaded gray. Red dashed line at “Liberation Day” Source: UMichigan, Gallup, Conference Board, NBER, and author’s calculations.
In order to summarize the movements, I calculate the first principal component of all three (logged) indices:
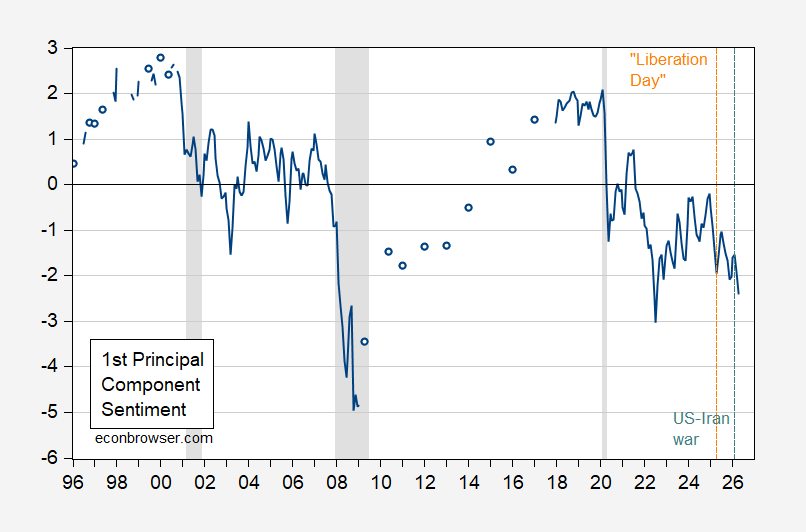
Figure 2: First (unweighted) principal component of U.Michigan, Conference Board, and Gallup consumer confidence/sentiment measures. NBER defined peak-to-trough recession dates shaded gray. Source: UMichigan, Gallup, Conference Board, NBER, and author’s calculations.
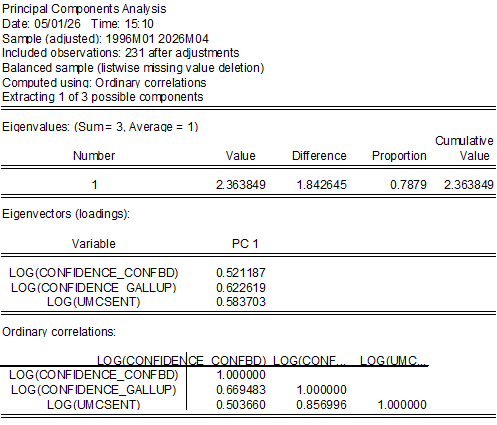
Over the 1996M01 period, the Gallup measure has the highest factor loading in the first principal component:
I don’t know why Gallup diverged from Michigan and Conference Board measures between the tariff fiasco and the Iran fiasco. What seems obvious, though, is that the Iran fiasco has wrought a change in whatever caused that divergence. The hold-outs are no longer holding out; maybe they don’t buy eggs but do buy gasoline?
Sampling bias? Gallup has changed its political polling operation. Has it changed its approaches across the board? Gallup deviation begins at start of trump term.
Off topic – hungry people:
The head of Tara, a giant global fertilizer maker, says the closing of the Strait of Hormuz will lead to 10 billion fewer meals every week:
https://www.bbc.com/news/articles/cpwp50v4ye7o
At 8.3 billion people times 3 meals a day, 7 days a week, that’s 174 billion meals per week. This estimate says we’re gonna get a roughly 6% reduction in food consumed around the world. Y’all understand that’s a generous estimate, right? Not everyone is lucky enough to get three meals each day. The ones who already don’t get 3 squares are the ones who will now have even less to eat.
Like most forms of consumption you can think of, a shortage of meals hurts the poor most. That’s not just because of a money shortage among the poor. As the head of Yara points out, the biggest crop losses come where fertilizer use is already lowest. That’s mostly in poor countries. Let’s think about the chain of effects to the poorest people in a case like this:
A) BoP Context:
1)The poorest people mostly live in the poorest countries.
2) The U.S. has drastically cut aid to the poorest countries.
3) The aid cut hurts food imports directly, but also indirectly through damage to the balance of payments.
4) For poor countries which are net fossil-fuel importers, the balance of payments is also hurt by high oil prices; not much left for food imports.
B) Fertilizer and Fuel Micro Context
1) The poorest people mostly live in the poorest countries.
2) The poorest countries already use less fertilizer per acre than better-off countries, and the greatest harm from a fertilizer shortage is where fertilizer use is already low, says the head of Yara.
3) Petroleum products are also expensive and in short supply, and are needed for food production. The poorest petroleum-net-importing countries will have least access to petroleum imports.
BoP and micro effects together mean food availability for the poorest people is doubly hurt by the Iran war. We started the Iran war.
Conclusions:
The Iran war is also a war against the world’s poor, most of whom are brown-skinned. Nothing in the rhetoric or action from the war-criminal-in-chief or his administration addresses the harm to these people.
Iran offered to let fertilizer shipments proceed unhindered through the Strait of Hormuz in recognition of the damage a fertilizer shortage could cause. I don’t know the status of that offer, but I know the U.S. began blockading Iranian ports just days after Iran offered passage for fertilizer shipments, and no fertilizer has cleared Hormuz since.
Remember that Obama agreed to an oil-for-nukes deal with Iran. It worked. The war-criminal-in-chief repudiated that deal because it was Obama’s deal and he repudiated everything Obama did. And because Bibi told him to. Bibi said “Bomb Iran” because without the oil-for-nukes deal, Iran was a threat to Israel – go figure. So the criminal bombed Iran. Bibi said “Go to war with Iran, because the bombing didn’t work like we said it would.” So the criminal went to war with Iran. The war didn’t go the way Bibi said it would, so the global economy is at risk and the world’s poor face greater hunger than before – they were already quite hungry. Neither Bibi (a war criminal) nor our president (a war criminal) have said, much less done, anything about the hunger threatening the world’s poorest people as the result of their war.
Of course they haven’t. Those hungry people are not white, not rich, not Israeli, not MAGA, so they don’t matter. ‘Cause that’s who we are now.
Menzie recently asked how badly Russia’s economy is doing:
https://econbrowser.com/archives/2026/04/how-badly-is-the-russian-economy-doing
Russians are aware of the problem. From CNN:
“Speaking in Russia’s State Duma (parliament) last week, [Communist Party leader Gennady] Zyuganov warned the country could face a Bolshevik-style revolution if the government fails to address the weakening economy.”
https://edition.cnn.com/2026/05/02/business/putin-wartime-economy-mall-workers-intl-cmd
The article mentions a sharp divergence of the fortunes of the rich, who have prospered during the war against Ukraine, and the rest of the population. That might explain why Zyuganov, steeped in communist thought, sees a risk of revolution.
I blame Ukraine. From the Moscow Times:
“In its latest forecast, CMAKP (Center for Macroeconomic Analysis and Short-Term Forecasting) said hopes that surging global oil prices would give Russia’s economy a meaningful boost were unlikely to materialize because repeated attacks on ports and refineries were undermining the country’s ability to export crude and fuel.”
https://www.themoscowtimes.com/2026/05/01/russian-growth-outlook-darkens-as-ukraine-hits-oil-infrastructure-a92665
Ukrainian attacks have damaged enough of Russia’s oil infrastructure that domestic oil storage has filled to near capacity. As is happening in the Persian Gulf, the next step is to stop pumping crude because there’s no place for the oil to go. That’s made worse by destruction of storage facilities, as has happened in places like Black Sea port Tuapse. Attacks on Russia’s shadow tanker fleet reduce exports and storage capacity for oil. Ukraine has hit two more tankers in the past day.
There is a parallel here with the war against Iran. Both Putin and our own war-criminal-in-chief started wars they thought would be easy to win, and are now dithering because there’s no face-saving way out. Both wars have imposed strains on global food and energy supplies. Russia’s economy will suffer for years, as will the oil economy of the Gulf.
Ya knew this was coming:
Bigbanks are thrashing around, looking for ways to unload data-center loans:
https://enterpriseai.economictimes.indiatimes.com/news/industry/banks-offload-ai-data-centre-debt-amid-rising-exposure-risks/130767016
But wasn’t Morgan Stanley already doing some kind of finance magic to unload data-center debt back in December?:
https://www.webpronews.com/morgan-stanley-explores-srt-deals-to-mitigate-ai-data-center-loan-risks/
TD is considering the same voodoo finance structure that Morgan Stanley is using:
https://www.bloomberg.com/news/articles/2026-04-22/td-bank-mulls-hedging-data-center-debt-with-rare-srt-deal
So now more banks are ditching AI-related debt, with Morgan Stanley at least 5 months into its effort to do so and still not done. Shortage of suckees, maybe?
Of course, if these banks can find enough suckers to buy data-center debt, they’ll keep making these loans even though they’re scared to hold them. The music doesn’t have to stop yet.
Just for context, investment in computers and software was a larger share of GDP in the latest quarter than during the tech bubble:
https://fred.stlouisfed.org/graph/?g=1VPAg
the problem with data centers is that it takes a lot of electricity to operate them. seems people are just now coming around to this issue. in order for large scale data centers to operate, somebody needs to build out a bunch of extra power. if that power is not produced, the data centers cannot run. who wants to own the loan on a dark data center? it seems some of these data centers were built under the false impression electricity would be available as needed at current market prices, but nobody seemed to consult the power companies on this issue? move fast and break things, right?
a similar situation has occurred in south texas regarding water. a bunch of industrialists came into corpus christie with huge demands for water in order to operate. the city approved the industry, but never increased the supply of water. this summer, corpus christie will run out of water because a bunch of businesses will use it all up, or need to close shop.
public utilities such as electricity and water need to be monitored much more closely when massive growth impacts their supply potential.
“Project Freedom” so far: Between 3 and 10 ships are transiting the Strait of Hormuz today, depending on who’s counting:
https://hormuzstraitmonitor.com/
https://www.hormuztracker.com/
The pre-war daily average was 138 ships.
I guess today’s special is a TACO/NACHO platter.