From Purdue/CME Ag Econ Barometer:
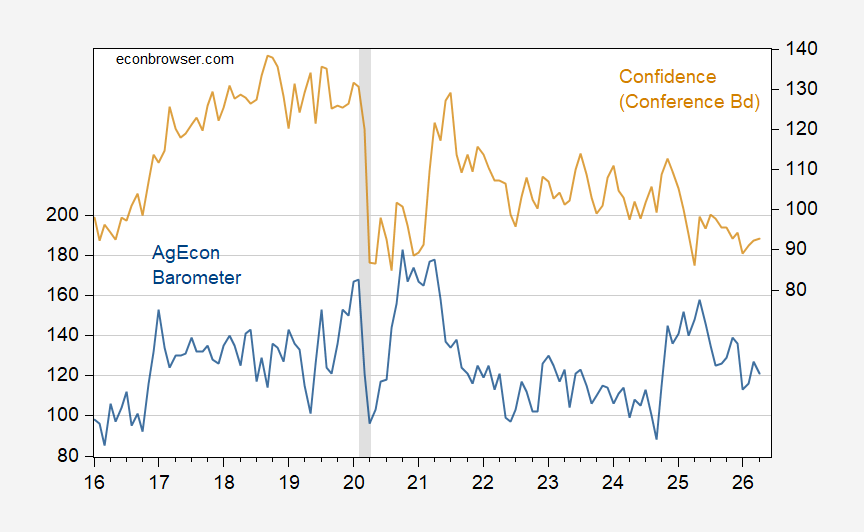
Figure 1: Ag Econ Barometer index (blue, left scale), Consumer Confidence (brown, right scale). NBER defined peak-to-trough recession dates shaded gray. Ag Econ Barometer Oct 2015-Mar 2016 = 100. Source: Purdue/CME, Conference Board, NBER.
The trade war has gone on in earnest for over a year — since “Liberation Day”, and now two months of military hostilities with Iran. Despite the well-publicized hits to farm net income caused by the trade war, the barometer remains relatively high — higher than end 2024. This is a manifestation of the phenomenon the Economist noted in “Donald Trump is crushing America’s farmers—yet they back him”
What (empirically) explains the resilience of farm sentiment? One might be tempted to look to high agricultural commodity prices relative to input costs. In Figure 2, I plot the Barometer against the log ratio of agricultural commodity prices to fertilizer prices:
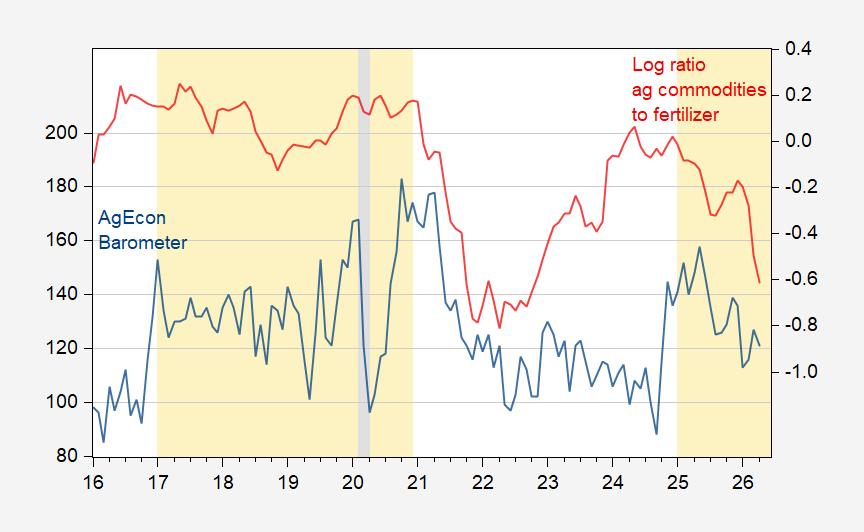
Figure 2: Ag Econ Barometer index (blue, left scale), log ratio of world price of agricultural commodities over fertilizer (red, right scale). NBER defined peak-to-trough recession dates shaded gray. Orange shading denotes Trump administrations. Source: Purdue/CME, World Bank, NBER, and author’s calculations.
Interestingly, a regression of the Barometer on the relative agricultural commodity price and fertilizer price yields an adjusted R2 of only 7%. Notice, graphically, a tremendous amount of variation is explained by the Trump administrations. (AGBAROMETER soundly rejects conventional unit root tests, and fails to reject the KPSS trend stationarity test).
AGBAROMETER = 2.62 + 0.29TRUMP + 1.61AGPRICE – 0.19FERTPRICE
Adj-R2 = 0.34, SER = 0.17, DW = 0.66. Sample 2016M01-2026M04. Bold coefficients indicate significance at the 10% level using HAC robust standard errors.
AGBAROMETER is the 100 point index divided by 100, AGPRICE is the log real (core CPI deflated) price of agricultural commodities, ad FERTPRICE is the corresponding log fertilizer deflated price.
It’s hard to see the relative impact of these variables, so I report the scaled (standard deviation normalized) coefficients below:
AGBAROMETER = 0.70TRUMP + 0.63AGPRICE – 0.31FERTPRICE
In other words, a one standard deviation change in the TRUMP variable in and of itself boosts AGBAROMETER by 0.7 standard deviations.
One would think that farmer support would be crumbling. The Economist article notes:
It would be easy to blame Mr Trump for the downturn; after all, he campaigned on promises to bring down prices and revive the heartland. But rural America does not. The president’s favourability rating is higher among rural voters than among any other group in our survey. Most still think he is doing a good job. In interview after interview with The Economist, farmers said they trust the administration—but that they need help to recoup the losses its foreign policy is causing them.
The sentiment measured by the Ag Econ Barometer pertains to the economic outlook facing farmers It doesn’t assess directly whether farmers think things are going well. Recently, they have taken to asking a “right-direction/wrong direction” question. Here’s the differential, plotted against expectations.
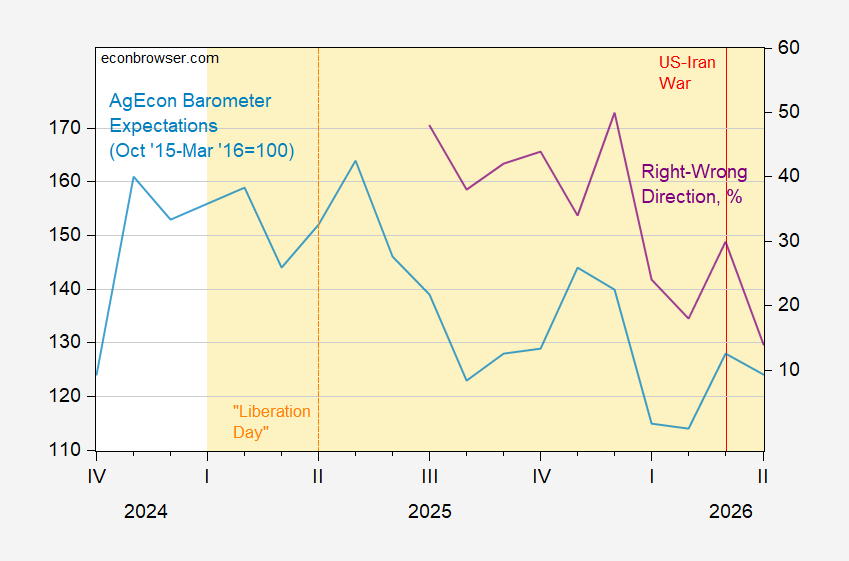
Figure 3: Ag Econ Barometer Expectationns index (light blue, left scale), Country right direction-wrong direction differential, % (purple, right scale). Ag Econ Barometer Oct 2015-Mar 2016 = 100. Orange shading denotes Trump administrations. Source: Purdue/CME, author’s calculations.
Hence, while the “right direction/wrong direction” differential is still positive at 14 points, it is definitely shrinking over the (short) span of data we have.
Way off topic – The U.S. has a new counter-terrorism strategy, courtesy of the felon-in-chief. The principle author is Sebastian Gorka, the felon’s head of anti-terrorism. Gorka is of Hungarian descent and is associated with pro-NAZI and paramilitary organizations in Hungary, as well as with the alt-right in the U.S. and UK.
Here’s a particularly creepy paragraph from the introduction, if you read it in the manner of “every accusation a confession”:
“Our counterterrorism operations will be
executed apolitically and founded upon reality-based threat assessments. Our counterterrorism powers will not be used to target our fellow Americans who simply disagree with us. We will not permit the weaponization of America’s unparalleled CT capabilities for partisan purposes and in contravention of every American’s God-given rights.”
The intro claims to differentiate between good and bad counter-terrorism. What’s the bad kind? The kind Biden did, of course:
“The fact pattern under the Biden Administration was clear: individuals at the highest level of the U.S. Government used their significant powers to politically target individuals in the interests of those they favored, wanted to keep in power, or to help win elections.”
In other word, the felon-in-chief was investigated by the Justice Department. He was also found guilty of several felonies in state courts and was adjudicated to have committed at least one rape. So Biden bad, felon good.
Other than the usual “right-wing good, left-wing bad” stuff, what’s new in this document? Here ya go:
“Currently we face three major types of terror groups:
• Narcoterrorists and Transnational Gangs
• Legacy Islamist Terrorists
• Violent Left-Wing Extremists, including Anarchists and Anti-Fascists”
In other words, Venezuela, Iran and No-Kings/Black-Lives-Matter/Anti-ICE protestors.
It should be noted that this “reality-based threat assessment” of major types of terrorists is at odds with the facts. As of last September:
“The US justice department has scrubbed a study from its website concluding that far-right extremists have killed far more Americans than any other domestic terrorist group…”
https://www.theguardian.com/us-news/2025/sep/17/justice-department-study-far-right-extremist-violence
The right in the U.S. is the greatest source of terrorist activity. Gorka and his felon-master are right wingers, and this document is just more right-wing agitprop.