From today’s U.Mich release, final 1 yr revised up from 4.5% to 4.8%, and 5 yr revised up from 3.4% to 3.9% (!).
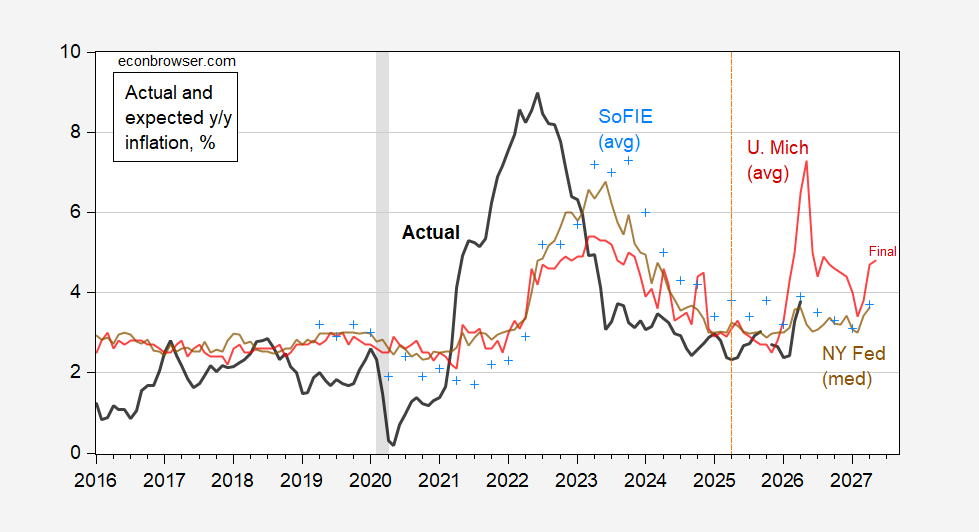
Figure 1: Year-on-Year CPI inflation (bold black), forecasted U.Mich mean inflation (red), NY Fed median (brown), SoFIE (sky blue +), all in %. NBER defined peak-to-trough recession dates shaded gray. Source: BLS, U.Mich., NY Fed, Cleveland Fed, and NBER.
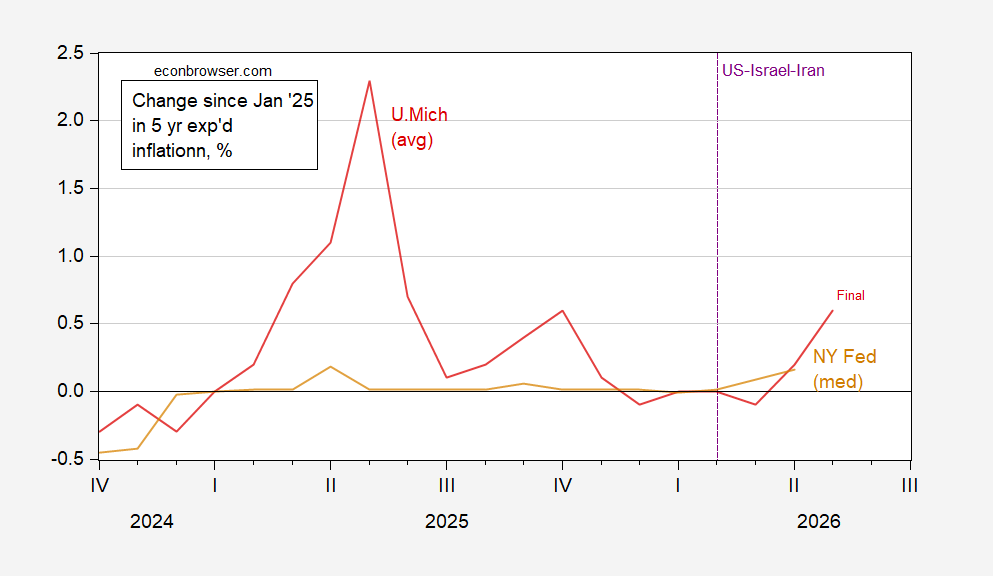
Figure 2: U.Mich five year ahead expected inflation (red), NY Fed 3 year ahead expected inflation (brown), %. Observations are for f survey date (May observation is May 2026 observation for May 2031 y/y inflation). Source: U.Mich, NY Fed.
If the 2.5% CPI y/y inflation is consistent with 2.0% PCE inflation, then we are now 1.4% above Fed target.
Note that these are measures of central tendencies for full sample. As Hsu (2026) notes regarding the U.Mich series, there is some dispersion over partisan grouping, while independents track higher than overall.
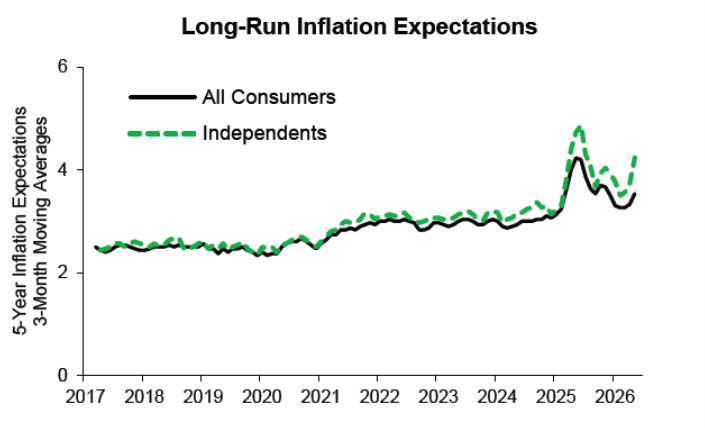
Source: Hsu (2026).