Using the HP filter applied to U.Michigan Sentiment, consumers don’t seem too gloomy relative to “average”. But they do seem gloomy relative to observed unemployment and inflation rates.
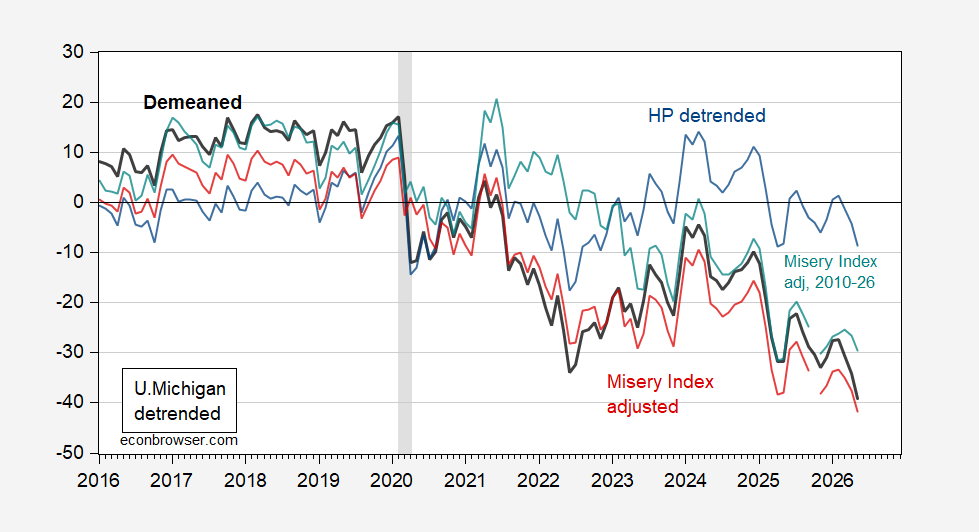
Figure 1: University of Michigan Sentiment demeaned (bold black), HP detrended (blue), Misery Index regression residual (red), Misery Index 2010-26 residual (teal). NBER defined peak-to-trough recession dates shaded gray. May observations for unemployment at April level, for inflation using Cleveland Fed nowcast. Source: U.Michigan, BLS, Cleveland Fed, NBER and author’s calculations.
Note that according to the HP filter, which essentially resets the mean value post 2022 to a new level, consumers are not too far away from “trend”. A regression of Sentiment on the unemployment rate and inflation (which when summed would equal the Misery Index) yields residuals shown as red line above. In this context Sentiment does seem inexplicably low.
Taking into account an apparent structural break in the Sentiment-Misery relationship around 2010 (see this post), I estimate the Sentiment-Misery relationship 2010-2026. The resulting coefficient on inflation is about twice (in absolute value) that on the unemployment rate. This finding is consistent with an elevated dislike for inflation in after years of moderate to low inflation. The resulting residual is about 1/4 less than that for the full-sample Sentiment-Misery residual, but still large.
As noted in this post, only be estimating the Sentiment-Misery relation over the 2022-26 period will one obtain a result similar to the HIP filtered series. In this sense, it’s not clear whether Sentiment levels would signal a recession as it has in the past.