The WSJ July survey is out:
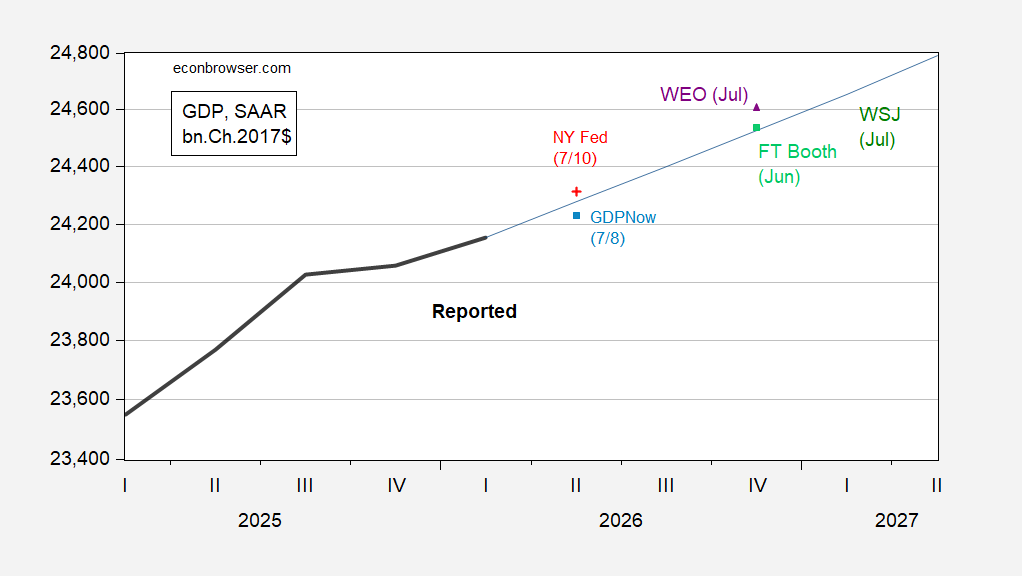
Figure 1: GDP (bold black), WSJ July survey mean (blue), FT-Booth June survey (light green square), WEO July (purple triangle), GDPNow of 7/8 (light blue square), NY fed nowcast of 7/10 (red +), all in bn.Ch.2017$ SAAR. Source: BEA, WSJ, IMF, Booth, NY Fed, Atlanta Fed, and author’s calculations.
Nowcasts bracket Q2 growth in the WSJ survey (Jul 2-Jul 7). The FT-Booth June median level matches the WSJ mean for Q4 GDP. While Q2 growth is slightly higher in current WSJ survey vs. April (2.12% vs. 1.65%), the implied level of GDP is essentially the same in the two surveys, because of a lower GDP outcome in Q1.
There is some dispersion in forecasts, but only one forecast indicates two consecutive quarters of negative q/q growth. In addition, the subjective recession probability over the next 12 months has dropped from 33% to 25%.
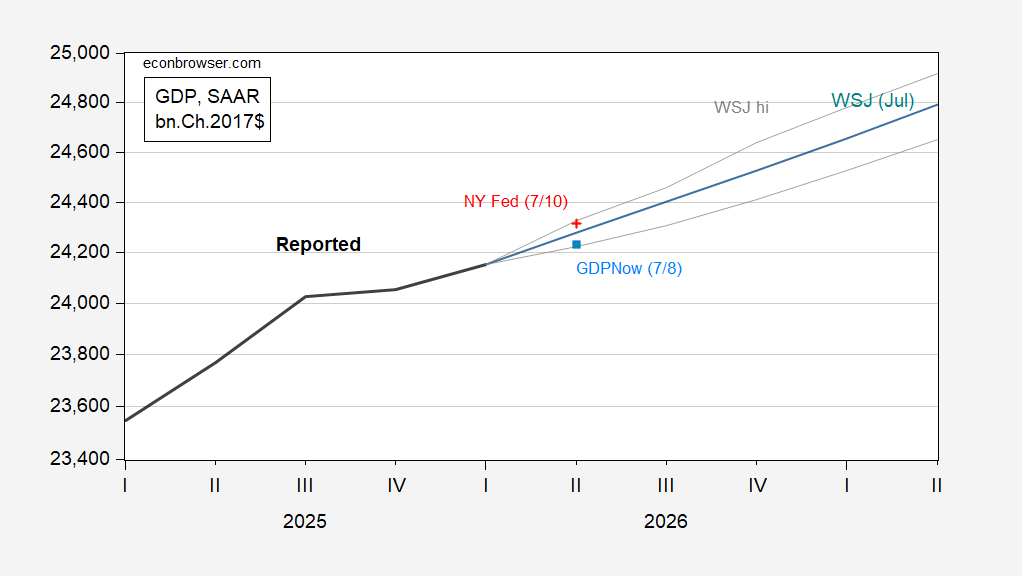
Figure 2: GDP (bold black), WSJ July survey mean (blue), 20% trimmed high/low (gray lines), GDPNow of 7/8 (light blue square), NY fed nowcast of 7/10 (red +), all in bn.Ch.2017$ SAAR. Source: BEA, WSJ, NY Fed, Atlanta Fed, and author’s calculations.
Note that the latest WSJ forecasts were compiled largely before the re-escalation of the US-Iran war. This applies to interest rate forecasts — the trajectory of which has shifted up since January’s forecast.
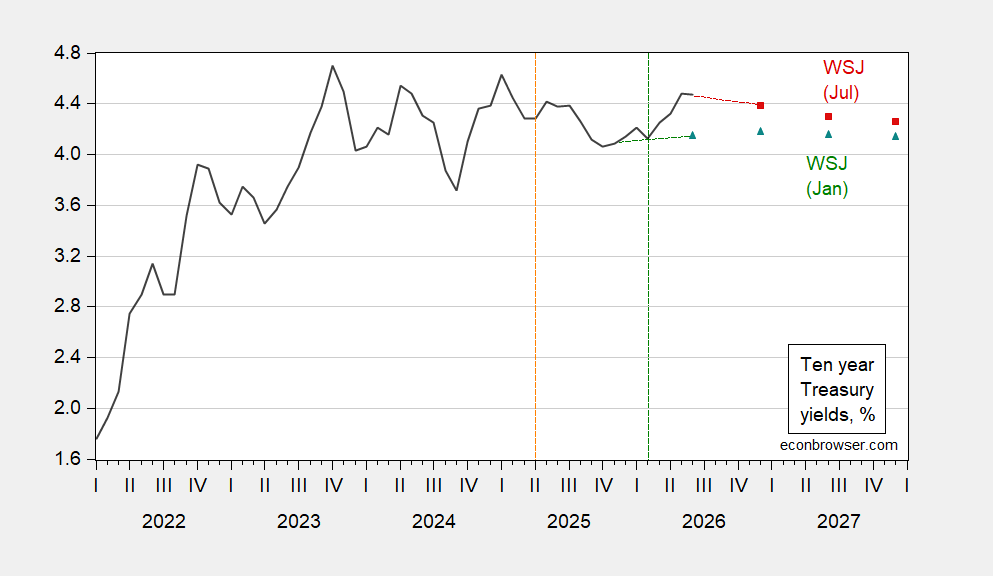
Figure 3: Ten year Treasury yield, avg. of daily (black), WSJ January mean end month (green triangle), WSJ July mean end month (red square), all in %. Orange dashed line at “Liberation Day”, green dashed line at US-Iran War start. Source: Treasury, WSJ.
While forecasted interest rates are only about 20 bps higher as of end-2026, this may come at a time of heightened interest sensitivity.