There has been much hullaballoo about how tight the labor market is given the upward revisions in the August and September figures, on top of the preliminary benchmark revision reported last month.
Dave Altig at Macroblog, Calculated Risk and PGL at Angry Bear are among the many that have discussed the interepretation of these numbers. One point asserted in the press is that the labor market is quite tight, given the revisions and the lower participation rate in recent years. However, as Mark Thoma at Economist’s View has documented, the participation rate has risen in the last year. So it strikes me that it would be a worthwhile exercise to examine how the recently released figures alter our perception of the labor market’s performance in this expansion versus the last.
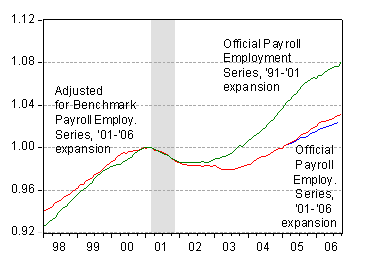
In Figure 1, the official payroll employment series (blue), the payroll series adjusted (by me, see here for an explanation) to incorporate the preliminary benchmark revision (red), and the official series for the previous expansion (green), are illustrated (all normalized to a value of one at the peak).

Figure 1: Official payroll employment-current expansion (blue), Adjusted-for-preliminary-benchmark revision payroll employment-current expansion (red), and official payroll employment (1991-2001 expansion, green), all normalied to value of unity at NBER defined cyclical peak. Gray shading defines NBER defined recession period. Sources: St. Louis Fed FRED II, BLS Preliminary benchmark revisions to establishment survey, author’s calculations, and NBER.
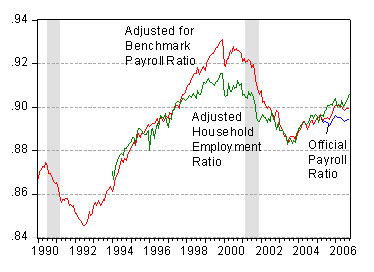
The current expansion’s employment growth (still) looks rather lackluster. However, as noted above, various observers have argued that the lower particpation rate of recent years implies a lower rate of employment growth necessary to accomplish labor market equilibrium. In order to investigate this assertion, I ignore the fact that the participation rate is an endogenous variable, and plot in Figure 2 the official payroll series (blue), the adjusted-for-preliminary-benchmark revision payroll employment series (red), and the BLS’s household employment series adjusted to mimic the establishment series, all divided by the labor force (variable CLF16OV, in FRED II mnemonics). Obviously, since the household and establishment series are collected in different ways, dividing the payroll series by the labor force is not a perfect measure, but hopefully it will pick up the relevant trends.

Figure 2.Official payroll employment (blue), adjusted payroll employment (red) and adjusted household employment (green), divided by labor force. Sources: St. Louis Fed FRED II, author’s calculations, BLS (Nov. 3), and NBER.
What is clear is that only in the case of the BLS’s “adjusted” household series is the labor market nearly as tight as it was at the peak of the 1991-01 expansion. Obviously, using the official payroll employment series, the labor market is not so tight, roughly comparable to the conditions prevailing in 1996. Even incorporating in an ad hoc manner the preliminary benchmark revision, one finds the current market, as measured by the establishment survey, is about at the same level as it was in 1997. Indeed, the strong performance in the last three months now looks very much like a slackening market.
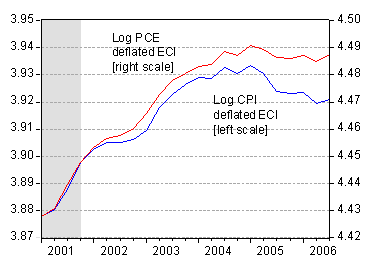
Finally, my skepticism regarding the tight market scenario is buttressed by an inspection of the employment cost (wages plus benefits) index, deflated by either the CPI or the Personal Consumption Expenditure deflator (chain-type index).

Figure 3.Employment cost index deflated by CPI (blue), and ECI deflated by PCE deflator (red). Sources: St. Louis Fed FRED II, author’s calculations, and NBER.
So let’s wait until the November employment situation to see if the market’s as tight as widely perceived (by the financial press, at least).
.
Technorati Tags: payroll employment,
civilian employment, benchmark, and Employment Cost Index
I would like to work, but changing careers to do so is simply not worth it. (Sigh)
Thanks for your work in this area. Bush seems to be baffled by the sour mood of the country despite the “great news about the economy.” Workers know that they aren’t getting raises, their benefits are being cut, health insurance premiums are going up and the insecurity from threatened layoffs. The question isn’t why they are in a sour mood. The question is why the economists seem to be measuring the wrong things.
Some economists prefer the household survey which they say captures the increase of entrepreneurs and independent contractors. I know that economists hate anecdotes and prefer cold statistics but what the heck.
I recently switched from cable TV to Dish Network. It turns out that Dish only handles the satellites and content. The marketing and sales are handled by an independent company. This company then hires “independent contractors” to do the actual installation and service.
In my case these independent contractors turned out to be two men who travel from region to region living out of their pickup truck and staying in motel rooms. For their two hours of work they received a check for $50 which they split with the company and then divide between them. After travel time they can do maybe three or four installations a day to pay for their truck and all of their living and travel expenses. They have no health insurance, no vacation pay, no retirement plan, no workers compensation if injured, no unemployment insurance, no liability insurance and no guarantee of work quantity. That is what it means to be an independent contractor.
As an example of how things have changed in the last 20 years, my local power utility fired all of its maintenance and service employees. They were replaced with independent contractors. My meter reader is now a guy that drives his own pickup truck and has no benefits. These used to be good paying union jobs.
Bush refers to independent contractors as some sort of glorified entrepreneurs. But workers know that independent contractor is just another way of saying second rate job.
Mean wages mean nothing to the average worker today. Growing inequity is the real story.
Thanks Joseph. Self employed, consultant, semi-retired are but euphemisms for unemployed. Many the company, Best Buy, trucking firms, who take advantage of these entrepreneurs . The entrepreneurs get to go belly up more slowly.
Good work, Professor. Thanks!
Thanks for the mention. In my “Are We at Full Employment Yet”, I start with the latest from Dean Baker, mention Mark Thoma of course, and end with your excellent post as you quite rightfully end up with the price of labor observation. Very well done. Of course, I’m hoping David Altig finds a way of defending the Federal Reserve view that Grep Ip ably noted.
Let me suggest a different interpertation of the more rapid growth of the household employment series. It appears to be due to the more rapid growth of employment in small firms. If you look at the long run trend of household employment as a percent of payroll employmnet you find a very long term decline of this ratio
with a few short run counter-trend exceptions.
The Small Business Administration recently did a survey of small vs large firms employment that seems to parallel the ratio of household to payroll employment very closely since 1988.
This survey has not received much publicity because it found results that conflicted strongly with much of the the “received wisdom”. For example it shows that large firms — over 500 employees — that account for only 0.4% of the number of firms has increased their share of total private employment from
45% in 1988 to 50% in 2001 before small firm employment started growing faster. Moreover, it found that large firms average payroll per employee — a good proxy for average pay — was 125% of that in small firms. But they could afford higher pay because revenues per employee in large firms was 158.7% that in small firms.
So maybe the more rapid growth of small firm employment in recent years also explains part of the weak gains in real averge wages.
you can find the study at http://www.census.gov/csd/susb/susbdyn.htm
More relevant than CPI/PCE deflated ECI would be unit labor costs. And unit labor costs have accelerated sharply, just as they did in 1998-2000 and in 1989-90. Indeed, the acceleration have been even sharper now.
And judging from the fact that production indicators like the ISM showed a continued slowdown in the economy, even as the employment report showed a robust increase in both hours worked and average hourly earnings, this indicates to me that productivity is stagnating or falling while unit labor costs is soaring during Q4 2006 as well.
Perhaps someone can enlighten me as to how independent contractors are accounted for in the establishment survey.
If companies fire their employees and replace them with contractors, does employment go down and productivity go up?
Do wages figure into productivity calculations in any way or is it strictly hours. For example, if hourly workers are replaced with contractors at lower wages and fewer benefits but working the same hours, does that affect productivity?
In calculations of average worker wages, are contractors included? Would a shift to low paid contractors be invisible in average wage calculations?
Joseph: From the BLS technical notes:
Don’t know the answers to your questions about productivity calculations.
spencer: An interesting and plausible conjecture. It would take somebody who knew how to manipulate large firm-level data sets to verify it (i.e., somebody other than me).
Thanks to all for the comments! Please read further my colleague Jim Hamilton’s excellent assessment of the benefits of combining the series.
The labor force participation rate did NOT increase in the past year. It has been flat at 66.2% for the last 5 months, and it has been fluctuating between 66.0% and 66.2% since April 2005.
anon: I stand corrected. In the last ten months — since December 2005 — the participation rate has risen (with no declines) from 66.0 to 66.2 in October. In March 2005, this rate was 65.8.