What do you do when one line of the latest government statistical release says that U.S. employment grew by 92,000 jobs during October, while 4 paragraphs later the same report gives the number at 437,000?
“Curiouser and curiouser,” remarked Dave Altig, and New Economist wisely counseled, “don’t believe the hype.” Barry Ritholtz, as usual, didn’t mince words:
Given the magnitude of the subsequent revisions, adjustments, birth/death factors, benchmarkings and other statistical sleights of hand, the initial number has become totally marginalized…. [I]t seems foolish to put too much weight onto whether a monthly data point is 90k or 150k or 230k. If it turns out this single number is plus or minus a million per year, then the monthly data becomes worthless.
Menzie offered some further insights, as did
Calculated Risk, PGL
(and again here), Tim Duy, Dean Baker, Kash Mansori (now at Street Light), and King Banaian.
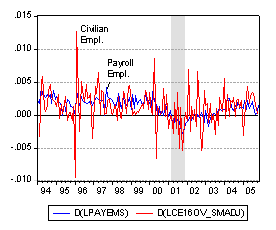
The Bureau of Labor Statistics collects numbers on how many people have jobs in two ways. The establishment survey asks businesses how many people they had working for them that month, while the household survey sends interviewers to specific residential addresses to find out who at that address claimed to be employed each month. Michael Mandel notes that one of the especially curiouser aspects of the recent discrepancies between the two methods is that the government seems to be having a particularly hard time counting the number of people who are working for … the government:
The number of people reporting that they had public sector jobs …has risen by a very solid 430,000 [since last March]…. However, these numbers come from the household survey, which is based on responses from individuals. The payroll survey, which is based on data from unemployment insurance records, shows a much slower growth of government jobs…only 183,000 since March.
One natural reaction, when faced with such a discrepancy, is to conclude that one of the numbers is right and the other is wrong. Good arguments can be marshalled on either side. For example, Tim Kane observed that the payroll survey misses people who work for newly created establishments (part of the reason for the recent big revisions in those estimates) or are self-employed. Spencer England suggests in a comment left here that the more rapid growth of small firms in recent years might also account for more employment growth being counted by the household survey. On the other hand, Menzie noted that the household survey displays four times the variance, which to me indicates pretty clearly that typically it is much less reliable:

When faced with two different estimates of a magnitude such as the growth in employment, most statisticians would choose not to throw one number out altogether, but rather to combine the two. If the two estimates are unbiased and uncorrelated with each other, the optimal weights are inversely proportional to the variances of the measurement errors. Since the measurement error in the household survey is bigger, it should be given a smaller weight, but that does not mean the number should be ignored completely.
Actually, there’s a third data source that doesn’t get discussed too much, but also may be very helpful, which comes from Automatic Data Processing. This company uses data obtained from payroll services provided for 225,000 businesses in America employing 14 million workers. They release monthly an estimate of what the total job growth for all establishments would be, based on the data they collect.
| BLS payroll (initial release) | Household survey | ADP estimate | Weighted average | BLS payroll (current esimate) | |
|---|---|---|---|---|---|
| Apr | 138 | 47 | 178 | 133 | 112 |
| May | 75 | 288 | 122 | 101 | 100 |
| Jun | 121 | 387 | 368 | 172 | 134 |
| Jul | 113 | -34 | 99 | 97 | 123 |
| Aug | 128 | 250 | 107 | 138 | 230 |
| Sep | 51 | 271 | 78 | 76 | 148 |
| Oct | 92 | 437 | 128 | 130 | 92 |
The table above compares these three estimates, and illustrates the consequences of regarding the initial BLS payroll estimate as 8 times as reliable as either of the other two, that is, using as weights 0.8, 0.1, and 0.1. The resulting “weighted average” column basically nudges the payroll numbers in the direction implied by the average of the other two. It’s also interesting to compare this with what the BLS itself later reported the payroll estimates to be on the basis of new and revised data. The other two series have typically been suggesting recently that employment growth was stronger than the initial payroll estimate implied. If you had bet on revisions in that direction, you generally would have been correct.
If the same pattern continues to hold, we might expect the October payroll figure of 92,000 new jobs to be revised upward in the months to come, with 130,000 perhaps a better estimate than is the initial figure. If that proves to be the case, then combined with the huge upward revisions to the August and September estimates, this is a much better employment report than I had been expecting.
As a statistician, it would also be nice to look for some other corroboration as well. The sharp rise in interest rates immediately following the release of the BLS numbers suggests that Wall Street is seeing this the same way I am:
 |
Technorati Tags: macroeconomics,
employment,
BLS,
BLS household survey
What do you do when one line of the latest government statistical release says that U.S. employment grew by 92,000 jobs during October, while 4 paragraphs later the same report gives the number at 437,000?
I say that there’s a need for better data collection. For instance, why not use the Internet to broaden data collection for NFP to encompass more businesses–i.e., make it more of a census than a survey? Surely even the most modest enterprise has an Internet linkup. Providing those that don’t with one isn’t too costly and looks like a far better way of spending public funds than building bridges to nowhere IMHO.
There is a recent BPEA report on this topic, if you’re interested. The abstract is here: http://www.brookings.edu/press/books/abstracts/BPEA/2200505.pdf
i thought monster dot com has a series that has been indicating labor market strenght for the past year
Interesting post. I like the idea of using all available information, but I wonder how to compute the optimal weights from the ‘variances of the measurement error’ if we don’t know the “truth”? Are you assuming that the fully revised, benchmarked data is “truth” or is the variance itself used as a proxy?
GWG, I haven’t tried to estimate these magnitudes empirically, though it could be done (one would need to assemble the real-time data set to do this). The 8-to-1 factor is used here just for illustration. The Perry article to which Ryan calls attention above has some statistical evidence supporting a choice of 1-to-1, though that seems inconsistent with the variances observed in the revised data.
Four wrongs make a right.
JDH,
Does this investigation into shenanigans in the market for US treasuries affect/negate your attempts to correlate various market indicators to US treasury fluctuations?
http://money.cnn.com/2006/11/06/news/bondprobe/index.htm?postversion=2006110611
I think they’re just smoking weed – like the analysts who upgraded WCI and then downgraded it a few weeks later!
Economists Are Destroying America
Economists, politicians, and executives from both parties have promised American families that free trade policies like NAFTA, CAFTA, and WTO/CHINA would accomplish three things:
Increase wages
Create trade surpluses (for the US)
Reduce illegal immigration
Well, their trade policies have been in effect for about 15 years. Lets review the results:
Declining real wages for 80% of working Americans (while healthcare, education, and childcare costs skyrocket)
A record-high 46 million Americans who dont have health insurance (due in part to declining wages and benefits)
Illegal immigration out of control
Soaring trade deficits, much with countries that use slave and child labor
Personal and national debt both out-of-control
Global environments threatened by lax trade deal enforcement
Economists Keep Advocating Policies That Arent Working
Upon seeing incontrovertible evidence of these negative trade agreement results, economists continue with Pollyannish blather. Some say, Cheer up! GDP is up and the stock markets doing fine. Others say, Be patient. Stay the course. Free trade will raise all ships.
Even those economists who acknowledge problems with trade agreements offer us only half-measuresadjusting exchange rates, improving safety nets, and providing better job retraining. None of these will close the wage gap in Americaand economists know it.
Why Arent American Economists Shouting From Street Corners?
America needs trade deals that support American families and businesses in terms of wage, environmental, and intellectual property abuses. Why arent economists demanding renegotiation of our trade deals? There are three primary reasons:
Economists are too beholden to corporations and special interests that provide them with research grants.
Economists believebut refuse to admitthat sacrificing the American middle class is necessary and appropriate to generate gains in third world economies.
Economists refuse to admit they make mistakes.
Economic Ambulance Chasers
Now more than ever, Americans need their economists to speak truth and stand up to their big business clients. Instead, economists sound like lawyers caught chasing ambulances: they claim theyre doing it for our benefit.
A record-high 46 million Americans who dont have health insurance (due in part to declining wages and benefits)
Illegal immigration out of control
What’s that as a percentage of Americans? The population does keep increasing, so one expects records to be continually set. What’s that as a percentage of non-immigrant and non-illegal immigrant Americans? The statistics I’ve seen that give the 46 million figure are counting illegal and legal immigrants in that figure. The percentage of native-born Americans with insurance hasn’t budged. What has happened is that poor people from abroad keep coming here and becoming better off, but still worse off than the average American. Do you wish to condemn them to worse poverty by not letting them come here?
I note that a number of scenarios are factored into reaching unemployment rates but haven’t seen any one (so far) who has considered the fact that pulling hundreds of thousands of service men to duty has left that many jobs open for the once unemployed. How about that????
Leo