From Saturday’s New York Times, the case is made that the G-7’s dream scenario of global rebalancing, with more rapid growth in Europe pulling up demand for US goods, is finally underway:
A weakening economy is getting some relief from abroad as American companies step up their sales to foreigners, the latest data, released yesterday, suggests.
The government reported both the trade deficit for February, which shrank slightly, and the Producer Price Index for March, measuring the prices of merchandise sold to wholesalers and retailers. The prices were flat across an array of products, except for food and energy.
The latest numbers were meaningful, economists said, not on their own, but in the context of the last year. The United States appears to be gradually transferring to Europe and Japan its role as the locomotive for global growth.
“Europe and Japan, and also most of the developing world, are growing more quickly than we are, and now we are finding ways to get a lift from their growth,” said James Paulsen, chief investment strategist for Wells Capital Management in Minneapolis. “It’s the opposite of what happened for a decade.”
The Producer Price Index fit this pattern. The overall increase was 1 percent, down from 1.3 percent in February, but well above the average monthly increase of 0.4 percent over the last six months, the Bureau of Labor Statistics reported.
…
Imports, which totaled $182.43 billion in February, continued to swamp exports at $124.99 billion that month. But over the most recent year, the dollar value of exports has risen nearly twice as much as the dollar value of imports.
“That is the key,” Mr. Bethune said, citing in particular rising exports of aircraft and other capital goods at a moment when capital investment is shrinking in this country.
Given the recent easing of the trade deficit, Mr. Bethune and other economists argue that trade is less likely to pull down the nation’s economic growth rate, as it occasionally did last year. That is an important contribution, given that growth appears to be declining from a 2.5 percent annual rate in the fourth quarter of last year to less than 2 percent in the just-completed first quarter, according to many estimates.
PGL at Angry Bear, as is often the case, beat me to the punch. I’m willing to believe that the trade balance is going to improve, but like PGL — and Brad Setser –, I’m not so sure it will be by way of surging exports that will thereby maintain aggregate demand. Indeed, I much prefer Brusca’s analysis at Haver, which stresses the recent downturn in capital goods exports and imports, even as y/y flows have been growing strongly.
Let’s step back for a minute to assess how much of the increase in flows we should have expected. One aspect of the answer is the extent of change in relative prices. While import goods ex.-oil prices have risen substantially — almost half of the dollar depreciation against a broad basket of currencies, even more substantial has been the export price increase. It’s almost been proportional to the dollar’s decline against a trade-weighted broad basket of currencies.
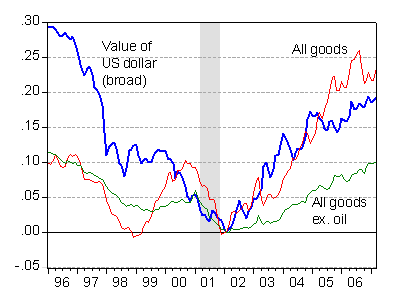
Figure 1: Log nominal dollar exchange rate against a broad basket of currencies (blue), price of goods imports (red) and price of goods imports ex.-oil (green) rescaled to 0 in 2002m02. Source: Federal Reserve Board via FRED II, BLS April 12th import/export price release and author’s calculations.
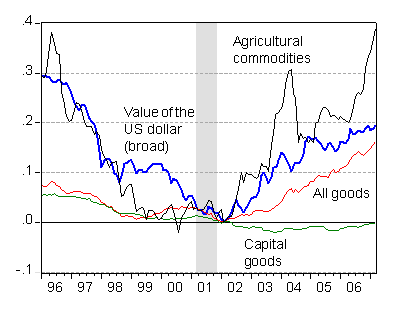
Figure 2: Log nominal dollar exchange rate against a broad basket of currencies (blue), price of goods exports (red), price of capital goods (green), price of agricultural commodities (black), rescaled to 0 in 2002m02. Source: Federal Reserve Board via FRED II, BLS April 12th import/export price release and author’s calculations.
But a closer inspection of Figure 2 indicates that much of the price increase is due to an exogenous increase in agricultural commodity prices. Capital goods prices, remarked upon in the article, actually are close to where they were in 2002. So while there is a surge in prices of certain commodities the United States exports, capital goods prices — an indicator of demand for goods sensitive to cyclical fluctuation — have barely budged. Admittedly, capital goods prices might be depressed by technical progress, driving down prices of computers, peripherals and semiconductors. The price index for exports of capital goods ex. computers (BLS code 2EXCOMM) has risen by 9.2% since 2002m02, but has been essentially flat for the last three months. So, the take-away is that exchange rate pass-through this time around has — finally — been fairly high (at least relative to recent experience [1],[2]). Hence, strong export growth is unsurprising; but indications of future goods export growth are not strong.
What about export quantities? We have NIPA data up to 2006q4. The latest trade release for February is on a different basis than the NIPA data, but they are similar enough that one can extrapolate to 2007q1 on the basis of the trade data. This is depicted in Figure 3, where the 07q1 figures are based on an average of the first two month’s data.
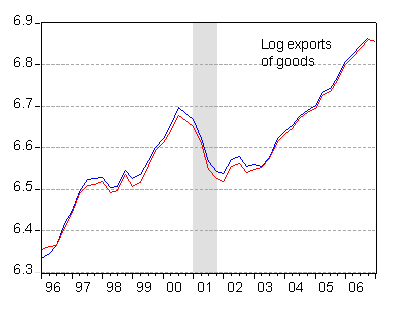
Figure 3: Log exports of goods on a NIPA basis (blue) and exports of goods on balance of payments/Census basis (red), SAAR Ch.00$. Source: BEA NIPA release of March 29th, BEA/Census April 13th trade release and author’s calculations.
Exports of goods in real terms appears to be stabilizing. But, as mentioned before, a better indicator of future demands is capital goods, since purchases of such goods are sensitive to expectations regarding future economic activity (here I’m assuming that export supply is perfectly elastic for simplicity). Inspection of the capital goods exports and imports data in Figure 4 also suggests stagnation of demand for exports. Imports appear to be bouncing back slightly (once again, recalling that the 07q1 figure is the average of only January and February data).
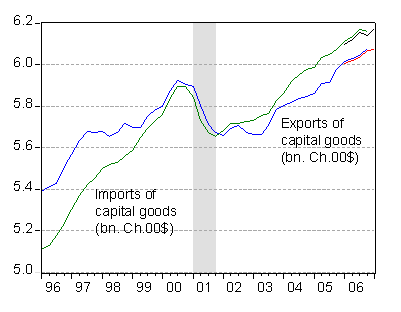
Figure 4: Log exports of capital goods on a NIPA basis (blue) and on a balance of payments/Census basis, (red); and log imports of capital goods on a NIPA basis (green) and on a balance of payments/Census basis (black), SAAR. 07q1 data are based on only two months data. Source: BEA NIPA release of March 29th, BEA/Census April 13th trade release and author’s calculations.
Closer examination of the higher frequency monthly data yields one interesting insight. As shown in Figure 5, capital goods exports declined by 6% (in log terms, non-annualized) in February (the standard deviation of monthly changes over the last year is 2.7%). If this decline is sustained in March, then real capital goods exports in 07q1 will actually decline.
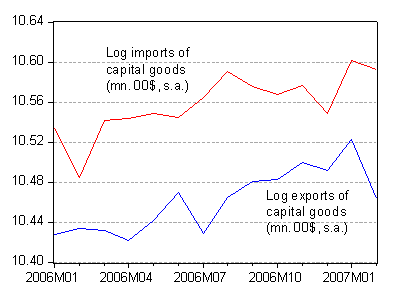
Figure 5: Log of monthly capital goods exports on balance of payments/Census basis, seasonally adjusted (blue) and log of capital goods imports (red). 07q1 data are based on only two months data. Source: BEA/Census April 13th trade release and author’s calculations.
Don’t get me wrong. I still think that overseas demand may save the US from a pronounced slowdown, and help shrink the trade deficit. But I don’t think we’ve yet seen evidence that the bulk of the work is going to be done by US goods exports (services exports have been steadily rising, but the last 3 month change in the nominal services export category has been negative 1.9 percent on an annualized basis).
Technorati Tags: capital goods,
trade deficits,
export prices,
trade deficit
Louis Uichitelle (the author of the NTY piece) should have written his story about five or six months ago — when real and nominal exports were up strongly on every indicator. The story now fits the y/y data, but it doesn’t fit (as you correctly note) the more high frequency data.
The weakness in US capital goods exports is puzzling (the weakness in capital goods imports i understand — it is linked to disappointing business investment). German exports presumably are a decent proxy for global capital goods demand and my sense is — i haven’t looked at the high frequency data — that they are still growing at a nice clip. Chinese machinery exports (not necessarily capital goods) are also doing well, best i can tell (there is a good chart in the IMF’s Asian regional outlook). My guess is that the US is paying a price for its weak position in Russia/ the gulf export markets. Latam oil spending boomed earlier than oil spending elsewhere. But that is just a hunch.
(p.s. very nice work)
Hey Brad Setser, I agree with what you say but just to clarify a point:
U.S. capex has been relatively weak here in America but these same U.S. companies are making relatively high capex abroad. See this article:
http://www.businessweek.com/magazine/content/07_17/b4031048.htm
brad setser: Thanks for the compliment. Yes, I concur that the geographical location of the ongoing boom probably lends more support to German growth than to US (distance still matters!).
Charlie Stromeyer: Interesting observation. Related to Brad Setser’s point, from the perspective of what will support US aggregate demand, what is important is the US-sourced content of the investment in plant and equipment going on overseas. Lots of business fixed investment in plant is sourced domestically (think labor, construction supplies). So even if growth is strong abroad, if they’re not using US capital goods, then we won’t get as much of a boost as would otherwise be the case. But you are right, strong business fixed investment — at least in nominal terms — suggest strong continued global growth.
Dr. Chinn, is the price pattern in figure 2 indicative of a “reverse dependency theory” emerging? There is now a lot of (spare) manufacturing capacity worldwide especially as China increases its capabilities, but natural resources are becoming scarcer. Hence, the terms of trade are moving in favor of–and not against–resource rich countries. Although strong worldwide growth in recent years may have something to do with these improving terms of trade for natural resources, these resources are also becoming scarcer as we hit environmental limits.
Professor Chinn, the main risk I see to strong continued global growth is this paper by the Belgian economist Daniel Gros:
http://shop.ceps.be/BookDetail.php?item_id=1295
This paper implies that the housing bubbles in Europe, the U.K. and Australia will soon start to burst. If so then we should expect a drag on GDP growth in those countries although the drag would probably not be as big as the one we are currently experiencing here in the U.S.
A warning for anyone thinking of shorting stocks that are part of a bubble: wait for the stocks to start breaking down before you short. This point may seem obvious but a few hedge funds lost plenty of money by shorting tech stocks in 1999 which was too early.
I greatly admire the leading-indicator effort offered here, but being less clever myself, I offer the notion that it is all imports and all exports that actually determine the contribution of trade to growth.
From this less sophisticated perspetive, there are also signs of trouble. The trade balance has stabilized because imports, which grew between 10% and 15% y/y through most of 2005 and the first half of 2006, were up just 3.4% y/y in February and had been hovering around 5% y/y growth in the prior 4 months. Meanwhile exports are in better shape, up 9.3% y/y in February.
However, the trajectory of y/y export growth is cooling. It topped out at over 15% in H2 of last year, and has been slowing ever since. If that trajectory continues, then the “trade saves the day” story doesn’t hold together, just as you look at currencies and capital goods suggest. We are seeing early hints of the normal pattern of slower demand growth leading to slower trade growth, rather than the unusual circumstance of the US being led by global growth.
Charlie S:
Thanks for the link to the BW article. I share the author’s feeling that the process of globalization has left most of our data collection in the dust.
Brad DeLong wrote a nice post a year or more ago in which he provided an insider’s view of the debate between international economists and domestic economists. My takeaway was essentially that the domestic economists were living in a fool’s paradise while the international economists were having trouble pinning down just where it was all going to break down.
The fact that all the US-centric measurements are badly obsolete might account for both the conceptual bubble inhabited by the domestic researchers and for the bewilderment of the ‘internationalists’.
Emmanuel: It’s an interesting thesis, and I wouldn’t rule it out. However, I think of the declining terms-of-trade argument associated with Raul Prebisch and ECLA with decade long trends. In my mind, the phenomenon is the outcome of the coincidence of cyclical factors in the Weset, short term supply constraints in energy, and the trend represented by the emergence of China and India as net importers of foodstuffs.
kharris: I agree y/y export growth is slowing (this was my point in this post from February), so as of now, we do have a big question mark. As for the future, this is where Charlie Stromeyer/STS‘s points become relevant. There is question 1: What is the future trajectory for the world economy, given that US firms abroad are undertaking a lot of business fixed investment? Question 2: How much of the demand for equipment will be met by supply produced in the United States? The answer to that second question is critical to the issue of whether US aggregate demand is sustained by demand for capital goods exports (of course, if RoW growth is high, aggregate demand might be sustained by exports of agricultural goods and minerals, or services).
Regarding whether we need a new statistical system, for certain we need better and more statistical gathering. For purposes of determining how much business fixed investment takes place within the Nation’s borders (critical to tabulating the national income and product accounts), we do have the apparatus in place. But for tracking the intra-firm transactions of multinationals (important for understanding what these increasingly globalized firms are doing), we have only a limited system in place.