There’s been a cornucopia of forex market information released in the past week, which I’m only now getting to. First, the BIS has released the preliminary results from its Triennial Central Bank Survey of Foreign Exchange and Derivatives Market Activity, conducted in April of this year. The results are interesting, insofar as they confirm trends evident in the previous survey in 2004. Second, the IMF released its most recent tabulation of foreign exchange reserve holdings (COFER).
The trends in forex transactions are depicted in Figure 1, drawn from Table 1 of the statistical tables of the BIS report.
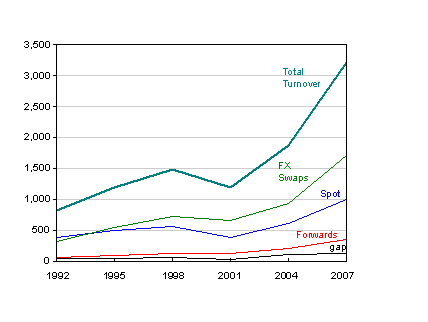
Figure 1: Turnover statistics, in trillions of dollars per day, in April. Source: Table 1, BIS Triennial Central Bank
Survey of Foreign Exchange and Derivatives Market Activity in April 2007
The report is well worth reading; here are some of the points I found of interest.
First, overall foreign exchange turnover is incredibly large, at 3.2 trillion dollars per day.
Second, foreign exchange swaps continue to account for the majority of transactions. Interestingly, though, the growth rate of forex swaps accelerated, outpacing other types of transactions.
Third, focusing on overall and spot transactions, in log terms, one observes from Figure 2 that the growth rate of volume has been maintained from the 2001-2004 period in the 2004-2007 period, averaging 17.8% per annum (in log terms).
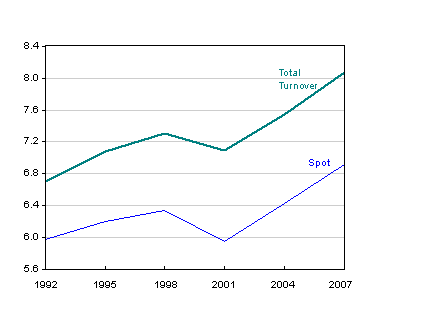
Figure 2: Turnover statistics, in log trillions of dollars per day, in April. Source: Table 1, BIS Triennial Central Bank
Survey of Foreign Exchange and Derivatives Market Activity in April 2007
Fourth, the dollar’s share continued its decline. But so too did the euro, although by much less. The USD share has declined from 90.3% in 2001 to 86.3% (out of 200% total, since there are two currencies involved in each transaction counted), while the EUR share declined from 37.6% to 37.0%. These developments are illustrated in Figure 3.
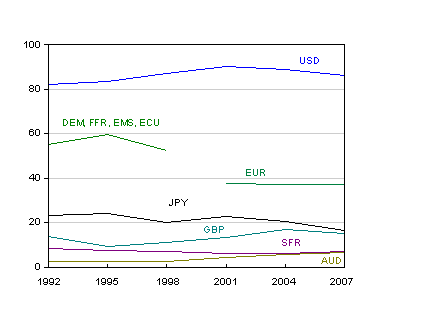
Figure 3: Currency distribution of forex market turnover, in percent of transactions (summing to 200%), in April. Source: Table 3, BIS Triennial Central Bank
Survey of Foreign Exchange and Derivatives Market Activity in April 2007
Since the dollar and euro declined, what rose? Not the yen. Its share declined from 22.7 to 16.5.
Among the substantial movements is the AUD, which rose by 2.5 percentage points, from 4.2% to 6.7%.
Despite all the attention directed to the China and India, there shares are small — 0.7% and 0.5%, respectively. But, it must be noted, they have gone from essentially zero to registering on the tablations.
The reserve bank holding numbers released by the IMF on the 28th are also of interest, although it is not clear any big trends were reversed. One interesting point is that the dollar continues its downward trend — in part due to the decline in the dollar’s value (see this post), and in part due to the continued accumulation of reserves by central banks that do not report the currency composition of their holdings.
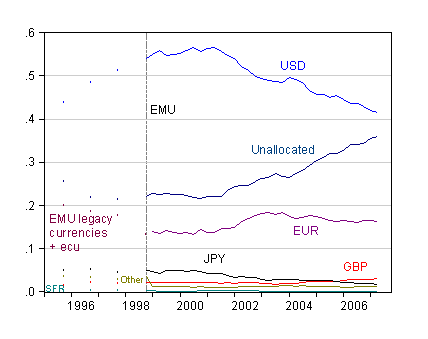
Figure 4: Currency distribution of central bank foreign exchange holdings, in percent of total reserves. Source: COFER (September 28, 2007), and author’s calculations.
Guessing that 2/3 of unallocated reserves are in USD, and the remaining 1/3 in euro yields the following:
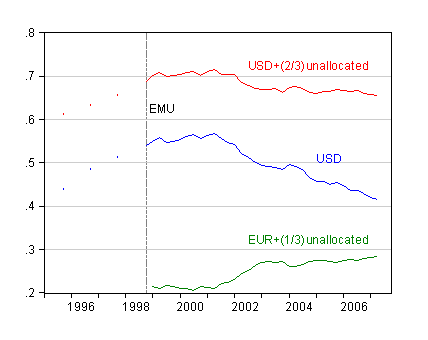
Figure 5: Estimated USD and EUR share of central bank foreign exchange holdings, in percent of total reserves. Source: COFER (September 28, 2007), and author’s calculations.
The relative constancy of implied USD and EUR shares in reserve holdings (which one might expect to follow at least somewhat currency transactions) should not be too surprising in light of the previous discussion. However, given the weakness in the dollar in the first half of 2007 (a decline of 5% of the trade-weighted narrow index), the relative constancy is a bit remarkable. On the other hand, the relative constancy would disappear if the currency composition of reserves is changing (see Brad Setser’s earlier discussion of Q1 COFER data here).
Technorati Tags: dollar,
reserve accumulation, euro, currency trading
Isn’t it surprising that the fraction of transactions in yen should decline so greatly, given the generally held belief that the carry trade is very large? Brad Setser cited Tim Lee of Pi Economics suggesting it may be in the trillion dollar range.
The current $3T/day volume in fx trade ( Fig 1 ) I suppose is dollar equilibrated over this period somehow (small worry) possibly showing a trend since 2001 (medium size worry) and would a GDP-normalized representation show the same escalation? (my worry)
Given that fx in theory is the mechanism that transmits the efficiency of the free markets (bananas grown in the tropics, softwood lumber somewhere warmer), is this growing ratio fx/GDP, evidence that it’s a failing instrument? (the non-trader’s worry).
Chalk another one down for the carry trade.