A lot of what has happened to GDP growth over the past few quarters has, in a mechanical sense, depended upon developments in the external accounts. In this post, I examine whether mismeasurement of import prices might have induced mismeasurement of economic output. This idea was prompted by hearing a presentation of Nakamura and Steinsson a couple months ago. The abstract to “Lost in Transit: Product Replacement Bias and Pricing to Market”:
Product replacement is frequent in the micro-data that underlie U.S. import and export price indices. Also, prices change infrequently in these data. In constructing price indices, price adjustments that occur at the time of product replacements tend to be dropped. If price adjustments disproportionately occur at the time of product replacements then price adjustments are disproportionately unobserved. We show that this “product replacement bias” has distorted the measured long-run relationship between import and export prices and the exchange rate by a factor of between 1.7 and 2.1. Accounting for this bias, we find that the price of U.S. imports (relative to domestic consumption) responds by roughly 0.7% for each 1% change in the U.S. real exchange rate, while the price of U.S. exports (relative to foreign consumption) responds by roughly 0.8%. This contrasts with conventional pass-through estimates of 0.2-0.4% for import prices and 0.9% for export prices. Thus, the degree of pricing to market for U.S. imports and
exports is more symmetric and the degree of pricing to market for U.S. imports more moderate than conventional measures suggest. Adjusting for product replacement bias also substantially raises the volatility of the terms of trade. These results improve the fit of the data to standard models.
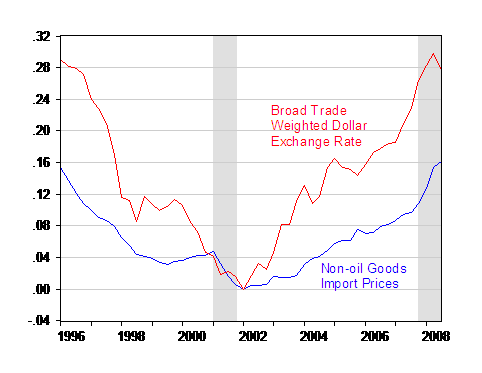
For a visual display of the relationship between the exchange rate pass-through and the official BEA price deflator for non-oil goods imports, see Figure 1.

Figure 1: Log price of goods imports ex-oil (blue), and log broad trade weighted exchange rate of the dollar (red), both normalized to 2002Q1=0. NBER defined recession dates shaded gray. Source: BEA GDP release of 25 November 2008, Federal Reserve Board via St. Louis Fed FRED II, and author’s calculations.
(Previous posts on exchange rate pass through: [1], [2], [3], [4], [5], [6], [7].)
The point of the Nakamura and Steinsson paper is that import price changes (both up and down) are understated by the deflator due to the way in which BLS accounts for new products in the export/import price indices.
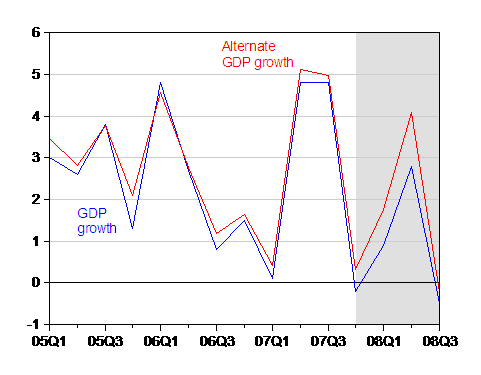
If import prices were actually higher than reported by the usual statistics, then the volume (or “real” quantity) of imports would be lower than reported. Given that measured import prices have been rising, this means the decrease in imports has been more pronounced than indicated in the BEA statistics. Taking this chain to its logical conclusion, actual GDP growth is larger than has been reported — but not for a “good” reason, but rather because imports have been collapsing even more than we already think. This is shown in Figure 2.

Figure 2: Real quarter-on-quarter GDP growth SAAR (blue) and adjusted GDP growth (red). NBER defined recession dates shaded gray. Source: BEA GDP release of 25 November 2008, Federal Reserve Board via St. Louis Fed FRED II, NBER, and author’s calculations.
Here, I’ve assumed actual prices rise twice as fast reported prices, and measured prices in 2000 reflect actual prices in that year. In addition, I’ve only applied this adjustment to non-oil goods imports. Probably, all commodities should be excluded, since the logic laid out by Nakamura and Steinsson applies really to differentiated, manufactured goods. (I don’t adjust export prices since the Nakamura-Steinsson results suggest minimal bias in export prices.)
Notice while this alternative measure indicates no negative output growth in 07Q4, and growth of 4% SAAR in 08Q2, it also shows an even more precipitous decline in 08Q3 than in the standard series. More specifically, output declines 4.3 ppts, instead of 3.3 ppts, going from 08Q2 to 08Q3.
By the way, this is a “partial” exercise, in the sense that, while mismeasurement of imports tends to drive up recent growth rates, other mismeasurement may well work the other way (e.g., Michael Mandel).
Technorati Tags: imports, pass through, import pries,
recession, and product replacement bias.
I take your point that mismeasurement of prices can influence quantity reported since the quantity is reported in Dollars.
Since these two variables are inversely correlated, I assume you have reversed the scale on your index of the value of the dollar, making the second quarter of 2002 the high point for the value of the dollar.
Do you expect BEA to incorporate this change into their measurement methodology? Second point – more continuity between quarters could be shown by using change from previous quarter rather than change from previous year. Is yearly changes conventional?
Would the same results appear if the data were
unadjusted data, could you say that the results obtained with the analysis presented would hold up if the data were as raw as possible?
ReformerRay: Yes, the exchange rate variable is defined in the standard way (which is why I did not label the red line in Figure 1 as the value of the dollar).
I would not expect BLS to modify its approach because (i) the NS results regarding mismeasurement are preliminary, and more importantly (ii) it is not clear what would be a better approach, given data and funding limitations. Using the unadjusted/raw data, or year-on-year changes, would not mitigate the difficulties that NS highlight.