I’ve been thinking about trying to convey exactly how startling the drop in U.S. imports has been. First, take a look how much non-oil goods imports (in real terms) have dropped, relative to, for instance, GDP.
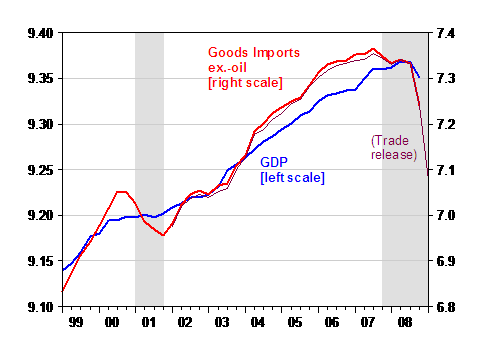
Figure 1: Log GDP (blue, left scale), log goods import ex.-oil from NIPA (red, right scale), estimated from trade release (purple, right scale), all in Ch.2000$, SAAR. 2009q1 estimate is based on actual January and February data and March estimate incorporating continued 5% decline from February. NBER recession dates shaded gray. Source: BEA, GDP final release of 26 March 2009, February trade release, NBER, and author’s calculations.
The annualized drop in these imports was 36.5% in 2008Q4 (log terms). In addition, with non-oil imports dropping about 5% (non-annualized, in logs) in the first two months of 2009, 2009Q1 imports seem set continue the drop. In Figure 1, I’ve assumed that the drop witnessed in January and February continues into March.
These declines are so large that they are difficult to reconcile with standard models. To formalize this assertion, consider the predictions of a standard imperfect substitutes model used in traditional (i.e., old fashioned) macroeconometric models (see [1]. The model is given by:
Imp = α 0 + α 1 y + α 2 r
Where Imp is real imports, y is real income, and r is the real value of the dollar.
I estimate an error correction version of this model, wherein there is a long run relation between the levels of imports, income and the real dollar.
Δ imp t = β 0 + φ imp t-1 + β 1 y t-1 + β 2 r t-1 + γ 1 Δ imp t-1 + γ 2 Δ y t-1 + γ 3 Δ r t-1 + u t
In this specification, the long run elasticities are given by the ratio β i/ φ . When this model is estimated over the 1974q1-2008q4 period, one obtains sensible estimates (in that higher income or a stronger dollar induces greater imports in the long run).
One way of evaluating whether the 2008q4 observation is anomalous, in a statistically significant sense, is to examine the recursive residuals. A recursive residual is the time t prediction error based upon the regression estimated up to time period t-1, but using time t values of the X variables. Figure 2 depicts the 95% standard error band; an observation outside that band suggestive structural instability in the regression equation.
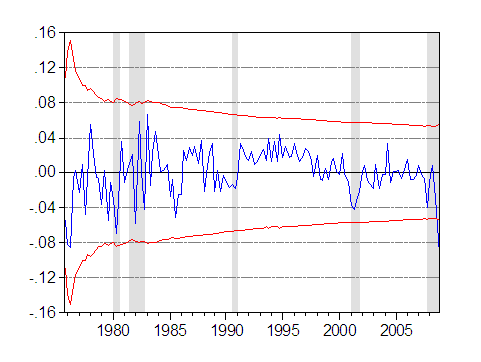
Figure 2: Recursive residuals from standard model error correction specification, 1974q1-2008q4. +/- two standard error band (red dashes). NBER defined recession dates shaded gray. Source: see text.
I thought that modeling imports with durable consumption as a trend variable would make this “instability” disappear. While it did mitigate the prediction error, a statistically significant overprediction remains.
Another possible covariate is (log real) household net worth; adding this into the model, both with long and short run effects allowed does improve the fit (3 lags of the first difference of net worth).
Δ imp t = β 0 + φ imp t-1 + β 1 y t-1 + β 2 r t-1 + β 3 hh t-1 + γ 1 Δ imp t-1 + γ 2 Δ y t-1 + γ 3 Δ r t-1 + γ 4 Δ hh t-1 + γ 5 Δ hh t-2 + γ 6 Δ hh t-3 + u t
Where hh is log real household net worth, obtained from the Federal Reserve Board’s Flow of Funds statistics. The adjusted-R 2 is 0.4 versus the 0.3 in the standard formulation. Figure 3 depicts the recursive residuals for the augmented model.
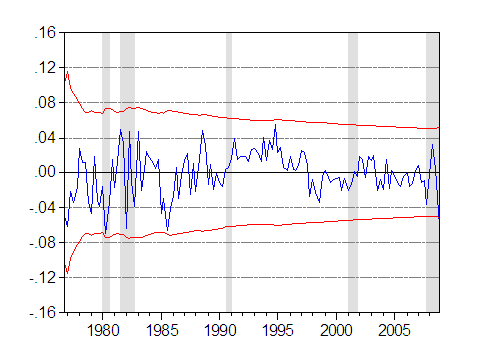
Figure 3: Recursive residuals from model with household net wealth error correction specification, 1974q1-2008q4. +/- two standard error band (red dashes). NBER defined recession dates shaded gray. Source: see text.
This model does not exhibit the instability apparent in the standard model. This suggests that household net worth is important to imports, which certainly makes sense if one thinks that the reason that non-oil goods imports are declining (recalling that non all imports are used for consumption). Of course, there are other explanations that are consistent with this effect. For instance, there could be a common shock affecting both household net worth, and trade financing. This latter interpretation could work on both LDC exports, and also LDC imports [2] — given that some US imports are used to produce US exports (i.e., vertical specialization, as described in this post).
What do these models predict for 2009q1? Figure 4 depicts the results.
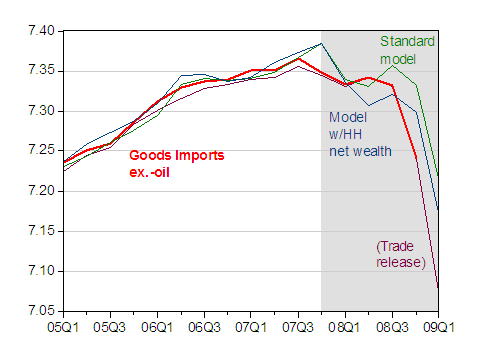
Figure 4: Log goods import ex.-oil from NIPA (red), estimated from trade release (purple), all in Ch.2000$, SAAR. 2009q1 estimate is based on actual January and February data and March estimate incorporating continued 5% decline from February. “Standard model” is the static fit from basic regression; “Model w/HH net wealth” incorporates household net wealth. NBER recession dates shaded gray. Source: BEA, GDP final release of 26 March 2009, February trade release, Federal Reserve Flow of Funds, NBER, and author’s calculations.
The standard model badly mispredicts 2008q4, while the augmented model does slightly better (6% error vs. 9% error). Both models predict the downturn in 2009q1; which model proves more accurate depends upon what the March numbers will be. (That being said, these are all fitted models, and not dynamic forecasts).
[Update 4:30pm Pacific] Dave Backus reminds me that imports, and to a lesser extent exports, are highly procyclical, exhibiting higher variation (on a percentage basis) than GDP. This observation is illustrated by Figure 5:
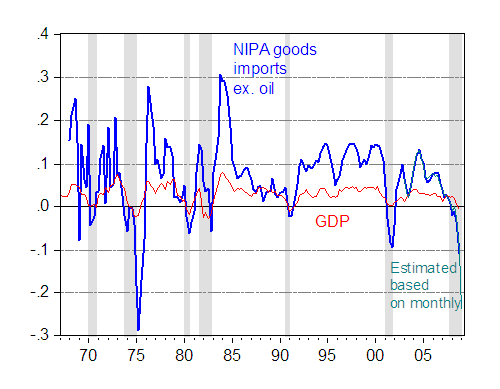
Figure 5: Year-on-year growth rates in goods import ex.-oil from NIPA (blue), goods imports ex.-oil estimated from trade release (teal), and GDP (red), all in Ch.2000$, SAAR. 2009q1 estimate is based on actual January and February data and March estimate incorporating continued 5% decline from February. NBER recession dates shaded gray. Source: BEA, GDP final release of 26 March 2009, February trade release, NBER, and author’s calculations.
Figure 5 also highlights that, while the current drop through 2008q4 is not unprecedented, when the March figures come out, the drop will only be exceeded by the mid-1970’s drop.
“For instance, there could be a common shock affecting both household net worth, and trade financing.”
How about negative real earnings growth (using a middle class person’s budget) for most people and too much debt leading to a sharp and sudden fall in real spending via debt deflation?
I wonder how much the declines in auto sales and home construction is affecting imports.
Startling – but please start your graphs at zero.
Menzie,
What is the net effect of this on GDP?
Startling…not to mention the “kindness of strangers”, the financing aspect that used to be attached to these items in lieu of tradable goods. China still buying tbills, but the kindness does not extend to US agency debt and how long before the kindness dries up on tbills?
Same picture for the smaller section, Services?…to get a bead on how protectionism is incubating?
Good thing the recession is over in a couple of months, I can only take so much excitement.
Isn’t some of the drop in trade explained by a problem with trade finance? If so, then this seems another manifestation of the credit crunch. Since we haven’t had a credit crunch of this magnitude in the post-WWII period, we are out of sample, and so are liable to see historically odd results. Lack of credit is a powerful brake on activity.
This proves again the faith of R. Reagan – somewhere there is a little poney buried in all this s…..
Decreased imports is one of the good things generated by this economic collapse. Increase in personal savings is another. Reduction in growth of consumer credit is a third.
All these events do not support economic growth in the present, but I am interested in economic growth in the future. If the U.S. can continue to reduce imports and consumer credit and increase savings, there may be some hope for this economy some day.
Perhaps the popping of the US import bubble has two significant geopolitical benefits :
1) Oil prices have a pretty tough ceiling over them for the medium-term. Any rise in oil prices would have to increase US import dollars, which is unlikely.
2) China’s GDP growth slows, which further keeps oil down, and may cause unrest within China, leading to some modest political reforms.
There were just too many unsavory activities in the world that were directly or indirectly funded by the US appetite for imports. At least those activities may be forced to cease.
Question about Yield Curve :
The yield curve has a solid 3% slope to it now. Does this not point to economic recovery?
Sure, the lower bound is zero, but still.
RR,
I take a more catholic view of growth. Now and in the future would satisfy me just fine, and I have a hard time being disinterested in current growth, knowing what I do about discounting of future this and that.
Add inventories to your equation.
I’ve always modeled imports as a function of lagged income, lagged relative prices and current quarter inventory change.
If you make imports partially a function of inventories you can clearly see how we are exporting a significant portion of the US recession.
It is also why the idea that the rest of the world would not be hurt by a US recession never stood a chance.
Home equity extraction used to fund purchase of foreign goods.
Drop GDP as a reference and use the case schiller plus net household equity.
Peak in goods imports ex looks like mid-07. Very important.
S: “If you make imports partially a function of inventories you can clearly see how we are exporting a significant portion of the US recession.”
I would prefer to look at it as a reduction in U.S. support for foreign aggregate demand. And about time that the ROW learned to do without it, as it was unsustainable. In fact, it is unsustainable even at its current level. The only problem that is left is that BB’s policies may make Europe take the brunt, but they are not big enough to hold us up, especially as (unless currency interventions cease) it means holding up China and much of the rest of Asia as well.
kharris: Yes, I agree with you, and think trade financing explains a big, but unknown, share, as I allude to in the third to last paragraph in the post. The trade finance issue is the subject of this post from January.
Figure 5 shows year-on-year growth rates for 1875 at an extreme low and 1976 at an extreme high. Would not a low extreme for 1975 make likely a high extreme for 1976 (year on year calculations)?
I have no idea why 1975 was so low. Oil taking all the cash from consumers?
“GK said: Question about Yield Curve :
The yield curve has a solid 3% slope to it now. Does this not point to economic recovery?
Sure, the lower bound is zero, but still.”
IMO, the yield curve does nothing more than “encourage” borrowing short-term and lending long-term. In other words, it is just another attempt to create more debt.
If I’m remembering correctly, CalculatedRisk has talked about residential investment and/or retail sales leading an economic recovery (usually).
I would like to see a chart of the yield curve, nominal interest rates, residential investment, and economic recoveries for the last say 60 years.
DickF wrote:
What is the net effect of this on GDP?
My earlier question was somewhat rhetorical. In fact a decrease in imports relative to exports will increase GDP even if total trade is declining. Once again we see that statistical measure to “run” the economy fail. All of us should know that a decline in total trade would indicate a decline in GDP, well those of us with common sense.
Interesting discussion – this brings to mind the idea articulated by Richard Cooper in November 2005 (“Living With Global Imbalances: A Contrarian View,” Institute For International Economics, Policy Brief PB05-3) – that the current account deficit of the United States is not the product of unsoundly low savings or the strength of the dollar, but the fact that the US has historically been a safer investment than emerging markets while yielding higher returns than Europe and Japan, making it an attractive repository for the world’s savings.
That theory was appealing as the financial crisis grew to global proportions and the US economy, despite having initiated the breakdown, remained a sound bet relative to other markets. But a cooling of both American imports and exports will be an interesting test of this view, as the world recovers and “prudence” becomes a more popular word on Wall Street.
How will the US current account look in future years? Will the return of global financial activity bring a return of the deficit, or will a new American paradigm drive a more balanced picture? Is future devaluation of the dollar likely? The global recession provides an interesting window through which to view financial and trade structures.
A major reason trade is so cyclical as Backus pointed out is inventories.
If a retailer has exceed stock they will cut back on oders from both domestic and foreign suppliers.
I am not convinced that a drop in US import demand is necessarily a bad thing. The US domestic demand has been incredibly strong over the past 15 years, during which time US savings have been deficient and US investment has been quite high. Perhaps the reduction in domestic demand signals that Americans are saving more since the onset of the recession. Considering that Asia and Western Europe are much more diligent savers than Americans, I would hope that American savings rates can begin to catch up with other countries savings rates, so perhaps the the drop in US demand for imports signals the ushering in an era of higher saving. Overall, a drop in imports signals an improvement in the current account imbalance. Because the United States government is running up such an enormous budget deficit with the stimulus plan, I like to think that at least the current account imbalance caused by too few exports relative to imports could shrink in the future.
In response to kharris’ comment that “Decreased imports is one of the good things generated by this economic collapse”: The U.S. might truly have a real incentive in decreasing its current account deficit, which peaked at 6.5% of GDP (or $825 billion on an annual rate) in the fourth quarter of 2005, according to the Federal Reserve Bank of Cleveland. Nevertheless, having a recession is not a strategy of going about it. A useful analogy is to think of an overweight person trying to lose weight by throwing up. He or she might need lose weight, but throwing up is simply not healthy. Getting back to the economy, the question is, once the U.S. economy picks up, where will we go back to? Will demand for imports increase once again, and will there be an incentive against this? The analysis provided above is very useful into looking backward, but it does not say where things will go once the economy picks up.
It is also important to remember the other side of the argument concerning current-account deficits. In a compelling paper entitled “Living with Global Imbalances: A Contrarian View,” author Richard Cooper argues that the U.S. could continue to run large current account deficits “as long as the American economy is producing attractive financial assets.” He also makes the case that Americans save a third of GDP, if the numbers are properly measured. Whether or not current-accounts mean a long-run apocalypse, it is not useful to think of a recession-induced narrowing of the current-account deficit as a “good thing.”
“In fact a decrease in imports relative to exports will increase GDP even if total trade is declining.”
Well…wouldn’t that import – a negative in the calculation of net exports – also feature as a positive addition to GDP as consumption or investment? So isn’t an increase or decrease in imports – although perhaps indicative of economic vitality in general – ultimately a wash in the calculation of GDP?
So, if lack of trade finance plays a major role, then the implication would be a shortage of imported goods once inventories are pared down. And would artificial scarcity fuel inflation?