Yin-Wong Cheung, Eiji Fujii and I have just written a chapter for a VoxEU book The US-Sino Currency Dispute edited by Simon Evenett (link to blog post). After discussing the various approaches to measuring misalignment, we summarize the most recent estimates of CNY undervaluation.
To recap, currency misalignment can be determined on the basis of the following criteria or models:
- Relative purchasing power parity (PPP)
- Absolute purchasing power parity
- The “Penn Effect”
- The behavioral equilibrium exchange rate (BEER) approach
- The macroeconomic balance effect
- The basic flows approach
- An equilibrium approach
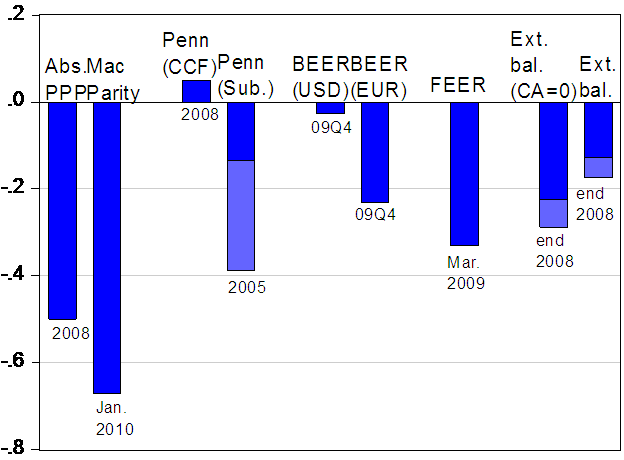
In our chapter, we report the most recent estimates in each of these categories (save the “equilibrium approach” which is difficult to implement), and summarize them in this chart:

Figure 1: Estimates of Chinese yuan misalignment, in log terms. Absolute PPP, from Cheung, Chinn and Fujii (2010); Mac Parity, from Economist (2010); Penn effect estimate from Cheung, Chinn and Fujii (2010); Penn effect from Subramanian (2010); Behavioral Equilibrium Exchange Rate (GSDEER) from Goldman Sachs (2010); Fundamental Equilibrium Exchange Rate (FEER) from Cline and Williamson (2010); Basic balance from Goldstein and Lardy (2009), and author’s calculations.
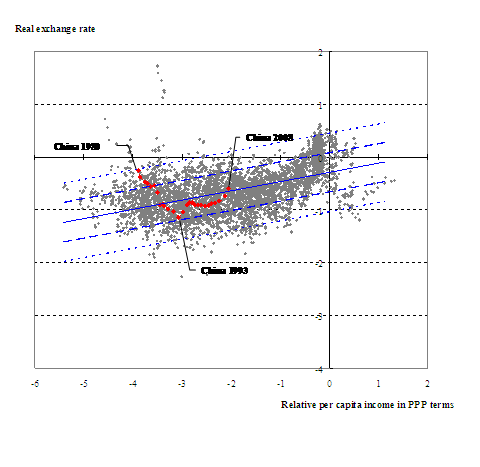
In this paper, we also update our estimates of the degree of CNY misalignment, based upon the “Penn effect”. This approach has been discussed various times on the weblog: [1] [2] [3]. Our most recent estimate, based on data extending up to 2008, indicates a slight overvaluation (although the standard errors are sufficiently large that we could not reject the null hypothesis of a substantial undervaluation, at conventional signficance levels).

Figure 2: Price level-per capita income in PPP terms relationship (blue line), +/- 1 std error band (long dashed lines), +/- 2 std error band (short dashed lines); OLS estimates for 1980-2008 period. Source: authors’ calculations.
The book covers numerous topics, from misalignment to trade to macro interactions; anybody who is interested in the topic should definitely take a look.
I note that the average annual wage in China is about $3,500. If their currency is not undervalued, what accounts for the wage difference? The usual explanation is that low wage countries are “poor”, meaning that their citizens don’t carry an overhead that citizens of rich nations carry. But if I went without that overhead —no health insurance, pension, automobile, entertainment, meat, etc.— could I live on $10 a day in America? If not, China’s currency is undervalued.
Goldman is one Obama’s top contributors.
Top Obama contributors
Goldman $994,795
Citigroup Inc $701,290
JPMorgan Chase & Co $695,132
UBS AG $543,219
Morgan Stanley $514,880
There will never be any meaningful reform as long as there is a government / banking alumni relationship. The Treasury, Federal Reserve, and the SEC are staffed with elite bankers groomed by the biggest investment banks. Economic policy of Obama is no different from Bush.
[edited by JDH to improve civility]
The definition over the time of a currency purchasing power looks more circonstantial. As for example the Federal Reserve Act as of 1913 stipulated that Federal Reserves Banks should hold :
35% in gold reserve or first grade commercial paper to cover the deposits they held in trust.
45% gold reserve to back up the Federal reserves Banks notes issued.
These definitions had the advantage of taking care of the liquidity (resources diversification) and to provide somehow an asset quality benchmark which would be approximative in 1932 as the CP quality would deteriorate.
In summary there was a cap on the FDR notes potential issuance and the likelihood of a Net Assets Value to back up FDR notes.
We may only retain from above the two precautionary measures liquidity and NAV,where as of today I am wondering if the PPP is integrating any assets value as a currency backup?
The hereunder tables are for the least astounding when thinking of setting a currency NAV (BIS statistics)
http://www.bis.org/publ/qtrpdf/r_qa1003.pdf#page=7
External positions of all banks vis a vis all sectors as of september 2009 {billions usd}
France 2634.8
Germany 3202.2
UK 5544.8
External position of banks in foreign currencies vis a vis all sectors
in foreign currencies (billions usd}
France 768
Germany 882
UK 4961.4
External position of banks in FC vis a vis the non bank sector (in billions usd)
In individual reporting countries
France 281.3
Germany 410.6
UK 2149.3
Worth to be seen as well P16 P21 P64
Re : Posted by: Johannes at April 17, 2010 01:31 AM
Thanks, JDH. May I apologize.
goodrich4bk,
1/3 of Chinese work force still primarily engage in farming, 1% of Americans do. The two countries have comparable geographical areas so let’s assume land available for farming is about the same. Let’s also assume that the land productivity (potentially at least) is about the same, that means per capita farm productivity of Chinese farmer is about 1/30 of the US — so is income (at least magnitude wise). Now in the manufacturing sector even if a Chinese worker can achieve 1/10 of that of an American one, it would still be profitable to move him off the land into manufacturing at the expense of the American.
Note this calculation is independent of currency. Only structural change (sufficient Asian urbanization) will eventually change the parity.
(the figure 1 links to CCF2010 are broken)
Hi, is the raw data behind PPP computations, that is prices of individual goods and services, available somewhere?
Laurent GUERBY: Thanks, link is fixed. The aggregate data for our Penn effects calculations are available from the World Bank’s World Development Indicators, available with subscription. I do not know where one could get the raw data underpinning the PPP data, except perhaps from the ICP or the Penn World Tables internal database.
Interesting chart.
But can you take a little more time to explain the interpretation of the vertical axis. For example, suppose I conclude that an average “currency mislignment” for the yuan is -0.4, based on your chart. If you are using a log axis, this would imply a real factor of 0.4, since log[0.4] = -0.4. So therefore, are you saying that the yuan should appreciate in value by 40% in order to reach economic parity? Or are you saying that the USD/yuan currency pair should drop to 0.4, in order to reach parity?
If possible, please clarify.
PeteCA: Given the definition of the variables, the approaches generally would say either currency moving would resolve the misalignment.