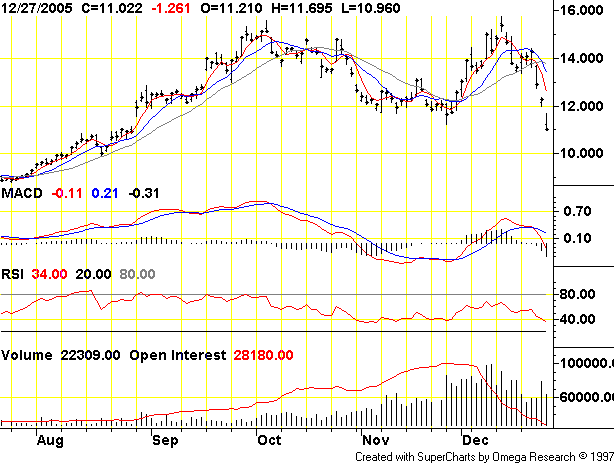
Whee, it sure is fun being a natural gas trader, don’t you think?
 |
Bloomberg yesterday reported:
Natural gas futures plunged 10 percent, the largest one-day drop in almost three years, as warmer-than-normal weather slashed demand for the furnace fuel….U.S. heating demand will run 30 percent below normal for the next week and 22 percent below normal from Jan. 2 to Jan. 6, according to Weather Derivatives, a Belton, Missouri-based forecaster…. Prices are down 30 percent from a record $15.78 per million Btu on Dec. 13 and are the lowest since Sept. 13.
Yes, the weather’s been nice in New York, but a 30% price drop? Another relevant fundamental here is the price of oil. Many firms have the ability to switch between oil and natural gas depending on price and availability. Longer term, consumers or firms making a fixed commitment to oil or natural gas will of course look at the relative prices. Furthermore, it’s possible to produce a synthetic liquid from natural gas that makes an excellent jet or diesel fuel.
 |
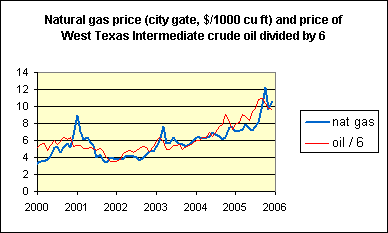
A barrel of oil has about six times the energy content of a thousand cubic feet of natural gas. The graph at the right compares the price of natural gas with that of crude oil using a price comparison factor of 6:1. Between December 2003 and July 2005, oil prices shot up about 50% (logarithmically) whereas natural gas was only up 25%, leaving gas undervalued relative to oil. Between July and October, natural gas was up 50% logarithmically with oil little changed, leaving gas relatively overvalued. At least part of the recent drop in natural gas prices may be a correction to that.
If you speculate in commodity prices, don’t forget the long-term fundamentals. Or your Tylenol.
Technorati Tags: natural gas prices,
natural gas, oil prices
I think that the correlation you note is interesting but ultimately will not mean much. Oil and gas are fundamentally different in the journey they make from ground to useful work. Oil is truly a world commodity, dense and easily transported, whereas gas is going to end up being a huge regional problem since almost all of it travels through big pipes (liquefied gas is still a tiny percentage of gas deliveries).
But what is really going to cause the commodity markets to go crazy is when the truth about natural gas depletion rates finally sinks in. We aren’t talking about the gentle 3% depletion of old tech oil fields or even the 8%-10% of the new bottle-brush-CO2-injected oil fields…we are going to witness 15%-30% depletion year-over-year from these supergiant gas fields…think i’m nuts? read up on north sea gas…IT’S ALREADY HAPPENING!
sampo-
I think you’re referring to production declines.
depletion will never be known until someone goes down into the reservoir to calculate how much gas was down there before production began.
How much natural gas is actually traded at the spot price vs. the amount of natural gas that is exchanged under long-term contracts between buyers and sellers? I’ve always wondered the same thing about oil prices and other commodities. Am I mising something or could the spot price represent a real small part of the volume of gas or oil that is actually consumed?
I’m not sure about the ratio of spot to contracted gas and oil, but the prices which are quoted are generally contract prices and not spot prices. Spot prices are much harder to find. I guess this is because many speculators buy contracts with the intention of selling and not taking delivery, while the spot market would only be used for people in the industry. Hence contract prices are of more general interest and they are the ones reported. JDH’s graphs above are for contract prices (next month’s delivery contracts).
Penny stock trading must also be interesting.
Did you see the move this week in the stock price of United Airlines? (see graph at http://simurl.com/mamfiv ).
Do any of you know what might explain such a move?
I think of the contract price as that between the company and a customer. The price quoted daily is the NYMEX spot or futures. How is data collected for longer term contracts? There are E&P companies with contracts for $11-$14 now. Some companies hedge and other trust the future.
YES, the SPOT price of UAL is very interesting…
Contract prices tend to have spot price clauses in them ie many long term supply contracts are at the current ‘spot’ price.
The prices of all forms of energy are interlinked, although there are lags.
Example. My father built fossil-fueled (coal and oil) and nuclear plants in the 70s and 80s– in the long run, the price per kwh of those plants converged on the price of a plant using oil. The breakdown between fixed and variable cost is different, but the long run price of electric power production converges.
There was a period in the 90s when gas prices were anomalously low: new gas reserves were discovered in Western Canada, and once the pipelines were built, the producers had to ship to cover their fixed costs.
In addition, the technology of gas fired plants took a step upwards: the rise of GE 9F turbine Combined Cycle Gas Turbines– energy conversion efficiencies jumped from the low 40s to the mid 50 percents (I think the latest GEs are about 55%). These can also be built much more cheaply than other fossil fuel plants: most of the cost of construction is capitalised interest, and a CCGT can be largely built ‘in factory’ and shipped to a pre-prepared site, so it can be built far faster. There was also a big step change down in operating costs: a CCGT can run with a 15 man shift, whereas even a highly mechanised coal plant of a similar meggawatage needs at least a couple of hundred men.
All of the above led to a one-off downward shift in the price of producing electric power *while* the gas price stayed low. But we are close to the limits of that approach (Cornot’s Law governs the maximum theoretical efficiency of a power plant, which is in the low 60s, from memory). And of course gas is no longer cheap.
That era of cheap gas fired power is now largely over. I would expect the prices of all forms of energy to converge on the price of oil. The reality is there is substitution between all forms of energy– even if oil looks unique (because of its role in transport), the data says it is not.
John’s points about convergence is well-taken. For example, the price of retail natural gas will converge, eventually, with the price of electricity which is a good substitute in many areas of the US where electric heat pumps can be competitive for residential heating.
Professor Hamilton’s point about fuel switching is more controversial. Many market analysts think that most fuel switching opportunities have been foreclosed – pollution rules now preclude most switches. Here in California, that is certainly the case – power plants that once had oil tanks on-site have removed them – Moss Landing, Morro Bay, Humboldt Bay. Also, industrial demand finds that competitive product quality issues now require the cleaner burning gas.
A stronger influence is demand destruction. Rather than swtich fuels, industrial processes will close down during high gas price periods. Glass-making, petrochemicals, etc will shut down and import the product from areas with lower energy commodity prices or less restrictive pollution control regimes.
As to contract vs spot prices. aren’t contracts required to be convertable into physical delivery at end-of-life? In addition, gas producers are reluctant to enter into long-term (> 3 year) supply commitments because a typical well is deep into its depletion within a year. A long term contract than is a bet on the productivity of UNDRILLED wells.
When the blue norther comes in a week and stays for about two months, this whole conversation string will go in the exact opposite direction.
Gentlemen, I am attempting to find out the following: What is the average price Alberta Tar Sands producers pay for natural gas on long term contracts for use in SAGD (steam assisted gravity drainage) steam generation. We know the total consumption for all producers is about 600,000 mcf per day, but do not know the average long term cost per mcf of gas. We surmise it is about $5-6.
The second part of the question is, if alternative steam generation facilities are installed, what would the opportunity be to resell that same gas, now being burned to make steam, and what profit could these SAGD bitumen producers realize? For example, if Suncor produces 1/4 of the daily 1 million barrels of oil using some 150,000 mcf per day of gas at say $5, but could purchase SAGD steam directly from a third party source at the same $5 per mcf to mmbtu equivalent, theoretically, they could free up that now burned gas, and turn around and sell it using a mix of spot hedges or mid term contracts for say $10. Their EBITDA could be increased without further investment by some $274 million per year, for as long as their long trem purchase contracts stay well below the spot. At a current P/E multiple of 39, that would increase Suncor’s market cap by 10 billion over the existing 31 billion or roughly by 33%. It could also actually increase their P/E, thereby realizing even more market cap gains.
If anyone of you knows the true long term cost to Suncor vs short/mid term selling prices, this windfall can be more accurately calculated. Further, we know that specific plans are well under way for geothermally produced direct steam generation to be sold to the Tar Sands producers at around the same wholesale mcf/mmbtu prices stated above, so this market cap windfall could actually take place in a few short years. Gentlemen, please tell me if my math is totally off base, and/or correct same where you think it may be required.
I wonder how we ensure our claim?
It seems that some Canadian bloggers maybe waking up to the oil natural gas (OG) potential in the high arctic. The article in the To Star referenced at the cathiefromcanada blog doesn’t really go into to many details about
why falling natural gas price in commodity market
when falling pressur seem kindly u send me advice
when we shud sell or purchase
regards,