Some good news, some bad, in the economic data released yesterday.
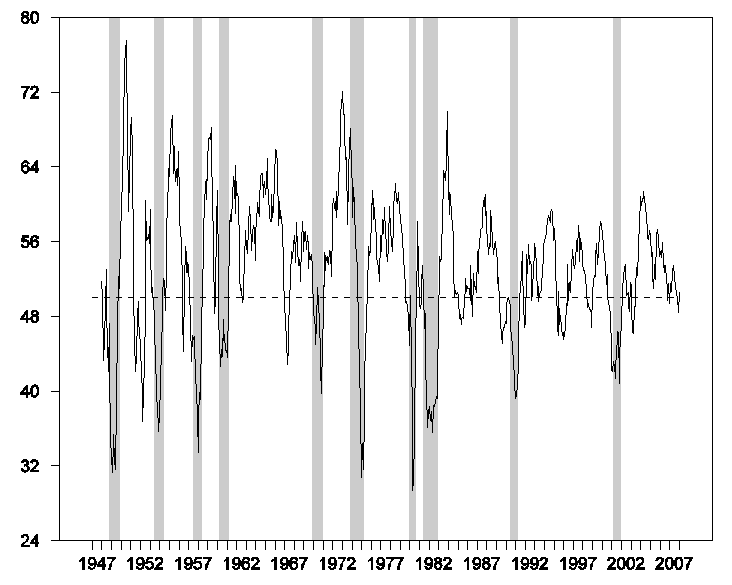
First, the good news. Each of the three indicators that initially turned our Little EconWatcher’s face blue last month all took a favorable turn in the numbers just reported. The first of these is the Institute of Supply Management’s manufacturing PMI reading. This index is based on a survey of managers, with a value below 50 indicating that more plants are reporting declines rather than increases in categories such as new orders, production, and employment. The December value for this index was initially reported to be 47.7, a fairly reliable indicator that economic growth has at least slowed. But yesterday’s release revised the December figure up to 48.4 and put the January index at 50.7, back into growth territory.
 |
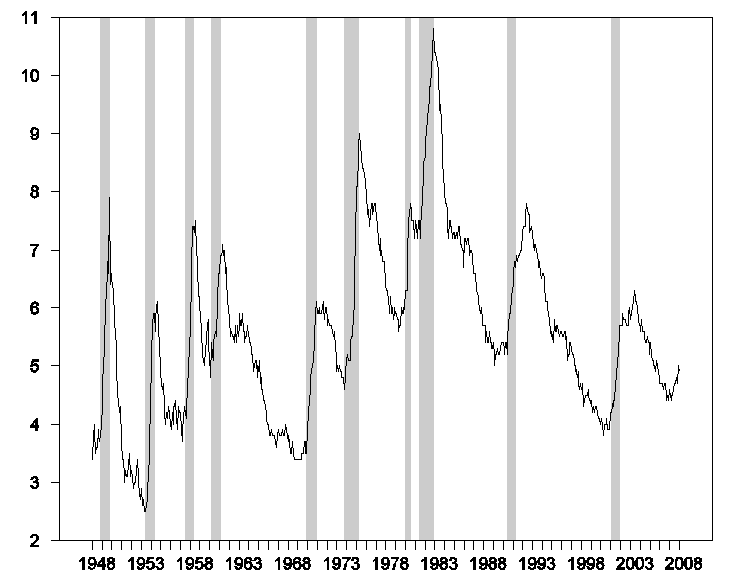
The development that scared me most last month was the spike up in the unemployment rate from 4.7% in November to 5.0% in December. Had we seen the unemployment rate continue to climb at that rate for a few more months, it would have been an almost certain indicator that a recession had started. But the unemployment rate eased back down slightly in January to 4.9%.
 |
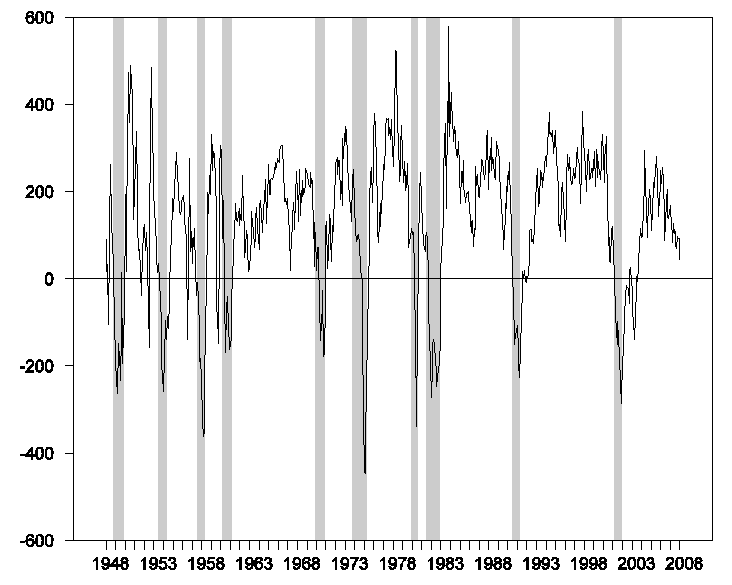
The third key data point that soured me at the beginning of January was the net seasonally adjusted loss of 13,000 private-sector jobs during December that was implied by the establishment survey data released by BLS on January 4. But yesterday the BLS revised those December figures to now show an increase of 54,000 workers on private nonfarm payrolls in December relative to November.
And now for the bad news. The BLS says that private nonfarm payrolls gained only 1,000 jobs in January over December, and when you include their estimate that government-sector employment actually fell by 18,000 workers during January, you get the net employment loss of 17,000 jobs which made all the headlines. I share Dean Baker’s skepticism that the loss in government jobs is for real. And the impression from the new BLS employment figures has to be tempered somewhat by the claim from Automatic Data Processing, on the basis of their database of 24 million workers, that seasonally adjusted private nonfarm employment grew by 130,000 workers during January.
The BLS revised its population control factors for their separate household survey of employment, and for this reason their main tables avoid a direct comparison between January and December employment. But Greg Ip and Kelly Evans waded far enough into the report to notice that when the BLS attempted to apply the same population control procedures to both months, it seems to imply a net gain in employment of 635,000 workers between December and January. If that’s accurate, then pigs surely fly. But the ADM and household estimates have to stir a healthy dose of mud into whatever crystal-clear inference you might have thought to draw from the headline BLS establishment number by itself.
Also noteworthy in yesterday’s BLS release is the downward revision in the nonfarm payroll numbers for most of the other months in 2007 (apart from December) that resulted from their benchmark revisions. On balance, employment growth is now reported to have been lower by 191,000 jobs during 2007 than was implied by the estimates that were released January 4. The one-hour drop in average workweek in January is another clearly bearish indicator.
Mark Thoma has a nice survey of different reactions to the latest BLS numbers. For my money, the best take is from Paul Krugman:
A better guide is probably to average the last 2 or 3 months. What you get then is that employment is still growing, but v-e-r-y s-l-o-w-l-y. In particular, employment growth is well short of what’s necessary to keep up with population growth.
 |
Technorati Tags: macroeconomics,
employment,
economics,
PMI,
ISM,
recession
The ISM is useless in this downturn because it is consumer lead. The last consumer led downturn was………1973. The ISM didn’t do much “telling” then either when the oil shock dried up consumption budgets.
If my source is right, recession is about here, I hope not yet, for my sake!!!!
I’m guessing that this recession may roll out differently than recent ones, Professor.
Take a peek at the real PCE data, Table 2.3.6U:
http://www.bea.gov/national/nipaweb/nipa_underlying/TableView.asp#Mid
Outlays on durable goods peaked last September.
Outlays on non-durable goods peaked last November.
Outlays on recreation peaked last July.
And, now, mortgage lenders are prudently choosing not to extend HELOC drawdowns to folks who have limited equity in their homes.
Consumption was already moving down, and with the HELOC spigot now turned off, it is now going to accelerate its downward movement.
Manufacturers and employers will be throttling back soon enough in response to falling real PCEs.
Not to pile on, but take a peek at real disposable personal income (Table 2.6):
http://www.bea.gov/national/nipaweb/TableView.asp?SelectedTable=75&FirstYear=2007&LastYear=2007&Freq=Month
Real DPI peaked in September; wherewithal to buy out of income is falling, along with wherewithal to buy out of credit (HELOCs drying up).
And, production peaked in September, too:
http://www.federalreserve.gov/releases/g17/current/default.htm
Employment is now rightfully moving downward, following the downward movement of income, consumption, and production.
jg, any chance we muddle through and avoid a recession in the short term. Even in the 73-75 recession, manufacturing finally cratered in the summer of 74.
I think if consumer spending stops declining at these levels, manufacturing can stay about at this level to about mid-09 when the next recession should begin for that area.
Or does consumption completely plummet and kill the entire economy?
ac, I do not see how consumption remains at current levels. Incomes are already falling –> consumption is already falling –> production is already falling –> incomes fall…
Household debt, at unprecedented highs and now defaulting at levels seen in prior recessions, is resulting in the drying up of credit. Hence, I expect to see consumption to continue to fall.
The linchpin, IMO, is the debt-to-income level. Debt is a constant in the short-term. Only an incredible increase in productivity –> increase in income can save us. And, I just do not see any impetus/driver for that.
Another thing to think about is the trend in corporate profits, which outside of financial has remained very solid, the majority of firms beating expectations in the last quarter.
Surely if the financials have been able to write off the bulk of the sub-prime losses in this quarter, we could see a revival of profitability going forward. And on the back of it a growth in investment, output, jobs, wages etc. Throw in the continued strength of the global economy, surging exports and declining imports, on the back of slowing consumer demand and there’s no recession.
Dear Host,
I would be relunctant to put any weight on a one-month pullback in the jobless rate. Look for past swings of 0.2%-0.3% in the jobless rate. They are nearly always followed by a reversal. It doesn’t change the trend. Then, look for prior periods in which the jobless rate has been steady at a low level for an extended period. Such episodes are nearly always followed by a rapid rise in the jobless rate. There is always room for “this time is different” but the record is clear, and I see no good reason to believe that this time is different. The drop in the jobless rate, for now, is noise rather than news.
What stands out at me for the ISM’s chart is how volatility in that index has decreased over the last 50 years. I think technology, especially in the management of inventory, has had a lot to do with that, and may be why recessions are becoming shallower as time goes on.
Ever one into the life boats this is stagflation pure and simple. the consumer is not going to bail us out. they have no money or credit left after they pay for basics.this may be the best jobs report all year