Consumers say they’re gloomy, but why are they still spending?
A surprising report from the Commerce Department today, which indicated that seasonally adjusted nominal sales for retail trade and food services were 1% higher in May compared with April. The new estimates of March and April sales (in red in the figure below) were also revised substantially up from the previous (blue) estimates that had been reported last month.
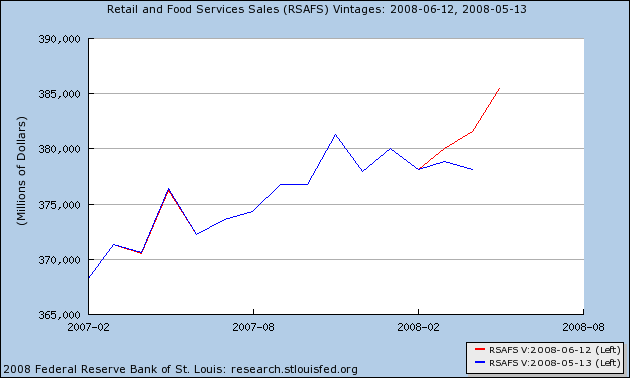 |
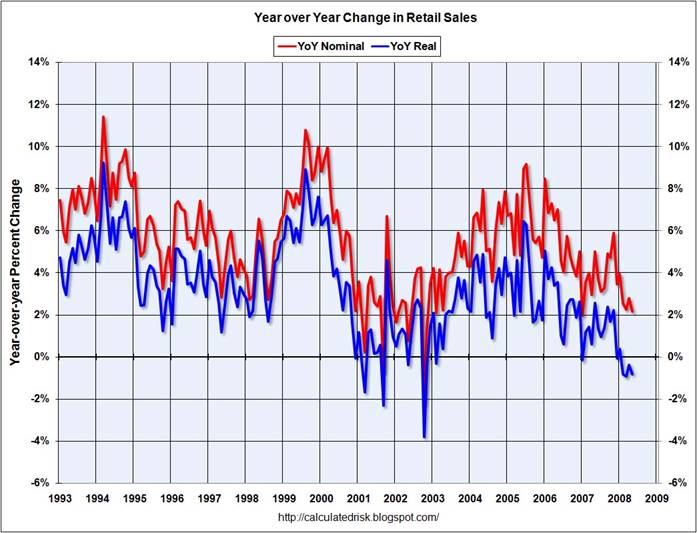
Although a 1% monthly gain would translate into a 12% annual rate if maintained, the newly revised April numbers are still barely above the values last November in nominal terms. Calculated Risk notes that the year-on-year comparisons, when adjusted using an anticipated PCE deflator, remain negative even with the strong new estimates.
 |
The latest numbers nevertheless lend support for Peter Hooper’s prediction that the fiscal rebate stimulus could give a sharp kick to spending. Greg Ip reports:
With today’s retail sales report, forecasters at Morgan Stanley have scrapped their longstanding call for the economy to shrink in the current quarter. The firm, whose continuously updated estimates of quarterly real GDP are closely watched, now sees it expanding at an annual rate of 0.5% in the current quarter, a shift from the previous call of minus 0.2%. This was primarily due to the stronger than expected retail sales report which led the firm to revise up its estimate of personal consumption growth to 1.6% from 0.2%. The firm said it also expects first quarter GDP growth to be revised up to 1.2% from 0.9%.
Economists David Greenlaw and Ted Wieseman confess to puzzlement at the strength in May and the upwardly revised months of March and April. “We doubt that the tax rebate checks had much impact on this report. Indeed, from an arithmetic standpoint, most of the upward adjustment to our [second quarter] estimates reflected the revisions to March and April– and, distribution of the checks did not even start until the end of April…. So where is all this spending coming from? We do not have a good answer to this question. The fundamentals still seem quite negative– income growth is moderating in conjunction with a deteriorating labor market, the wealth effect has swung from a source of support to a significant headwind, and every $1 rise in the price of a gallon of gasoline reduces discretionary spending power by about $120 billion (on an annualized basis)…. While the rebate checks should provide some noticeable support for the consumer over the next few months, we doubt the latest readings on retail sales can be sustained for too much longer.”
Phil Izzo collects some more pondering, but no definitive explanation, from other economists.
Technorati Tags: macroeconomics,
economics,
tax stimulus,
recession
Two things, which enough consumers are seeing:
Recession worries are waning.
A more stable stock market.
Part of this is due to the job market. Overall, it is not bad. The losses have mostly been in real estate/construction and finance. Businesses have been managing their companies in a lean manner and have not had to cut many jobs. If people feel secure with their future income, they tend to spend. As long as the job market doesnt go bust, which would lead to layoffs, this recession will be very mild.
One obvious point that the excerpt misses is that people can spend in anticipation of their stimulus checks. Unless you have 0 access to credit and are otherwise bankrupt, you don’t need to have the check in-hand to make a purchase. For instance, a friend of mine bought a Playstation 3 on credit, and then paid down his card when he got his stimulus money.
So much for the thesis that consumers permanent income would keep them from spending their rebate checks.
I don’t think that the better than expected result necessarily means that the PI hypothesis doesn’t hold. It may be that consumers did indeed spend their rebate checks but that they also plan to spend an equal amount less in future months. In effect just moving their consumption forward by a few months.
Soon all the checks will be cashed and the money spent. Then what?
The word is already going around that the deficit will be larger because of the “stimulus” checks. Contrary to the same mantra from congress when supply side tax cuts are implemented this time it is true. Keynesian “stimulation” comes right out of tax revenue with no increase in production so no increase in wealth.
The government will take some of the “stimulus” back in the taxes on the “stimulus” spending while the remainder will simply consume existing goods and services actually adding to problems by creating shortages that in the current economic climate producers will be reluctant to satisfy. Producers will simply maintain the same production allowing prices to rise rather than make the investment necessary to supply more goods. They know that any incease in sales is extremely short-lived so they will not chance tooling up only to face reduced demand in a couple of months.
The whole thing is foolish.
Classic Census overshoot based on seasonality bs. They will be forced to revise downward into the trend though it has slowed.
Already seeing signs of retail slowing in June. Nothing to see here, sorry.
“I don’t think that the better than expected result necessarily means that the PI hypothesis doesn’t hold. It may be that consumers did indeed spend their rebate checks but that they also plan to spend an equal amount less in future months. In effect just moving their consumption forward by a few months”
Absolutely, nothing mysterious about the “slowing of the trend”. Big dump coming in the 3rd/4th quarter. Will time the disinflation beginnings to a t and commodity crash. Economy will contract signifigently in that timeframe into early 09. Globally, 09 will be the worst since the early 80’s
My take is the government blew it. Looking at jobless claims, it only has stagnated the downturn. I expect things to intensify starting in June and for them to surge in the 3rd quarter.
Is it correct to calculate real retail sales by using the PCE deflator?
According to that chart real retail sales were -4% around 2003. But annual PCE growth in 2003 and 2003 were 2.7% and 2.8% respectively.
Am I missing something?
Calculated Risk is on the right track. Indeed the PCE probably significantly undermeasures the very inflation helping create the illusion of growing retail sales.
If the price of a donut shoots to one gazillion dollars, it takes very few cops on a coffee break to send retail sales through the roof. Isn’t the huge increase just food and gasoline, two things which are conveniently NOT counted in price inflation data?
“Consumers say they’re gloomy, but why are they still spending?”
The overweight person says they’re fat, but why are they still eating?
The alcoholic begins to admit that their drinking is a problem, but why are they still drinking?
Admitting you have a problem is indeed the first step to correcting it, but the correction does not just come automatically. We have a serious addition to consumption in this country, and it will take time for the habit to break. For many, just like with other addictions, it won’t come just with starting to recognize the problem but change will finally come when they hit rock bottom – we’re a long way from that. Until then, the addicts will keep on spending despite having a serious dissavings problem that is no longer masked by the wealth effect of the housing bubble. Run up the credit cards, tap the home equity line for the last penny if your bank hasn’t cut it off yet, cash in the 401k, raid the kids college savings… the dissavings train will eventually come off its tracks and it ain’t gonna be pretty when it does.
Oh please,
Take out food and energy and the supposed gain is negative after inflation.
Try these :
Central bank body warns of Great Depression
The Bank for International Settlements (BIS), the organisation that fosters cooperation between central banks, has warned that the credit crisis could lead world economies into a crash on a scale not seen since the 1930s.
http://www.bankingtimes.co.uk/09062008-central-bank-body-warns-of-great-depression/
or this:
(Bad) Things That Have Not Yet Happened ( But Will )
Bank Failures
Bigger U.S. bank failures may be coming FDIC
Monoline Fallout
$500 Billion Option ARM Crisis Coming Up
Option Arms – The Next Real Estate Crisis
By April, 2009, hundreds of thousands of option ARM mortgages will begin resetting, bringing on a fresh wave of foreclosures.
Additional Problems
A rising unemployment rate. I expect 6% by the end of the year and 7% or higher in 2009-2010.
An imploding commercial real estate.
Rising junk bond defaults.
Rising numbers of foreclosures and bankruptcies.
Rising credit card defaults.
Economic Picture Worsening
The economic picture is worsening across the board. And not just in the US but in the UK and Europe as well. A housing bust is now underway in the UK. Inquiring minds may wish to consider UK Housing Market Seizes Up.
http://globaleconomicanalysis.blogspot.com/2008/06/things-that-have-not-yet-happened.html
This is a “Drank the Koolaide” post by the econobrowser.
Hell, shopping is as good as chocolate for treating depression. 😉
So my wife tells me.
Mike M.,
How does reporting the data as released, and quoting responses to it from other sources, qualify in any way as Koolaid behavior? Take a look at the chart. What happened is that revission (which are more complete and reliable) show stronger sales in prior months than was thought. May data are not yet revised, so we can ignore them or assess them knowing that our assessment may have to change. We cannot, however, honestly claim that things are as bad as we thought they were, based on earlier data. Where’s the Koolaid in that?
Is it not the case that OER significantly underestimates the positive impact on domestic demand of falling house prices. Goldman Sachs recently noted that;
“The biggest single component of the CPI is owners equivalent rent (OER), an estimate of what a homeowner would have to pay to rent his or her home. The logic of moving to the OER calculation, which was done in 1983, was to isolate the consumption component of home purchase (the value of using the house, which the CPI is meant to measure) from the investment component (the rights of future appreciation). Despite this superiority in theory, OER has come in for criticism because it is not something people actually pay, and it can diverge substantially from observed housing
prices. However, at present, the OER methodology is not necessarily a source of upward bias: with home prices falling at a 25% annualized rate, other methods would be likely to show lower housing inflation!
In other words as rents have not fallen nearly as fast as either mortgage interest rates or house prices, the full impact of housing depreciation in increasing domestic demand through cutting consumers housing costs is underestimated.
Hence the resilience of domestic demand notwithstanding the high inflation of food, fuel etc.
The other point is that in discussing “consumers” we are making an abstraction from class.
The bottom 60% of the US population earn a mere 26% of income.
The top 5% earn 31% of income.
Might it not be the case that the rising proportion of foreign profits, slowing in the rate of write downs and partial recovery of banking profits in Q1, significantly increased the domestic demand of the rich – even while the poor majority struggled under the burden of rising consumer essentials.
Steve, remember that these are monthly year-on-year growth rates and there is some noise in the monthly numbers. The data point you ask about is October 2002, when seasonally adjusted nominal monthly retail sales were 1.7% below their value of October 2001. An inflation rate of 2% would give you growth of -3.7% for that month. What inflation number would you want to use to deflate that observation in place of the PCE deflator, and how could you by any calculation come up with a number significantly different from -4%?
The nominal year-on-year growth for May 2008 is +2.45%. Again, what inflation rate relevant for the preceding 12 months are you advocating in order to conclude that this observation represents positive year-on-year real growth?
As of April the y/y ch: in the deflator for retail sales calculated by BEA is 1.6%–this is unpublished data. Using the PCE deflator is more accurate then using the CPI but it still overstates the rise in prices for retail sales. It would be more accurate to use the PCE deflator for durables and nondurables excluding services. Services prices almost always rise faster then goods prices so using the overall deflator still imposes a modest upward bias to the deflater and causes the real retail sales estimate by calculated Risk to be weaker then the actual data.
In April my equation for real retail sales growth based on inflation, real income, consumer confidence and lagged fed funds said growth was exactly where it should be. The May data probably will move up towards the plus one standard error of what my equation calls for.
Historically, when the actual growth goes outside of one standard error of the equation it generally corrects fairly quickly. this point would tend to support the argument that this strength is due to both the rebate check and consumers borrowing from future sales.
Buzzcut: tell her to shop for chocolate and spend half as much.
Couple things might be at play here in increase in retail. Increase in prices for food and energy and everything else, well documented increase in personal credit card debt(profligate consumer spending), and the government pumping the numbers. Any emphasis on PCE deflator over CPI ignores the possibility that the published numbers are not manipulated or that these measures are actually accurate in reflecting an increase in price level. These two things can’t be presumed. The numbers say one thing and every other anecdotal measure one can find of the real economy is down. Trucking cartage, retails jobs lost, retail traffic, same store sales etc.
I think spencer basically explained what I was getting at.
It just didn’t seem intuitively possible that real retail sales were negative when real PCE as calculated by the BEA is still positive. Link
Jim,do you really believe to private economists like David Greenlaw and Ted Wieseman …??? They have been solding the “apocalyptic scenario” since last autumn, because their firm was (is) full of subprime mortgages…!!! They (and other economists) are the reason why the FED is going to increase the interest rates! They have been influencing the private sector expectations since last summer!!! It’s incredible!
If prices increase by 10%, even if one consumes 5% less, the statistics would still show a 5% increase in consumption.
A last remark on the OER. According to Wachovia
http://www.wachovia.com/ws/econ/view/0,,4333,00.pdf
payment on a medium sized home has fallen from 24% of income at the end of 2007 to around 19% now. Yet during the same period the OER is rising at 2.6% annual rate
http://www.wachovia.com/ws/econ/view/0,,4337,00.pdf
So that notwithstanding the impact of the wealth effect on reducing MEW, the increase in peoples spending power through lower mortgage repayments would appear to outweigh that reduction, hence partially explaining the maintenace of consumer demand.
Over the long run rental prices and home prices should move about the same as they are both driven by roughly the same factors. The last decade or so of housing prices rising much more than rent is a historical anomalie and we should expect the two series to converge. The convergence should occur largely through home prices falling while rent remains relatively stable, at least in real terms.
So while for the past few years the CPI has understated inflation for the next few years it should overstate inflation.