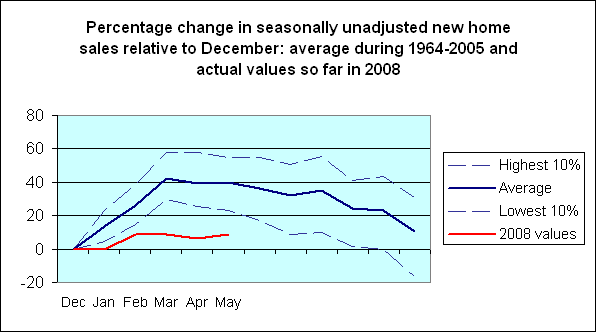
As noted by Calculated Risk, global warming or no, the spring selling season for new homes never seemed to arrive this year.
There is a strong seasonal component to new home sales. In a typical year, the number of homes sold each month in March through May would be 40% higher than in December. Nine years out of 10, the rate would be at least 20% higher. This year? Only 9%.
 |
And December 2007 was itself down 38% from December 2006 and down 50% from December 2005.
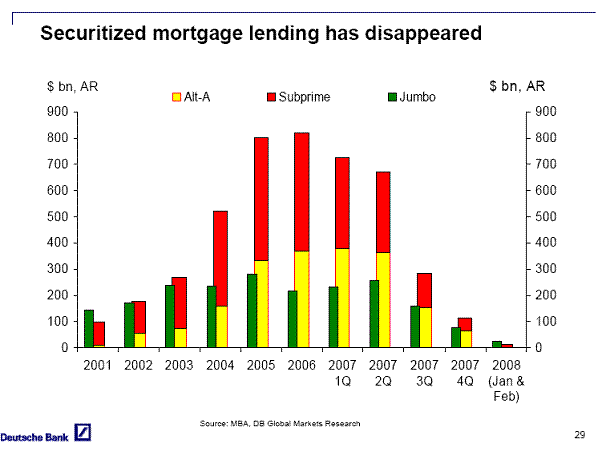
Why no spring? This graph from Peter Hooper may have something to do with it.
 |
Technorati Tags: macroeconomics,
housing,
recession,
economics
Impressive decline in numbers. I think the last picture has a slightly misleading title, although it still provides some good information. Those three categories might be summed up as “non-standard” securitized mortgages. It makes perfect sense that the Alt-A and subprime are gone since these loans are the poster-children for principal-agent problems in both the primary and secondary markets.
I wonder whether the decline in fully qualifying jumbos is due to lack of funds made available or reduced demand for properties as non-speculative price support for more-expensive real estate is sorted out. A look at the market for standard fully qualifying loans might provide some insight. These aren’t shown on the picture.
so, what is going to happen to inventories of unsold houses???
The fact that since 2005-2006 The Supply of homes have run above The Demand might imply that residential builders perceived the strong run up in housing prices in line with fundamentals. Unfortunately, that turned out to be wrong.
So, now, I hope that oil producers perceive the level of oil prices of these days like a FAIR VALUE posed to be higher in the future. This, in turn, would generate over time an increase in global production.
The crucial issue is time.
Maybe now we don’t have the time needed to create the new supply, because variations in oil production are so sticky. Or they seem to appear. At least this is what the OIL experts have been saying since last september (when the FED started to lower interest rates).
Unsold inventories of new homes are declining and have been decling for 12 months. As a percentage I think the peak to current decline is about 15% in absolute numbers. The typical, listed major home builder will have cut their inventories by more than half over the past 18 months.
Here is an extract from KB homes May quarterly conference call:
“We have reduced inventory levels by 50% from a year ago to $2.6 billion at May 31, 2008. We ended the second quarter with approximately 56,600 lots owned or controlled, down 70% from a peak of 186,000 ”
Here is an extract from the May quarter Lennar conference call:
“Additionally, each division brought tremendous focus on inventory homes in the second quarter, and reduced completed inventory by almost 50% sequentially”
I also do not like chart 2 unless more words are added around it.
6 groups appear to be anual data, 4 groups appear to be annualized quarterly data, and one group appears to be annualized data for two months.
The mixing of time boundaries makes even less sense given the preceding data showing how annualization calculations will probably not fit well to this years data.
20 quarters worth of unadjusted equal-period data, with one stacked bar showing conforming, jumbo, alt-a and subprime would make a clearer picture.
I used to build such charts, but I lost interest in the Excel grunt work after doing enough to fool myself into a confidence. Reading CR is easier. Calculated Risk makes the worlds best Excel charts.