Today we outsource with some interesting links on oil markets and housing.
Lots of useful observations on oil supply and demand from Yves Smith, including the fact that BP’s Thunder Horse, which promises soon to be pumping a quarter million barrels per day of crude oil out of the Gulf of Mexico, has finally started production.
Ironman gives us another neat tool to calculate whether it pays to move closer to your worplace.
Phil Miller describes what it’s like to find oil in your backyard in North Dakota.
WSJ Real Time Economics surveys various takes (all negative) on today’s jobs report.
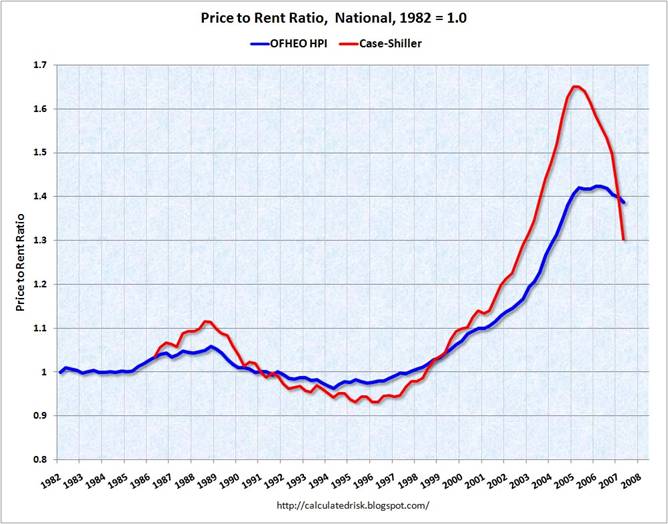
And the always useful Calculated Risk updates graphs of the price-to-rent ratio and directs us to modern ghost towns among the would-be Los Angeles exurbs.
 |
Technorati Tags: macroeconomics,
housing,
oil
The price-to-rent ratio is the single most useful measure in determining where we are in the Real-Estate bubble.
In California, the ratio will return to the mean by home prices being flat for another 5-7 years. The same already happened from 1989-95. Average people are still happy that ‘at least the price didn’t go down’, blissfully ignoring the concepts of inflation and cost-of-capital.
The Price-to-rent ratio chart invites the reader to think that “1.0” represents equal economic value. But as far as I could figure from digging through the links, 1.0 just represents a re-scaling of whatever the raw ratio was when they started compiling this statistic in 1982. An actual economic comparison depends on lots of variables like interest rates, ability to benefit from the mortgage interest deduction, anticipated rent and property inflation/deflation, relative costs of utilities and maintenance (including time value of the owner’s labor), property taxes and insurance, the implied amortization schedule of purchase and sale related costs, and estimates on the economic return of any funds that would have been invested in some other fashion if not in a home. For some people, home ownership with a regular (as opposed to interest only) mortgage will always be a good financial option because of the forced monthly savings. But the macro circumstances where home ownership is a good generic investment (e.g. without special insight into future property appreciation potential beyond inflation, sure knowledge of an ability to keep a property in one’s family for an atypical length of time, or an ability to predict the future course of interest rates) are, I guesstimate, relatively rare.
Home prices were undoubtably driven up by speculative demand and by low interest rates. But if tastes and other non-economic motivations create extra demand for houses, and those factors change over time, then one shouldn’t look to a chart like the above for any strong prediction about where the price-to-rent ratio might be heading. To some extent it just shows how popular home ownership was at recent times in the past.
According to the Financial Times, BP’s Thunder Horse is having start up difficulties:
Then, as BP geared up to start the initial four wells that were planned to bring the field to production last month, the Financial Times learned it had discovered problems with three of them.
“Rarely does a project go off without a hitch, but this is not normal,” said Kenneth B Medlock III, fellow in energy studies at the James A Baker III Institute for Public Policy. He said: “This sort of news will not be taken well by the market. I think what we are seeing is the result of an industry that is stretched to its limits in terms of qualified personnel, expertise and resources.”
Each well could take up to 30 days to repair.
Let’s not change behaviour, lets drill for more oil. That’s been the solution since the 70’s when US was hit by oil embargo. Let’s not invest in the infrastructure of our communities, creating public transportation, railroads, etc but continue behaving in a delusional manner.