More bad economic news arrived today from the Bureau of Labor Statistics.
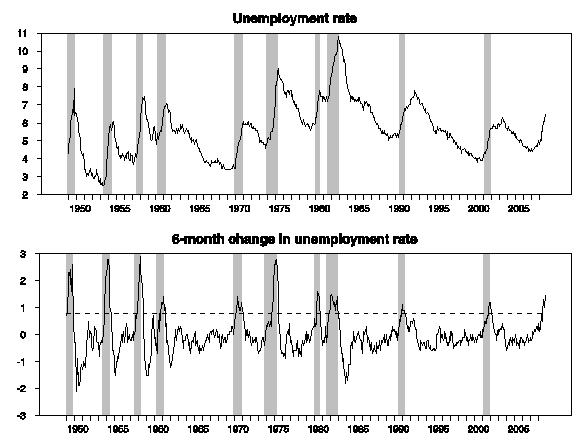
The BLS reported that the unemployment rate has gone up by 1-1/2 percentage points in the last six months, with 6.5% of the labor force now reporting themselves to be looking for work and unable to find it. That brings unemployment to a higher level than it reached in the preceding recession, and is a faster 6-month deterioration than was observed at any time during the preceding two recessions.

|
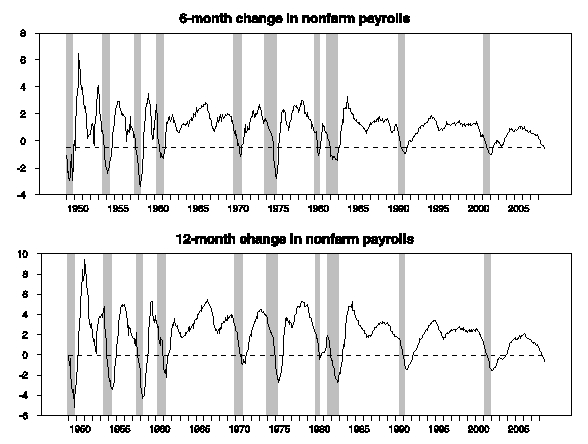
Data from the BLS survey of establishments was no less grim. Not only did the BLS report 240,000 fewer workers on payrolls in October (on a seasonally adjusted basis) compared with September, but it revised the September job loss to 284,000, and the August loss to 127,000. That puts the 6-month change in employment at -0.6% and the year-over-year change at -0.8%.

|
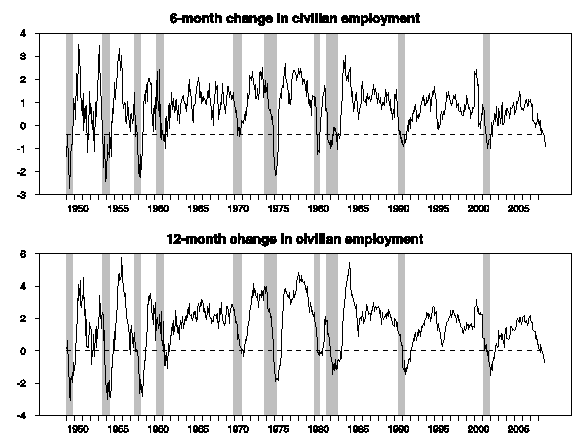
There was no place to hide in alternative employment measures. On Wednesday ADP estimated, on the basis of the payrolls that it processes for 24 million American workers, that private employment fell a seasonally adjusted 157,000 workers in October. Yet a third indicator, based on the BLS survey of households, estimated that U.S. employment fell by a seasonally adjusted 297,000 workers in October.

|
All of which confirms the impression that the economic situation deteriorated considerably in September and October.
Technorati Tags: employment,
recession,
macroeconomics,
economics
“All of which confirms the impression that the economic situation deteriorated considerably in September and October.”
That’s just looking at the non-farm payrolls. Looking at the changes in total employment, we see a fairly steady decline [graph] since July 2008. That better coincides with the deterioration we’ve seen in the stock market.
Meanwhile, most of the brunt of disappearing jobs in the economy would seem to be being borne by those Age 16-19. Since total employment peaked in November 2007, 24% of the total decline since (405,000) is accounted for by teenagers, who themselves account for just 3.7% of the entire U.S. workforce.
Meanwhile, if you look at those Age 20-24, you find that individuals in this age range account for 33% of the total decline in employment since November 2007 (427,000). These individuals account for 9.3% of the entire U.S. workforce.
All-in-all, a very youth-oriented recession.
What will likely be the net job creation/loss figure from the inauguration date of Bush in 2001 through the inauguration date of Obama in January 2009?
My guess is the figure will be the most atrocious on record since the Great Depression.
Moral?
TAX. CUTS. FOR. THE. WEALTHY. DO. NOT. WORK.
“What will likely be the net job creation/loss figure from the inauguration date of Bush in 2001 through the inauguration date of Obama in January 2009?”
About 4m jobs created. Which is not good at all.
But the growth in the workforce has slowed as well, so Obama will not be able to create as many either. The job growth in the 1980s and 90s was due to a) Women entering the workforce, and b) Baby Boomers reaching their peak earnings years.
Both were one-time events.
So while Obama may create more than Bush’s 4m, he has no prayer of creating as many as Clinton’s 22m.
Also note that the average unemployment rate for Bush was about the same as Clinton’s over 8 years. The misery index for Clinton vs. Bush was also about the same.
All of James’ charts also tell us that an economic recovery will happen no later than Q209 (even though unemployment rates still rise well after recessions end).
All prior recessions, and recoveries, relative to where we are with this recession, point to a Q209 recovery. Oil is cheap, interest rates are low, the yield curve is steep, and productivity is outpacing GDP. All are elements of a recovery.
GK,
why the yield curve is so steep?
It implies a recovery or… a massive increase of Govies going forward? I’m not sure. OK, it’s telling us something, but I can’t understand it properly.
Productivity might improve if people trust the new President. This would turn out to be the real wild card.
I’d like to be as confident as you seem to be.
I’m not sure the charts show us when the recovery will begin, but they did tell us when the recession began. The slowdown started in 2007 and probably became an outright recession over the summer.
Conversely, if the fall in raw materials prices does have an impact in reflating the economy, then we should see unemployment starting to fall over the next few weeks. The big decline in prices was in September/October, given the lag before this feeds through to prices, its impact should be start to be felt from around now onwards. Given that its estimated that the fall in fuel prices equates to an additional 2/3 million new jobs, if its going to have an effect it will be evident pretty soon.
We’ll also be able to tell whether the easing of the credit crunch is sufficient to offset the ongoing downward spiral, though I note that while lending rates have eased banks are hoarding more cash than ever.
Employ one million taxpaying American citizens by STOPPING the yearly influx of 1 million new immigrants. You can’t grow your way out of this quickly enough.
STOP ALL IMMIGRATION NOW
IT’s THE IMMIGRATION STUPID!
Shut down UC San Diego. It is false prosperity! Nothing more than an h1b visa mill to nuke the local workers with a glut of cheap labor.
Does anyone know the only segment of the market where employment grew? Take a wild guess.
Hey DickF
Building and expanding schools for non-existant jobs is what’s occurring. These schools exist for themselves, they have no internal regulatory controls. If they could admit fifty times the number of students they would. Do we really need 2.5 dentists per person? Or how about 1.5 economists for every 100 citizens?