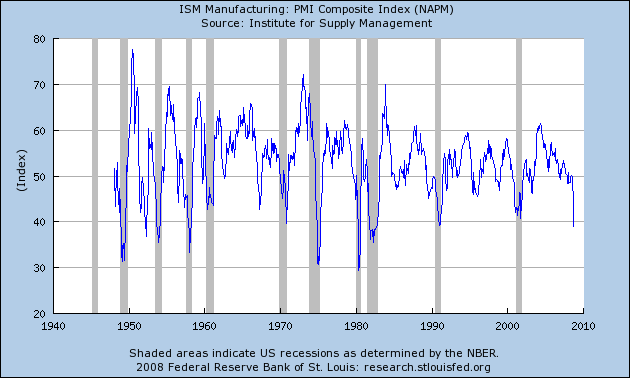
A quick update on the October ISM report.
On Monday we also received a dreadful new report from the Institute of Supply Management’s survey of manufacturers. A value below 50 indicates that more companies are reporting deterioration than are reporting improvement in categories such as new orders, production, and employment. The index fell to 38.9 in October, a value that’s basically not seen unless the economy is in a recession, and indeed is slightly worse than the low point of the two previous recessions.

|
I take that as another early indicator that 2008:Q4 will be worse than Q3.
Technorati Tags:
recession,
macroeconomics,
economics
Professor, now that the election is over and the political handlers have been heeled, please use your channels to the NBER BCDC to say, ‘Hey, guys, the coast is clear; if you see a recession — and the rest of us see it, gentlemen — please so declare.’
Clear, strong, honest signals from authorities are important, I think. It helps the sheeple to behave in an economically-rational way.
from the ISM website (http://www.ism.ws/ISMReport/MfgROB.cfm?navItemNumber=12942):
So, I hope next month those 3 negative factors won’t weigh on the industrial sentiment. Maybe the market already knows that.
What I don’t understand is why congress, the administration, and the FED don’t address these problems head on. They always attempt to use interest rates to control the money supply, or they attempt to use consumption stimulation to improve production. I feel like I am playing pool with someone who always has to hit two rails before he can attempt to put the ball in the hole.
I have a unique idea. Why doesn’t the FED just increase or reduce the money supply through open market activity if they want to change the money supply and if production is declining why doesn’t congress give direct support to production through tax reductions and reduced regulations. Just get rid of the wedges that prevent producers from producing.
For comprehensive interactive graph and historical and current PMI data please visit http://fxeconostats.com
Look under US and Production & Business Activity. You can save the chart as an image and use it.