The Bureau of Economic Analysis reported today that U.S. real GDP fell at a 3.8% annual rate in the fourth quarter of 2008.
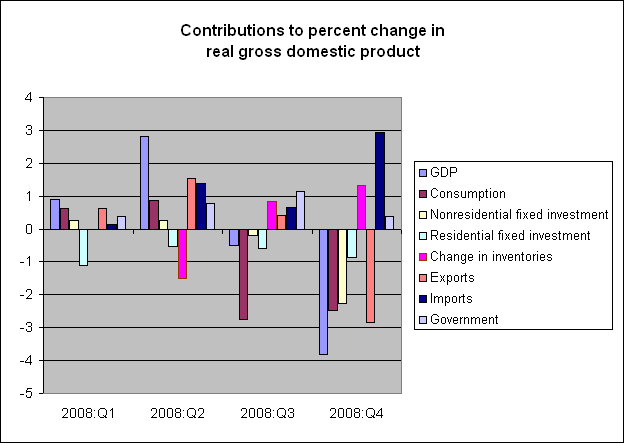
A -3.8% annual growth rate was a bit better than the consensus forecast of -5.4%, but no cause for cheer there. The discrepancy is entirely accounted for by inventory accumulation, which contributed +1.3% to the 2008:Q4 figure. Production (which is what GDP measures) was bigger than sales, as a result of which inventories piled up. Real final sales were down about 5.1%, close to the consensus expectation.

Housing subtracted 0.85% from the 2008:Q4 growth rate, but no surprise there– it’s been doing that much, and then some, for three years now. The decline in broader consumption spending exerted a much bigger drag, as it had last quarter. Also in the fourth quarter nonresidential fixed investment– most importantly, spending on equipment and software– joined the party, or perhaps I should say party-pooping. There was an impressive collapse in both exports and imports. From the point of view of GDP (which is based on exports minus imports), those combined to a wash. But from a broader economic perspective, plunging imports and exports could be very worrisome, because it signals that the downturn is very much global, and that a key engine that has driven rising living standards for everyone in the world– efficiency gains from trade– may be stalling out.
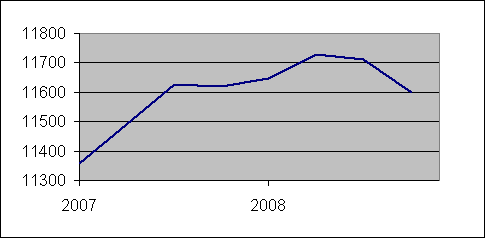
On the other hand, today’s number does not mean that the real value of goods and services produced in the U.S. fell by 3.8% in the fourth quarter. The American convention is to report these numbers as annual rates, so that the actual drop within the quarter was only 1/4 the headline number. In fact, the level of U.S. real GDP in the fourth quarter of 2008 was only 0.2% lower than it had been in 2007:Q3, before the current recession began.

|
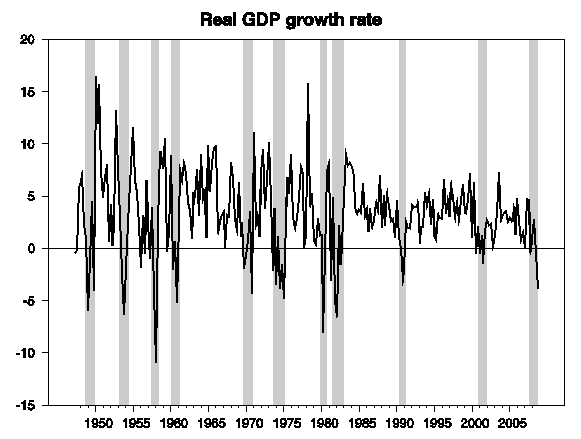
Although the cumulative decline so far has been relatively modest, the 2008:Q4 quarterly drop is bigger than anything seen in the previous two recessions, and puts it among the dozen worst quarters on record since World War II.

|
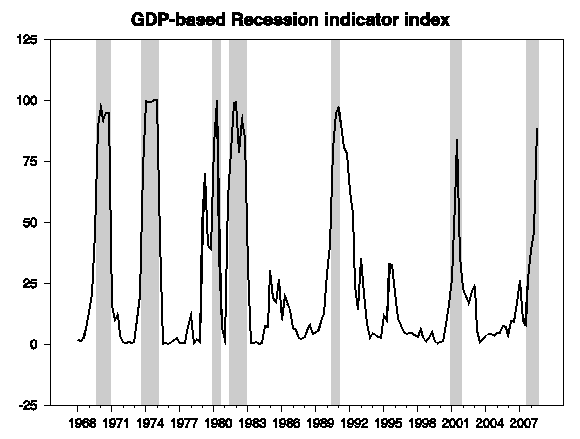
The number is also sufficiently dramatic to eliminate any question that the economy was in recession in 2008:Q3, pushing the Econbrowser Recession Indicator Index to 88.4%. This is a characterization, using data as now reported through 2008:Q4, of the state of the economy as of 2008:Q3. A value above 67% is enough to trigger a call that the economy was in recession as of the third quarter of last year.

|
| Quarter | Full-sample smoothed inference |
|---|---|
| 2007:Q3 | 31.3% |
| 2007:Q4 | 60.5% |
| 2008:Q1 | 69.4% |
| 2008:Q2 | 73.6% |
| 2008:Q3 | 88.4% |
The basis for the index is described here. The index by definition is a real-time assessment that is never revised and is used automatically to generate declarations (also never to be revised) that a recession has started or ended. When the signal for a turning point is triggered, as the current value has just done, our approach is to use the full sample of currently available revised data as of that date to make a simultaneous declaration as to when the recession most likely began. The current full-sample smoothed inferences (whose calculation is described here) are summarized in the table at the right. There is not a very sharp demarcation in choice of the date, though following our previously announced procedure, we date the recession as beginning in the first quarter for which the revised index is above 50%. That rule causes us to announce today that the current U.S. recession began in 2007:Q4.
This announcement turns out to be exactly the same final determination as that made by the NBER Business Cycle Dating Committee, which the NBER announced on December 1, 2008. Based on simulated historical performance, the expectation is that our dates will be very similar if not identical to the NBER dates, and will sometimes be announced after the NBER announcements (as proved to be the case this time), but sometimes announced considerably sooner. Unlike the NBER dates, our dates are arrived at by an entirely mechanical, quantitative algorithm.
We will declare the recession to be over when the index falls below 33%.
Technorati Tags: GDP,
recession probability,
recession indicator index,
macroeconomics,
economics
Thank you for your quick update Professor. There is a very large upward recession probability revision in 2008:Q2. Same thing happened in my exercise with the MSI(2)-AR(0) model estimated over 1947:Q2-2008:Q4 sample for real GDP Q/Q SAAR. Smoothed probability of recession in 2008:Q4 from this model is 93.2%.
Very nice analysis, Professor, of the Q4 data.
Beat the East Coasters/Ivy Leaguers to it; develop and publish an ‘Econbrowser Depression Indicator Index.’
Initially, you will be viewed as nutty. In a year or two, you will be viewed as prescient.
JDH,
Inventory builds helped this time, not likely to occur next period with all the auto factory slowdowns…
jg
Tough to calibrate that model with only one data point!
Very small point, but you imply that GDP numbers came in as forecast once you adjust for inventory investment. That logic implies that the forecasts didn’t include any inventory accumulation, which would be a very strange forecast in these times. On the other hand, if forecasted GDP did include inventory accumulation, the apples-to-apples comparison would be actual GDP excluding inventory investment and forecasted GDP excluding inventory investment.
GWF: More on inventories from WSJ Real Time.
There wasn’t much more on Inventory as the industry economists say very little about their under-estimate of Inventory…it’s not as if they don’t know that vehicles were/are not selling. It is a little curious: “See? not as bad as we thought!” could be the strategy. [Can we look at those individual calculations from the economists polled to obtain the 5% number?] Of course this is just the “advance” and we will likely see this number plummet to that former figure anyhow as the Birth/Death modelling takes a hit…but by then we pat ourselves on the back for braving those scary times in the past.
Right now it seems a tad academic…more than a tad academic to be fussin with the precision of these numbers. We need to recognize what double digit unemployment means, coming to your neighborhood soon…I don’t think it’s block parties all week long. No.
In addition to increase in private inventories, other two odd positive contributors to GDP growth were personal expenditures on gas/oil (added +0.63% to GDP) and personal expenditures on electricity/gas at home (added +0.42% to GDP). That’s additional 1.05% due to these unusually high contributions.
Household Operation (under Services) also had a surprising 0.47 addition to GDP..the others generally negative, including the preceding 2. It’s not as if folks are calling in Minute Maids these days…but maybe it was the weather? (seriously) flooding in the NW?
CR has a graph showing fewer miles driven making that 0.63 look downright suspect (again a number that doesn’t look right in the series). But people are stayin home more, so we allow the extra electricity for that (0.42), but not if you also want the cheaper fuel (is that it?…no, CR shows less miles) in your tank.
I was hoping that someone could say something about inventoried autos and how they are registered. MSRP? or actual prices paid for incentivized up the kazoo recent sales? with or without the infamous depreciation attached since the date of manufacture?
We will declare the recession to be over when the index falls below 33%.
That should be: We or our heirs…
“That should be: We or our heirs…”
Pretty grim. So what do you figure we’ll come out of this with in GDP when America finally grows again? 15 – 20 years down the line, about $8 trillion USD from our peak last year of $14.4 trillion USD? (USD, assuming the dollar even exists by then.)
@:MM “15/20 YEARS DOWN THE LINE”
THAT WOULD BE THE VERY LONG RUN
70 YEARS AGO IN “ONLY” 4 YEARS GDP LOST NEARLY 30%
Inventories will cause Q109 to have a worse GDP growth rate than Q408.
But the good news is, almost all excess inventory will be flushed out by Q209, enabling a strengthening in Q309.
Yes, but he said “our heirs,” which would imply a timeframe far longer than 4 years and would suggest that many of us will not see growth again in our lifetime.
I’m just trying to see if anyone predicting what is essentially our economic collapse – and I don’t mean an economic hard time or even a depression – cares to give any detail beyond doomspeaking quips.