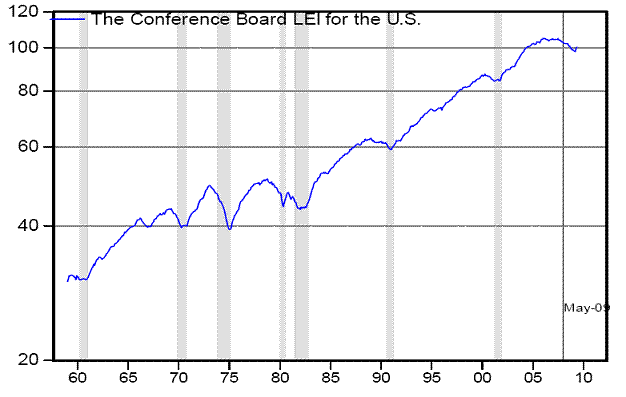
The Conference Board Leading Economic Index increased by more than 1% in both April and May. Since I’ve been scratching my head trying to find some confirmation for recent economic optimism, I was curious to take a look at what’s responsible for the favorable reading from the LEI.

|
The monthly change in the Conference Board Leading Economic Index is constructed from a weighted average of 10 separate indicators. The index rose on average by 1.16% per month during April and May. The table below identifies the contribution of each of the 10 components to this two-month average.
Topping the list is the surging stock market. A 2.6% gain in the S&P500 increases the LEI by about 0.1%, so the 8.8% average monthly gain over each of the last two months contributed 0.34%, or almost a third of the total gain, all by itself.
| Indicator | Contribution |
|---|---|
| stock prices | 0.34 |
| yield spread | 0.30 |
| consumer expectations | 0.23 |
| vendor performance | 0.21 |
| unemployment claims | 0.06 |
| new orders (consumer goods) | 0.06 |
| building permits | 0.02 |
| M2 | -0.01 |
| new orders (capital goods) | -0.02 |
| average workweek | -0.04 |
| Total | 1.16 |
Second in recent importance has been the spread between the yield on 10-year Treasury bonds and the overnight fed funds rate. The LEI is credited with a 0.1% gain for the month if the 10-year rate averages 100 basis points more than the fed funds rate for that month. With the average spread about 300 basis points over the last two months, that’s contributed 0.3% to the monthly growth rate of the LEI.
Whether that spread is in fact all good news is not clear. At least some of it likely reflects inflation or
deficit worries, though Paul Krugman and Steve Gordon ([1], [2]) favor the “good-news” interpretation.
Another important contribution is the rising spirits of American consumers, a trend I commented on (and worried about its prospect of continuing) in my previous post. These three indicators– stocks, spread, and sentiment– account for 3/4 of the rise in the leading economic index over the last two months. And they’re all based on what other people think rather than hard economic numbers themselves.
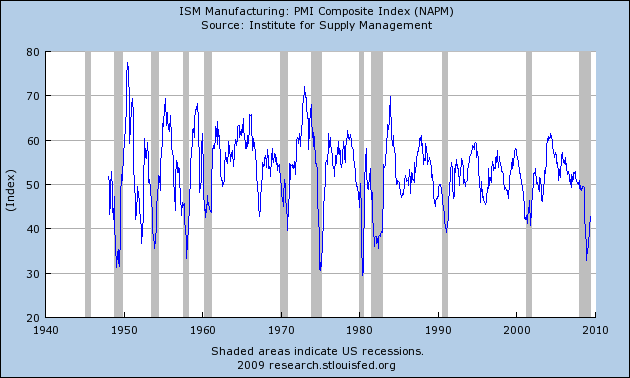
The one solid positive that’s based on direct economic data is the vendor performance measure, which is also one of the components of the ISM manufacturing index. This is a diffusion index– a value below 50 indicates that the number of manufacturing supply managers who said things got worse last month outnumbered those who said they got better. The reported May value for the ISM’s overall manufacturing PMI was 42.8, while the vendor performance (or supplier deliveries) component used in both the LEI and the PMI was at 49.8. These are improvements over the more pessimistic numbers reported earlier, and any improvement in the vendor performance measure makes a positive contribution to the monthly change in the LEI. But it seems to me that it’s hardly time to celebrate as long as deteriorating reports still outnumber those of improving conditions. ISM figures that an overall PMI of 42.8 corresponds to about a 0.5% real GDP growth rate. If that’s the happiest real number you can point to, I wouldn’t feel too cheerful right now.

|
Apart from those 4 indicators, the remaining 6 elements of the leading economic index are sending pretty tepid signals. Among the more favorable is that coming from initial claims for unemployment insurance, an indicator we’ve been discussing at length. This indicator actually made a negative contribution to the May LEI, partially undoing the contribution to the 2-month average of the initial positive reading for April.

|
So maybe we could summarize the recent strength in the leading economic index this way. The main reason we think the economy is improving is because many of us think the economy is improving.
Fortunately, rising consumer sentiment is key to a true fundamental recovery.
Seeing M2 measures unchanged along with y/y headline CPI down, I think the Fed can justify ratcheting up debt monetization today. Should it be a $70 up day for gold and 5% for 30 year treasuries?
The logic, then, goes like this: Oil is likely the problem, a consumer group thinks the oil problem is going to be solved. Is this false optimism? Check check miles driven, or a key ratio might be energy cost per (mass*kilometer). Look for verification that oil efficiency increased.
The last two months of durable goods orders looks pretty solid.
If you look at the recovery in the capital markets you see a rally from where a depression and deflation were being discounted. Markets are now priced at fairly normal recessionary levels — what looks like expectations of recovery is really a pull back of expectations of falling into the abyss. Still, it is the first necessary step towards recovery.
Consumers will feel better with a rising stock market and gas prices that still below the historical lows from a year ago.
For the Index of Leading Indicators, I would look at it’s components and give housing a smaller weight since it’s not expected to recover to a healthy level anytime soon.
Very good article.
In my opinion, it is all a matter of market timing. It does not matter if it is gold, oil, or Microsoft, if you have access to good market timing signals, they will help you get in and out at a profit.
No guarantees in this business, but if they are right most of the time, you can still make $s.
There are may web sites providing them out there (search Google). Just find one that works and use it! Check out http://invetrics.com as an example.
Its Dow Jones timing signals are up 43% as of 6/23/09 while the Dow is up just 29% off its March lows.
Following a market timing system works!
The last sentence, that is enough to get real improvement. That is like fads in fashion. They have no other reason for coming into existence and vanishing as what people think, and they bore very similar time structure to economic crisis and booms.
Here is a link to a research : “Why thing become unpopular”. Amazing similarity to stock price fluctuations ( if You turn STOCK curves upside down)-and that tells stock price almost all stock price drops are fads.
http://www.physorg.com/news163333282.html
Here is quote from the research:
To investigate how cultural tastes change over time, Berger and Le Mens analyzed thousands of baby names from the past 100 years in France and the US. (Because there is less of an influence of technology or advertising on name choice, baby names provide a way to study how adoption depends on primarily internal factors.) The researchers found a consistent symmetry in the rise and fall of individual names; in other words, the longer it took for a name to become popular, the longer it took for the name to fade out of popularity, and thus the more staying power it had compared to names that quickly rose and fell. The effect was robust, occurring in both countries and across various time windows.
There was a headline once at Bloomberg saying something like, stocks up on consumer confidence. In the first praragraph, the rise in consumer confidence was partly attributable to the rise in stocks.
Then the LEI rises on the two of those….
Just for the record, after two “strong” months, durable goods orders are down 22% y/y.
Good article professor, and something I’ve been thinking about as well. You mention the ISM as a “hard” economic number, but since the index is based on a survey (of around 400 purchasing managers), I think it too is more of a reflection of mood.
Well, I interpret it as a provisional May trough (as I have here before!) and an economy moving sideways at present, looking for some kind of direction.
The sideways part is interesting. It would be great to have a better sense of the nature of the recovery, why we’re going sideways and not up. Why might that happen? Is it normal? What could it presage?
Professor Hamilton, like GWG I’ve been wondering about the ISM and other diffusion indexes.
My question is about the tendency for a reversion to mean, and is there any data on this?
Some of these, like the homebuilders index, are described in a way that would make reversion to mean seem inevitable.
NAHB produces the Housing Market Index (HMI), a weighted, seasonally adjusted statistic derived from ratings for present single-family sales, single-family sales in the next six months and buyers traffic. The first two components are measured on a scale of “good” “fair,” and “poor,” and the last one is measured on a scale of “high,” “average,” and “low.”
http://www.nahb.org/generic.aspx?sectionID=134&genericContentID=529
I know the ISMs are worded as a change from the prior month. But doesn’t it seem likely that the longer and/or more severe a downturn is, the less “bad” things seem that really haven’t changed at all?
I looked to see if I could see any studies on this, but I didn’t see any.
Another green shoot…Durable goods orders released today were up 1.8% month over month…
If you want to be a stick in the mud like JDH, you might point out that despite the 1.8% monthly increase, orders are still down 25% from a year ago.
“These three indicators– stocks, spread, and sentiment– account for 3/4 of the rise in the leading economic index over the last two months.”
Consumer sentiment responds to the stock market (w/ a lag), so really only spread and the stock market were involved.
w.r.t. green shoots and second derivative optimism more generally, any improvements in that second derivative for oft-cited statistics driving the stock run-ups have been so minor relative to the first derivative that it would take years for the latter to become zero, i.e., for the economy to bottom. Bottom-callers have fixated on the sign of the second derivative rather than its size.
How about this for a leading economic indicator:
DIESEL SALES.
I know some shipping has moved to trains, but not this much. Diesel sales are currently at a 4-week average of 3,440 bbl/day. This is down from a peak value of over 4,200 bbl/day (over a 20% decrease) and it continues downward every week.
Jet fuel sales are also down over 15% from their peak. (Airline travel). Inventory levels can still decrease further (especially in housing and automotive–two big ticket items) as the current decrease hasn’t even kept pace with the decrease in sales volume. I’m expecting a flat bottom to this recession, but then I fully admit to not being an expert.
‘…rising consumer sentiment is KEY to a true fundamental recovery.’
Utter econo-nonsense.
If the poster(Hamilton) is indeed a professor(of economics), this is great evidence why a)economics and (nearly all)economists are viewed as useless and useless fools,respectively, and b)higher education has become useless to obtaining actual knowledge-fortunately, the public is growing very tired of the inflated cost of this useless system and is getting closer to demanding that the gravy train of tax dollars be cut off.
Rantly McTirade: The poster you quote calls himself “Michael” and does not purport to be a professor of economics. But don’t let that get in the way of whatever conclusions you wish to draw from his remark.
I agree absolutely with your bottom line. Everything will soon be coming up roses (er, green shoots) if you wear rose-colored glasses.
Thanks for dissecting the report.
To what extent does a premature gain (dead cat bounce) in the stock market slosh around to push LEI indexes directly and indirectly through consumer sentiment? The seven false recoveries of significant size and duration during the Great Depression come to mind. It does make you wonder what a dual set of LEI indexes would say with one based solely on hard industry data and one traditional construction of a blend of market, financial, sentiment, and industry data. Divergence in this two-track index pattern might be different for long recessions (?).
The inclusion of both stock prices and consumer expectations in the index seems to result in double-counting. That said, can you point to any previous recession where the LEI made a noticeable uptick without the recession ending soon afterward? Even if you removed stock prices from the index to eliminate double-counting, the index would still be up.
Very good point on the vendor survey. I was not aware that a reduced pace of deterioration in this measure is actually counted as an improvement in the leading index. That sounds like an error in their methodology.
But I disagree with your conclusion. The main reason the economy is seen to be improving is the newly created money entering the financial sector (= higher stock prices and long/short spreads) and stimulus spending (which together with higher stock prices = higher consumer confidence). But for every action there is an equal and opposite reaction.
I think the improvement in sentiment is real, in the sense that it is somewhat justified.
What we used to experience in Q4 ’08 and Q1 ’09 was a free fall, what we now have is “controlled decent”. I.E. things are still getting worse, but at a diminishing rate.
People were panicing, but now they are “merely depressed” – and this is a huge improvement.
We can now see that we are not coming to the end of the world – it’s “only” a long hard row to hoe