Do current fed funds futures prices signal a belief by market participants that the Fed may begin raising interest rates early next year? My latest
research paper
suggests not.
The expectations hypothesis of the term structure of interest rates posits that an investor could expect to receive the same return from buying a 6-month T-bill as from rolling over two 3-month T-bills. Although this is an appealing hypothesis, it has been consistently rejected by empirical researchers, including Campbell and Shiller (1991), Evans and Lewis (1994), Bekaert, Hodrick and Marshall (1997), and Cochrane and Piazzesi (2005) among many others. What that literature has shown is that when the 6-month yield is higher than the 3-month, on average you’d do better with it than with rolling over the 3-months. Typically the term structure slopes up, and typically you earn a higher return from longer term securities.
In a new paper
coauthored with Hitotsubashi University Professor Tatsuyoshi Okimoto, we show that arbitrage should force the predictable excess returns on bonds of longer maturities to show up as predictable gains from taking the long position in fed funds futures contracts. The average upward slope to the term structure of interest rates should imply an average upward slope to the interest rates associated with fed funds contracts of increasing maturity. One might then want to adjust these futures rates to obtain an unbiased market expectation, as suggested in a recent paper by Piazzesi and Swanson.
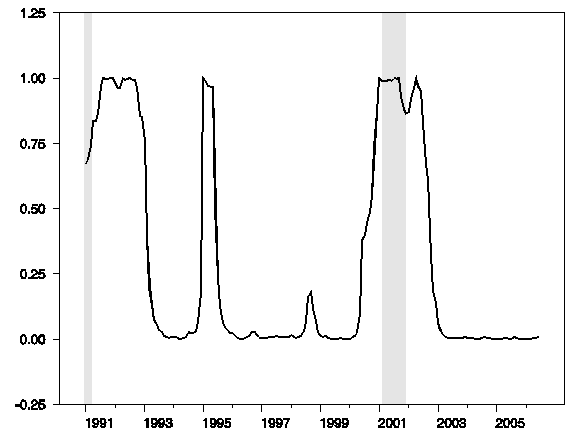
Professor Okimoto and I also investigate the potential predictability of holding gains from long positions in fed funds futures contracts. We find mixed evidence for predictability for the most near-term contracts, but persuasive indications of predictability for contracts beyond 4 months. One of the interesting features we document is that this predictability over the 1991-2006 period appears to be mostly due to a few particular episodes characterized by a weak economy and unusually volatile interest rates. We model returns as shifting in and out of this predictable regime, with our assessment of how likely it is that one could earn an expected profit from taking the long position on a 6-month contract indicated in the graph below. These episodes of predictable gains are characterized by weak employment growth and unusual volatility of interest rates.
 |
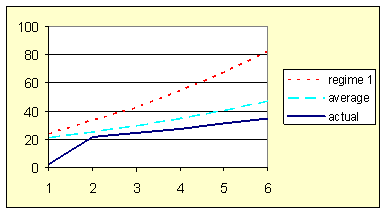
What’s that imply for where things stand at the moment? The monthly fed funds rate averaged between 15 and 22 basis points throughout the first half of this year. The solid line in the figure below plots the interest rates associated with fed funds futures contracts of different maturities as of June 30. These rose steadily to a value of 35 basis points for the December contract. Some analysts had attributed that modest slope to a belief by traders that there was some possibility that the Fed could increase its target before the end of the year, despite statements from Fed officials that seemed to suggest such a change was unlikely.
The graph also provides predictions of what these rates on fed funds futures contracts for that date should have been under two alternative scenarios. The first (shown as a turquoise dashed line) postulates that buyers of these contracts expected the fed funds rate to remain flat through the end of the year at 18 basis points (the realized average over the first half of the year), but that the contracts at that date incorporated the same pricing of interest rate risk as they did on average over the period 1991-2006. Under this scenario, the fed funds futures prices would have shown an even steeper slope than they did at that time.
 |
Conditions in 2009 are clearly outside of the range included in our sample, both in the severity of the economic downturn and in the fact that the fed funds rate had effectively bumped against the zero lower bound, which is why we did not attempt to use the most recent data in our estimation. However, we thought it was interesting to take a look at what the model would imply if we assumed that we’re currently in the weak-economy, high-uncertainty regime, again under the assumption that market participants believe there is going to be no change in the fed funds rate before the end of the year. Under that scenario (the red dotted line above), we could have seen an interest rate as high as 80 basis points for the December contract and still interpret it as consistent with a belief by market participants that the Fed is not going to change its target.
The conclusion we draw from this exercise is that the modest upward slope of the futures curve in the summer of 2009 could easily be accounted for by risk premia in these contracts, and need not be interpreted as a belief by market participants that an increase in the target fed funds rate before the end of 2009 is particularly likely.
“The conclusion we draw from this exercise is that the modest upward slope of the futures curve in the summer of 2009 could easily be accounted for by risk premia in these contracts, and need not be interpreted as a belief by market participants that an increase in the target fed funds rate before the end of 2009 is particularly likely.”
May be it still can be interpreted so.
Funny: Oil prices are dipping as stocks are gaining after job report, at the start of trading on Aug 7. So oil was just a temporary asset to store some money?
Ivars, thanks for pointing that out. The currency markets were also not correlating well with the equity futures. The dollar sold off at first when the jobs data was announced, then rallied considerably. All the while s&p futures stayed pretty flat around the 1002-1005 level. I guess the equity futures are just much easier for the government to lend a “helping hand” to.
With the 9.4% unemployment report WTI oil prices are, I believe, effectively at a post-crash high.
I think the economic news suggests that we are running up the back of the “V”.
This is good news and bad news. The good news: an unexpectedly sharp recovery. The bad news: Our analysis suggests the US falls back into recession above $80 oil, and I think we’ll have a chance to test the hypothesis relatively soon.
Also, the situation in Georgia warrants some attention. It’s worth keeping in mind that there are three possible responses to peak oil, the third of which is war. I cannot help but think the two Russian attack subs off the US east coast; the withdrawal of Russia from WTO negotiations; and renewed tensions with Georgia signal a Russian intent to finish last year’s job and take full control over the BTC pipeline.
Hi, Jturner
Dollar is up, while oil still remains in almost 1%minus even as S&P is at 1010. (10:12 a.m.)
Steve
You think Russian economy is at so bad state they will go for war? As Biden said-something out of ordinary during next 15 years? or just to drive US back in recession?… too ambitious, I think too late as well. The V shape is too strong to stop it now.
I think we might have been on the backside of the V without the stimululs/bailouts, but as it is. We’re on the leg of the L before the I on the next line.
Good conclusion. Futures prices on a given day are just the prices that it takes to clear the market of buyers and sellers on that day. Traders have expectations about the term structure in the future, but they have many other factors affecting them as well. The average buyer and seller of futures contracts can’t forecast future interest rate structure any better than anyone else. If they could, all average traders would become fantastically rich. When you hear someone forecasting the direction of interest rates from futures contracts, you are hearing a Wall Street sales pitch, or someone influenced by it. The same can be said of people who forecast the stock market from the direction of futures contracts for the S&P500.
One may be dwarfed to modesty when trying to predict interest rates or yield curve and trying to understand what are all these interest rates derivatives for?
After all the world GDP is only 50 billion usd. The interest rates components are up and growing among 5 large banks (a very large pool for a very few)and the short duration the most heavily traded.
http://www.occ.treas.gov/ftp/release/2009-72a.pdf
$ in billions
Q1 ’09 Q4 ’08 l
Derivatives
Interest Rate Contracts 169,373 164,404
How long theoretical interest rates may coexist with natural demand and supply?
I don’t know if this analysis is of much value, the graphic is nice:
About 100% prediction or 0% but the timeline stops in 2007.
How about today? How about China dumping the long curve picking up the shorter one?
I am not convinced about old data dating back to the housing boom, sorry!
In the mid ’90s, I was told the rule of thumb was 2 basis points per month for the risk premium, which seems pretty close to the average line in the chart.
One potential issue is ex ante vs ex post: both ’91-’93 and ’01-’03 were characterized by exceptionally low fed funds rates (in the early 90s, to deal with banking crisis; in 2001-2003. first in response to 9-11 and later to fight the phantom deflation threat). There might be some ex anti expectation errors that are captured as risk premia in the study.