Things look slightly cheerier than they did a month ago. But that’s not saying much.
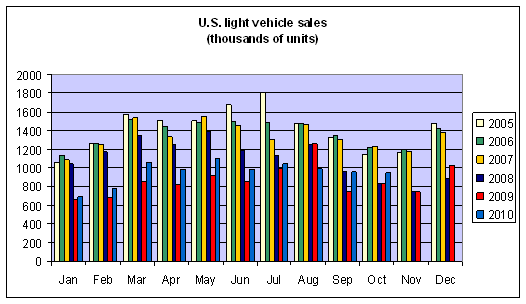
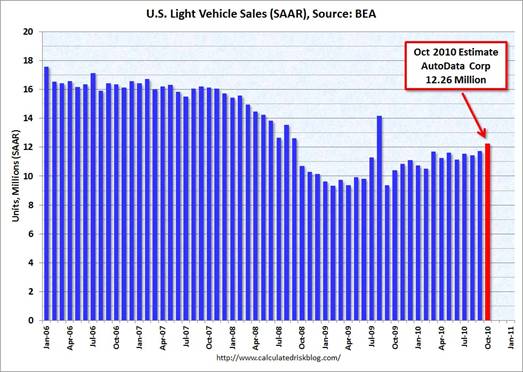
U.S. auto sales for October were up 13% from a year ago, and about the same level as September.
 |
You might take that as reasonably good news, since October’s usually a bit softer than September. Seasonally adjusted auto sales seem to have been edging modestly higher for a while now, and motor vehicles production contributed 0.42 percentage points to the nation’s 2.0% Q3 real GDP growth rate (see BEA Table 1.2.2).
 |
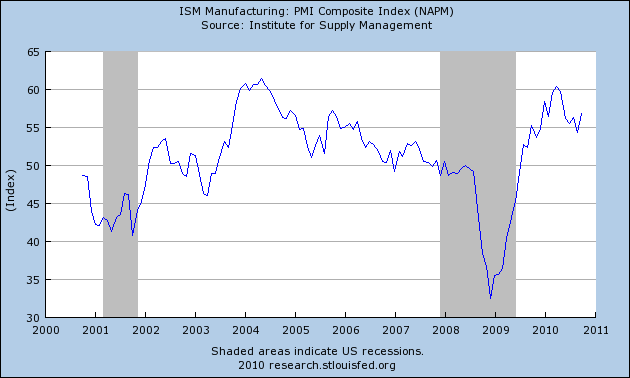
The ISM manufacturing PMI climbed to 56.9 for October. Any reading above 50 signifies improving conditions, and all year long this index has been suggesting good gains for manufacturing. ISM nonmanufacturing PMI was also up.
 |
Marcelle Chauvet’s recession indicator index, which had spiked up to 25% last month, is now back down to a more comforting 12%.
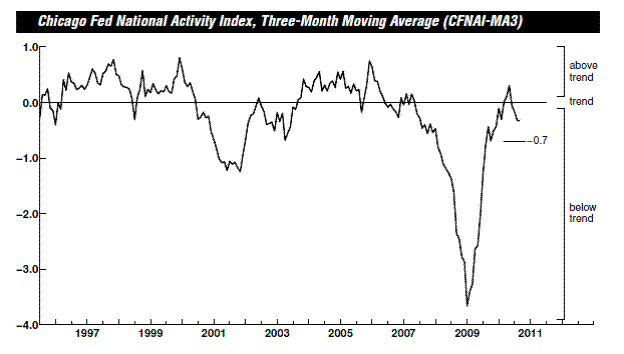
But before you start to party, remember that the Chicago Fed National Activity Index is another pretty good indicator of broader economic conditions. Its 3-month average for September came in at -0.33, suggesting that overall growth remains weak.
 |
The Bureau of Labor Statistics reported on Friday that nonfarm payroll employment increased by 151,000 workers on a seasonally adjusted basis in October. That’s so much better than what we’ve been seeing that, like the first 20oF day after a tough winter, it makes me want to cheer. But on the other hand (you knew there’d be another hand, didn’t you?) it’s still way below what we need in order to make any progress on the unemployment rate. And separate measures were less sanguine. Payrolls processed by ADP only implied a seasonally adjusted gain of 43,000 private-sector jobs for October, while civilian employment according to the volatile BLS survey of households was down 330,000 for October.
Overall, I continue to see an economy that is growing, perhaps by a little more than suggested by last month’s numbers. But the slowness of that growth continues to be disappointing.
May I suggest reading the IMF report on world economic outlook October 2010
A precarious picture of the balance of the world economies where:
Internal balances are required and private sector (solvent private sector) should take over a larger share of the actual governments expenditures and consumption.Fiscal consolidation being then, made available (when reading the last ECB October monthly bulletin the pace towards such transition was far from granted)
External balancing, where current accounts deficits are expected to be driven towards balance through a larger contribution of export.
The same review, does recall an additional element of uncertainty with the public sector debts.The IMF world growth forecast is hovering around 4.2 % decreased from the last July projection by a negative factor.
One has to assume that the laws of the averages (see Econbrowser post ‘”A Post-Mortem on the Fall and Rise in World Trade”) will enable the world growth forecast to be above the 4% (recession). Meanwhile OECD leading indicators are not exuberant either, as they show picks.
OECD LEI October 2011
http://www.oecd.org/dataoecd/3/25/46165757.pdf
Consistent views from all parties.
A 20 F degree day in San Diego???
And just because econ blogs always need another Debbie Downer to spoil the party, the jobs report puts the Fed’s QE2 actions in a somewhat less advantageous light. Doesn’t this tick up the risk factor just a bit? If the economy were totally in the dumper, then the risk trade-off would be a no brainer. But with signs of life, however faint, it makes me a little more concerned about the Fed’s ability to withdraw the QE2 stimulus in time. I still see QE2 as worth the risk and it seems to me that the most likely result is “not much”…still, there is a bit more risk than there was last week.
Yeah, that brutal winter weather in San Diego. When the winter winds are howling down the canyons of Wall Street, I’ll think, “At least I’m not toughing it out in San Diego. My God, it could be 60 degrees there.”
I’m with 2slugs on QE2. Talk a big game, but play for time. Oil’s at $87, that should be saying something (other than Al Naimi wants to do us under).
The mood in New York is almost back to normal. Restaurants are pretty full; so are the trains; getting a parking spot at the train station is becoming a blood sport in Princeton again. Given the grief we’re getting from Germany, Brazil and China over QE2, maybe a little more wait-and-see?
Thanks for the post.
36 months to go, then real, long term sustainable growth. Why? Same answer as B4, the American middle class is paying down its bar tab! Only 36 more installment payments to go! Man what a hangover this has been!
In a weak growth economy the monthly data will be very inconsistent. What we will get is a month or two or bad data that makes it look like the economy is rolling over and for no apparent reason we will get a month or two of strong data that implies the economy is strengthening.
Do not get carried away by a single months observations.
Look at real final sales less gov’t spending, including transfers.
Then adjust real M2 and M3 for the incremental effects of debt-money supply from the increase of the net gov’t savings (deficit) and the monetary base (growth of Fed fiat digital book entry debt-money, set to grow at 100%+ annualized by Q2 ’11), apply a regression analysis of the first difference between adjusted M2 and M3 to real final sales less gov’t, and one clearly sees that adjusted real M2 and M3 is highly correlated to real final sales and GDP, and the underlying private sector growth of the US economy is virtually non-existent and highly vulnerable to a deceleration of growth (or contraction in ’11) of inventories (tightly coupled to imports from US firms’ production in China-Asia) and net incremental growth of gov’t spending/transfers.
Despite our desire to see positive signs of a recovery and expansion of private sector economic activity, it is not happening. In fact, the dreaded “it”, i.e., Japan II and the late 1830s, 1890s, and late 1930s, is happening, despite Bernanke, Wall St., politicians, and the financial media trying to persuade us to the contrary.
To prove the point further, compare the post-’90 and post-’00 real final sales less gov’t trend rates between Japan and the US, and you will find that the US is tracking remarkably closely to the rate of decelerating post-secular peak real growth of Japan up to ’99-’00. Should the pattern persist for the US, we will experience no faster than 0.6-0.7% average real trend final sales and GDP over the course of the next 2-3 to 6-9 years (approximately no faster than the population/labor force growth rate), with at least two cyclical contractions of 4-6% and large bear markets of 40-65% occurring during the period.
Keynesian deficit spending and central bank monetization with massive private and growing public debt will only facilitate the process of the US arriving at where Japan, Spain, Greece, Ireland, Italy, and Portugal are today.
So, back to same old, same old – recovery brings a bigger trade deficit, more vehicle sales, more restaurant meals, more miles driven per capita – too bad we can’t use the opportunity to alter ugly consumption habits.