Looking a little better each day.
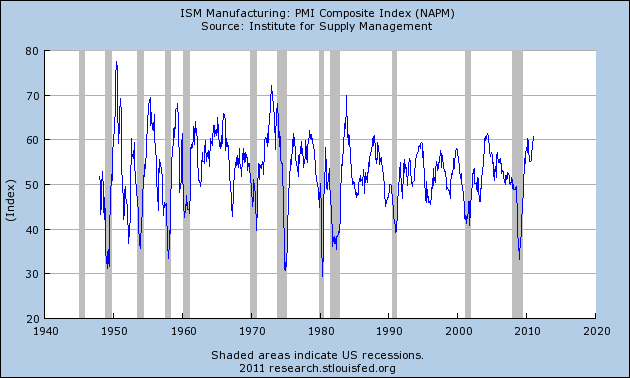
Let’s start with Tuesday’s manufacturing ISM survey of plant managers. A value above 50 signifies that more responders reported improving conditions than reported deterioration. The January reading of 60.8 is the highest we’ve seen since 2004, and is the sort of number we might see if real GDP were growing at a 6% annual rate.
|
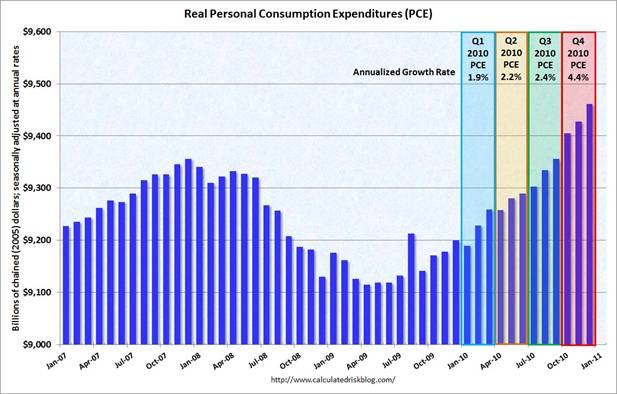
On Monday the BEA released December details for income and consumption. Personal consumption expenditures have been growing strongly quarter-to-quarter and month-to-month within each quarter.
|
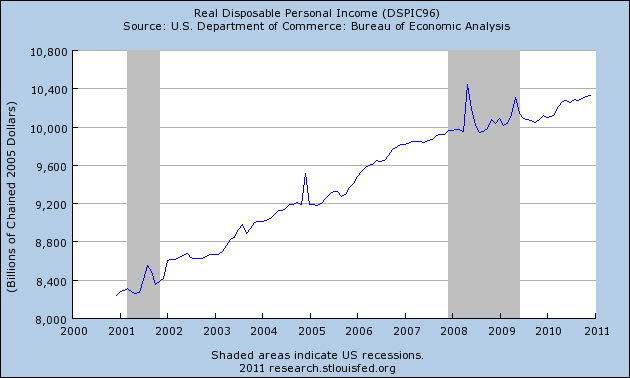
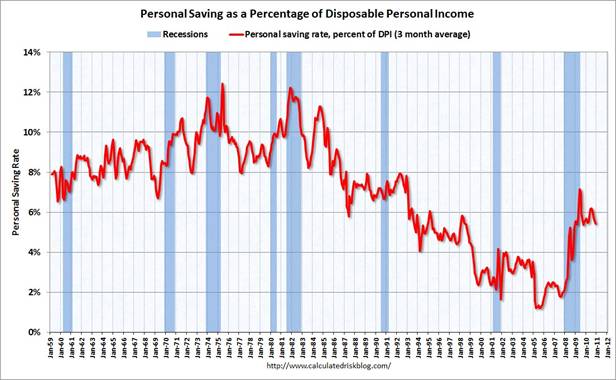
Earlier in the decade consumption spending was sustained by home equity withdrawals and very low saving rates. Trying to work out from under those debt burdens has been a key factor holding us back over the last three years. My hope had been that, with disposable personal income back to growing on track, we could see parallel growth in consumption spending while maintaining a decent saving rate.
|
|
Consumer spending now seems to be growing a little faster than income, and I’d be more convinced we’re on a sustainable path if the key driver of growth was coming from investment and net exports.
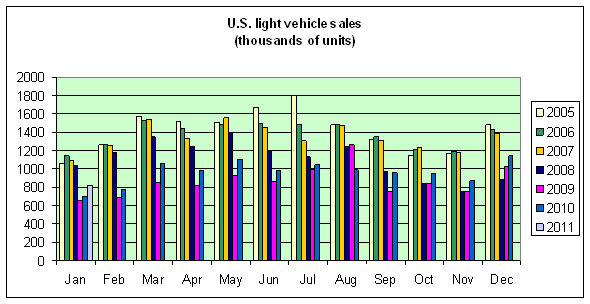
Light vehicle sales continue to experience steady moderate gains. The number of light vehicles sold in the United States in January was up 17.2% from the year before, though we’re still short of halfway back up from the low point reached in 2009.
 |
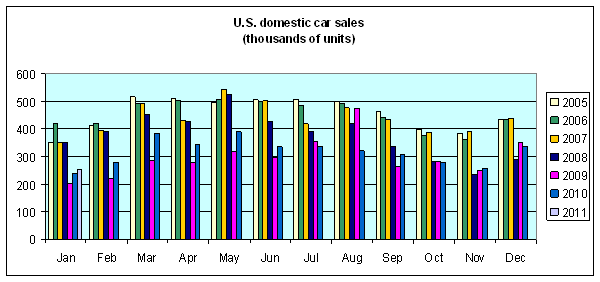
Motor vehicles and parts alone contributed 0.9 percentage points to the fourth-quarter real GDP annual growth rate of 3.2%, perhaps a little surprising since the gains in the number of light vehicles sold is more modest. But there’s also been a shift in the composition of vehicles sold, with the more expensive light truck and SUV category making a comeback. Sales of domestically manufactured cars were up 7.7% from the previous year, while light trucks and SUVs were up 28.1%.
 |
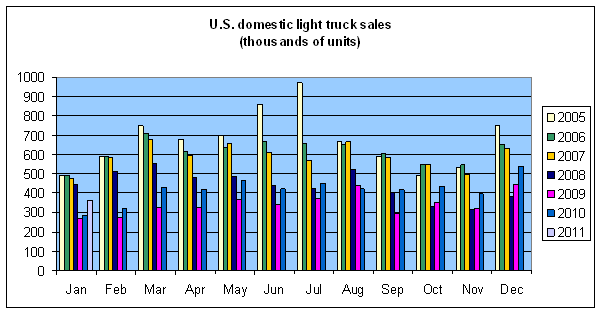 |
That fact also becomes relevant when we consider the possible macroeconomic implications of recent oil price increases. As long as $4/gallon gasoline had been recent enough in people’s memories, car buyers remained wary of the gas guzzlers, and increases in gasoline prices from the levels we’d been seeing last year did not have the potential to significantly disrupt spending patterns or shock consumers.
But the gasoline price spike of the summer of 2008 is now almost 3 years behind us. And I’m guessing that by now there may be some shock potential of ongoing geopolitical turmoil in the Middle East.
Nice charts and obviously carrying higher expectations.
One week ago,the Aruoba Diebold Scotti index as maintained by the Federal reserve bank of Philadelphia, was showing a more mitigated picture.The index is still recording a tepid business environment.
Econbrowser post included the author’s correlation study,past and revised figures.
http://www.philadelphiafed.org/research-and-data/real-time-center/business-conditions-index/
Regarding your last point on the effect of the instability in the middle east on the oil market, the latest issue of the Economist quotes some of your work as follows “a ten-cent rise in petrol prices is associated with half-point drop in consumer confidence”. I am guessing that some of the recent gains in consumer confidence could be quickly lost.
You showed a chart of real disposable personal income growth going back to 2000 and claimed that it is now back on track. I strongly disagree.
If 2000 is the starting point for determining success then we are in big trouble.
I offer a chart showing real disposable personal income growth going back to 1959. I’ve adjusted it for population growth and have included an exponential trend line. We are definitely not back on track.
http://illusionofprosperity.blogspot.com/2011/02/real-disposable-personal-income-per.html
“Earlier in the decade consumption spending was sustained by home equity withdrawals and very low saving rates. Trying to work out from under those debt burdens has been a key factor holding us back over the last three years.”
Will it someday be written that later in the decade consumption spending was sustained by gov’t debt? And, trying to work out from under those debt burdens has been a key factor holding us back over the last many years? In both cases, will too much debt be the problem instead of a solution?
“My hope had been that, with disposable personal income back to growing on track, we could see parallel growth in consumption spending while maintaining a decent saving rate.”
I’d rather see some consumption growth with a rising savings rate from people paying down debt. Of course, that would require real earnings growth, something corporate america is against because they want all the productivity gains and others for themselves and the shareholders. The workers are nothing more than an expense to be minimized. One exception is banker pay.
Here is one other thing. Is all or almost all of the “savings” being done by people making over $200,000 a year?
“But there’s also been a shift in the composition of vehicles sold, with the more expensive light truck and SUV category making a comeback. Sales of domestically manufactured cars were up 7.7% from the previous year, while light trucks and SUVs were up 28.1%.”
So how much debt is being created here? As a matter of fact, why should all new medium of exchange be demand deposits created from debt?
Stagflationary Mark, I think including wealth/income inequality and transfer payments in your chart would help, but I get your point. The problem is the fed and bankers associate wage increases for workers with price inflation and the possibility that workers might be able to retire earlier.
Things are looking a tiny bit less worse everyday.
Truck sales are a good sign. Productive capital investment rather than vehicles for shutting around useless paper pushes.
Get Rid of the Fed,
I hear you on wealth/income inequality and why it matters.
http://illusionofprosperity.blogspot.com/2007/09/automation-and-inequality.html
http://illusionofprosperity.blogspot.com/2009/11/why-income-inequality-really-matters.html
Stagflationary Mark, here is the kind of “stuff” a lot of people are up against with macroeconomists who don’t get the idea of budgeting and microeconomics applying to macroeconomics, especially things like ceo pay and banker pay.
http://worthwhile.typepad.com/worthwhile_canadian_initi/2011/01/inequality-and-debt-the-soft-bigotry-of-low-expectations.html
From it: “Sure, the poor really need to consume today. But they really need to consume tomorrow too. So their need to save is as strong as the rich.”
No concept of budget. Just because they need to save does not mean they can from a budget standpoint. They could be suffering negative real earnings growth because of an oversupplied labor market and a central bank with a positive price inflation target.
From: http://illusionofprosperity.blogspot.com/2009/11/why-income-inequality-really-matters.html
“The Federal Open Market Committee (FOMC) headed by Fed chairman Ben Bernanke likely will stay its highly accommodative course to help get credit, the lifeblood of the economy, flowing as the recovery progresses in fits and starts, analysts said.”
Is credit/debt ONLY the lifeblood of an economy because bankers have set it up that way so that all NEW medium of exchange is the demand deposits created from debt?
What would happen to the amount of medium of exchange if no new debt, whether gov’t or private, was created in a year? How would that affect an economy with positive productivity growth and increasing output?
“That brings me to another point. We clearly “need” more banks under situation #1 than we do under situation #2. That’s what we are told anyway. We “need” lots and lots of banks. In fact, the more banks we have the more prosperous we become.”
It’s not the number of banks. It’s the amount of debt. IMO, macroeconomists make the mistake of believing that as long as price inflation (an argument can made it is really wage inflation) does NOT occur, the more debt the better.
From: http://illusionofprosperity.blogspot.com/2007/09/automation-and-inequality.html
“The extrapolator in me has always wondered what would happen if we could automate all of our jobs away. Now I think I might know. As it relates to farm labor, wages are simply redistributed. The total amount of real wages (wages adjusted by the CPI) has held fairly constant over the years. If you are lucky enough to keep your job, you’ll be worth more. You’ll be happy. If you aren’t, well, sorry about that.”
I believe you are assuming that the other workers either retire or go get another job. If they can’t do either of those, will they say I will work for less than what you are paying your workers currently meaning the wages get redistributed to the owner/producer?
“If one was to keep extrapolating this trend to its logical conclusion, at some point there will be just one farmer. He’ll have all the wages and will simply press the “harvest” button on his desk.”
Have you ever heard of Michael Hudson and his ideas on neofeudalism?
Get Rid of the Fed,
“No concept of budget. Just because they need to save does not mean they can from a budget standpoint.”
I hear that. I get that same feeling every time I hear that someone “needs” to make money in the markets (especially pension funds).
“I believe you are assuming that the other workers either retire or go get another job.”
I’m not. I assume that we would be in big trouble. Sigh.
“Have you ever heard of Michael Hudson and his ideas on neofeudalism?”
I haven’t. I just read a description of both in wikipedia and tend to agree with most of the points though.
Here’s one particular quote.
“He states parasitic finance looks at industry and labor to determine how much wealth it can extract by fees, interest, and tax breaks, rather than providing needed capital to increase production and efficiency.”
I’m a believer.
JDH: Why does real personal disposable income seem to spike twice in the last recession and once in the previous recession?
Stagflationary Mark, keep checking back. I’ll try to post some others if I can.
Mark, why would you assume exponential growth of disposable income is reasonable? Being “on track” in my mind would mean that real disposable income would be stable while becoming more sustainable. Over the past two decades, disposable income has grown in unsustainable ways (credit boosting income and globalization pushing inflation of tradeable goods [for instance not housing, healthcare or education] down).
In reality, I think the west can hardly even hope for stability in its standard of living. We know that we can’t lift the entire world up to our level, so unless we find a way to keep the rest of the world poor, we will have to accept lower living standards for ourselves.
There is NO better each day until there is a day where is government through geometric increases in debt isn’t minipulating final demand. Until it is organic growth the numbers are meaningless…only to fall back after the government stops printing…….and then starts printing again…….ie Japan.
JDH,
Would you care to comment on this article
http://www.pimco.com/Pages/Devils-Bargain.aspx ?
westslope: I believe the spikes are stimulative tax cuts.
Jeremy and others: I agree entirely that financial markets grossly misallocated capital in the early part of this decade. And I also strongly believe that the bulge in mortgage debt relative to GDP was unsustainable and a main cause of our current problems. Where I perhaps take a different view from some in this camp is that I believe deflation exacerbates our current problems, and that it is the Fed’s current responsibility to avoid deflation.
The word that comes to mind is: unsustainable
1. ISM Manufacturing is at 60. It never hovers at that level and seldom goes over 65. So we may have a few more months of increasing activity, and then it will reverse. 2. The PCE consumer spending growth rate is higher than the growth rate in disposable income, hence spending cannot continue to grow at recent rates. 3. The household savings rate is declining at the same time home prices are declining. We know from recent events that families will increase savings as home prices continue to drop when the spring selling season brings out a greater glut.
Enjoy while one can. The tough decisions about bank insolvency, government debt (at all levels), and the Fed’s proper role have not yet been made. When they are, we will then see sustainable growth.
endorendil,
“Mark, why would you assume exponential growth of disposable income is reasonable?”
That’s what causes our standard of living to improve. If disposable income adjusted for inflation does not grow then our standard of living is not getting better.
If your standard of living increases by a fixed percentage each and every year, then that growth is exponential. That’s why I plotted the long-term exponential trend.
That said, many exponential trends have broken in recent years. Many of them were completely unsustainable. Here are two in particular.
This first chart shows the mess our pension funds are in.
http://illusionofprosperity.blogspot.com/2010/09/pension-fund-hell.html
Ben Bernanke claims that credit is the life blood of our economy. Here’s a chart of how it is doing.
http://illusionofprosperity.blogspot.com/2010/03/bad-things-musical-tribute.html
And lastly, all exponential growth trends must end at some point. In that sense I agree with you.
http://illusionofprosperity.blogspot.com/2007/09/exponential-growth-and-immortality.html
Stagflationary Mark, here is another link.
Inequality, leverage and crises
http://www.voxeu.org/index.php?q=node/6075
Stagflationary Mark, here are some others.
http://www.itulip.com/forums/showthread.php/891-Saving-Asset-Price-Inflation-and-Debt-Induced-Deflation?p=6738
http://www.itulip.com/forums/showthread.php/1283-Fisher-Keynes-Minsky-and-Keen-on-Bubbles-in-Everything-and-Debt-Deflation
http://www.itulip.com/forums/showthread.php/3631-Interview-with-Dr.-Steven-Keen-the-Future-of-Debt-Deflation
http://www.doctorhousingbubble.com/financial-overlords-the-debt-class-and-those-that-provide-the-debt-in-serfdom-understanding-the-new-structure-of-the-american-financial/
from http://www.zerohedge.com
“Courtesy of today’s full year revision announced by the BLS, and a granular sort by John Poehling, we have discovered that while revisions added a whopping 55k jobs in the years 2006-2008, NFPs have now been revised to remove 538k jobs in the 2009-2010 period. In other words, based on data revisions, under President Obama, America has suddenly created over half a million jobs less (even if all of them are part time) simply due to statistical adjustments. We won’t even go into analyzing just how much worse the S&P would be trading if all those monthly “upside” NFP reports had reflected true and not completely fudged numbers. At an average 22.4K downward monthly revision for every single monthly NFP report in the past two years, we are 100% confident that not even Iosif Vissarionovich Bernanke would be able to offset the market plunge that would ensue each and every of the past 24 months… if fundamentals were ever to be remotely meaningful again, of course. ”
In normal statistical measurments, mistakes tend to happen to both directions of the reported results. In the USA monthly non-farm payrolls reports, the statistically improbable shift has always happened in one direction, to overstate the numbers of jobs added.