The Organization of Petroleum Exporting Countries (OPEC) today announced that its members could not reach an agreement to change OPEC’s production quotas. How significant is that announcement? In my opinion, not very.
Forbes provides these details:
Analysts thought the 12-member group would boost production in an effort to cool off oil prices and take some pressure off the world economy…. Instead of raising production the Organization of Petroleum Exporting Countries ended a contentious meeting in Vienna without changing quotas for its members.
“We are unable to reach consensus to … raise our production,” OPEC Secretary General Abdullah Al-Badri said.
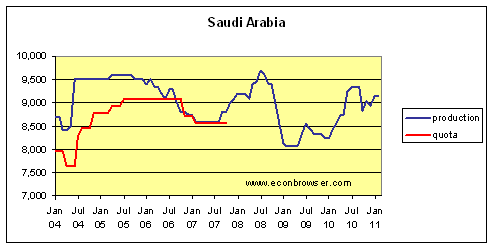
If OPEC were functioning as a traditional cartel, what would emerge from these meetings would be agreements on production quotas to which each country was going to adhere. But this is clearly not the case. Here, for example, is a graph of the OPEC production allocations for Saudi Arabia compared with how much the country actually produced. There was a brief period in 2006 and 2007 when the two series corresponded, though I believe the reason is that the Saudis wanted to use the cuts in announced OPEC quotas as cover for a production cut that they were intending to implement for other reasons. Perhaps they were unable to maintain production at the time, or perhaps they were unwilling. But in no sense was Saudi Arabia induced to cut production by the other oil-producing countries. Before and since that episode, the kingdom has pretty much ignored OPEC’s production allocations.
 |
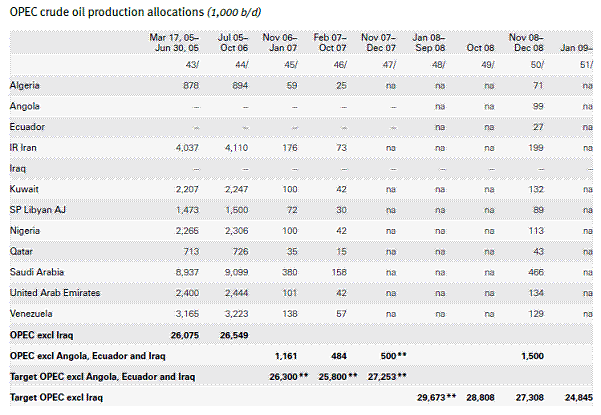
Note that the line in the above graph labeled “quota” ends in October, 2007, because that is the last date for which OPEC publicized individual country production allocations. In fact, what OPEC announced in October and December 2006 were cuts in the allocations relative to an unspecified base; the graph above indicated these as relative to the previous quota. Here’s what the actual data reported by OPEC look like:
 |
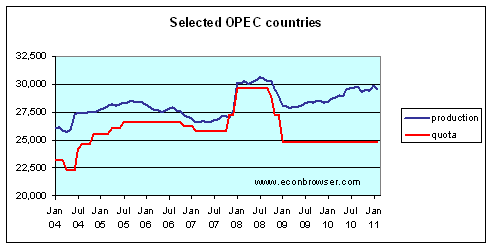
Beginning in November 2007, OPEC did not even publish quotas as target changes for individual countries, but instead simply announced overall targets for the entire group. These combined OPEC targets are graphed below, along with actual production. Again, the quotas have little or no bearing on what actually happened. Note that the group of countries covered in these series was expanded to include Angola and Ecuador in January, 2008. As far as I can determine, the official quota of 24.845 mb/d set in January 2009 is still in effect, though OPEC excluding Iraq is now producing almost 5 million barrels per day more than that.
 |
For these reasons, I think today’s announcement that this “quota” will remain in effect is largely irrelevant. At best the statements issued from these meetings provide a noisy signal of the intentions of some OPEC members.
But if you’re interested in what OPEC members really plan to produce, my view is that actions speak louder than words.
I agree entirely.
Interesting article from Platts about Eagle Ford (Texas) shale oil crude being too light and sweet for Gulf Coast refineries, so it might be exported. Kind of a reverse Libya.
http://www.platts.com/weblog/oilblog/2011/06/08/eagle_ford_crud.html
I’m surprised it can’t simply be mixed with other oil. If so, it would be worth it to reduce transportation costs. Of course, empty ships leaving the US might make shipping cheap.
Greats charts JDH! Compelling.
OPEC has little to no discipline or credibility yet so many North Americans pundits and apparently oil traders accord OPEC substantial influence. This despite the important role oil shocks play in catalyzing recessions. In those events, OPEC clearly lost control over oil prices.
Pumping up OPEC’s abilities appears to suit a number of special-interest agendas. Otherwise I suspect that many market participants take various signals from OPEC at face value without studying the question further
.
I think that the key point is the rapid increase in OPEC and total Global Net Exports (GNE) from 2002 to 2005, versus flat to declining GNE from 2005 to 2010.
So did OPEC and other oil exporting countries choose to put oil importing countries on the post-2005 supply/demand/price roller coaster, or did they have no choice?
They clearly chose to dramatically increase net oil exports from 2002 to 2005, in response to rising annual oil prices, but if they chose to restrict net oil exports after 2005, in response to generally rising annual oil prices (relative to 2005), why did they choose to put the oil importing countries on the post-2005 supply/demand/price roller coaster?
Here is what we show for global net oil exports* (GNE) from 2002 to 2009:
2002: 39 mbpd
2003: 42
2004: 45
2005: 46
From 2002 to 2005, GNE increased at about 5%/year. At this rate of increase, GNE would be at about 59 mbpd in 2010, but that is not what happened.
2006: 46
2007: 45
2008: 45
2009: 43
2010: 44**
*Net oil exporters with 100,000 bpd or more of net oil exports in 2005 (BP + Minor EIA data)
**Estimated
Note that 2006 to 2010 annual oil prices all exceeded the $57 (US spot) level that we saw in 2005, and four of the past five years have shown year over year increases in annual oil prices.
In my opinion, there is a simple explanation: Peaks Happen.
Peaks happen, but they seem to never be where, and at the time when they should be.
ECB statistical data
Please, Go to external trade in goods,select Petroleum, petroleum products and related materials (SITC 33)
Dataset name External Trade
Frequency Monthly
Reference area Euro area 17 (fixed composition)
Adjustment indicator Working day and seasonally adjusted
External trade flow Import
Product breakdown -TRD context Petroleum, petroleum products and related materials (SITC 33)
http://sdw.ecb.europa.eu/browseChart.do?TRD_PRODUCT=OIL&node=2018791&sfl4=4&sfl3=3&DATASET=0&SERIES_KEY=133.TRD.M.I6.Y.M.OIL.J6.4.VAL
Historically, the oil market was bedevilled by a tendency to overproduce. Prices would fall below production costs. The industry needed a pricefloor and it got it first through the Rockefeller monopoly and then via the Texas Railway Commission. With the peaking of US oil production in 1971 (and the end of Texas’ role as swing producer), the maintenance of a floor price became the duty of OPEC.
Now that world oil production has peaked (and is declining on a net energy basis), a constructed price floor is no longer needed and OPEC has lost its raison d’etre.
While policy can marginally affect the rate at which supply declines (e.g. pipelines to and from the tar pits), only falling demand can constrain the price of oil. But not even a group of relatively influential nations can hope to have much influence on global demand.
What is left for individual governments (at all levels) are actions which reduce the impact (cost) of high oil prices on their particular sub-economy.
Markets will try to shift oil consumption to its most productive use. Governments should aggessively support these shifts: transport electrification in order to maintain the advantages of large, efficiently functioning labour markets is perhaps the most immediately important policy goal; policies which facilitate individual efforts to fill empty vehicle passenger seats would also help.
BP is out with their 2011 energy report (which has annual data through 2010).
Rounding off to two significant figures, BP shows the following for global total petroleum liquids:
2005: 81 mbpd
2006: 82
2007: 82
2008: 82
2009: 80
2010: 82
2005 is just barely shy of rounding up to 82. At the 2002 to 2005 rate of increase, we would have been at about 94 mbpd in 2010, which would have been consistent with CERA, et al’s projections.
Saudi net oil exports came in lower than what I expected, based on the rather odd recent EIA revisions. Following is what BP shows for Saudi net oil exports for 2005 to 2010 (2009 and earlier data may been revised; I haven’t checked yet).
Saudi Net Oil Exports (BP):
2005: 9.1 mbpd
2006: 8.8
2007: 8.2
2008: 8.5
2009; 7.1
2010: 7.2
Interesting that Saudi 2010 net oil exports were just barely above the 2009 rate. Most of the 2010 increase in Saudi oil production was offset by increased domestic consumption.
Here is the cumulative shortfall between what the Saudis would have net exported at their 2005 rate of 9.1 mbpd and what they actually net exported (BP):
2006: 110 mb
2007: 439
2008: 658
2009: 1,388
2010: 2,082
here is why you could be wrong, not much to do with economics
the Gulf Arabs were just given a massive slap in the face by iran irag venezuela etc.
the gulf arabs have the only discretion with their excess supply
Saudi and the others have several times flooded the market partly as a disciplinary measure when the others wuold not listen to their– prices getting too high– arguments
Re: AWH
When the Texas Railroad Commission went to a 100% allowable in 1972, it could still order future production cuts, but Texas production has been declining, relative to its 1972 production rate, for 38 years.
My premise is that Saudi Arabia, in 2005, was at about the same stage of depletion at which Texas, the prior swing producer, was at in 1972.
Annual oil prices have exceeded the 2005 annual rate for five straight years (probably six straight years counting 2011), with four of the past five years showing year over year increases in annual oil prices, but Saudi production, and more importantly net oil exports, have been below their 2005 annual rate for five straight years. This production/price response is quite similar to what we saw in Texas in the Seventies.
As noted up the thread, despite widespread belief that Saudi Arabia has magical oil fields that don’t deplete, the fact remains that Peaks Happen.
The Gulf countries were asking for a 1.5 mb/d increase over actual production of 28+ mb/d, not a 1.5 mb/d increase over the last stated quota. They were shot down, but that may not matter if Saudi Arabia produces more, as they promise.
Still, the problem of Libyan production would not be solved by more Gulf production, because they do not have additional capacity of sweet light crude, which is what is missing with the Libyan shut out.
so jeff
Do saudi and gulf now have extra pumpable, stored to sell, or ability to sell more forward?
or not?
I agree with much of the statements you do in this script, but you should also note that the greater the quota, the greater the actual production, so, it doesn’t matter if the quota is accomplished or not…in fact, I guess that anyone knows that normally they don’t do (there are even countries that do not participate in the quota). In any case I think that this week facts are relevant just looking at its effect in the agents expectations, unfortunatelly this market is too especulative.
“the Gulf Arabs were just given a massive slap in the face by iran irag venezuela etc.” – AWH
A massive slap in the face? How so?
Re: AWH
I suspect that most of what passes for “Excess Capacity” in the Middle East consists of what Matt Simmons called “Oil stained brine,” i.e., very high water cut oil production.
The bottom line is that the Saudis showed a huge increase in net oil exports, from 2002 to 2005, in response to rising oil prices, but as noted above, from 2005 on, in response to generally rising annual oil prices, their net oil exports have fallen.
As also noted above, the simple explanation is that Peaks Happen. And when production peaks in an oil exporting country, the post-peak net export decline is far different from the production decline rate. For more info, do a Google Search for: Peak Oil Versus Peak Exports.
Jeffrey J. Brown: I know it sounds counter-intuitive but a healthy water drive can be useful in extracting heavy oil. The composition and nature of the deep brine can vary and affect recycling costs.
AWH: If you were to review the history of the internal politics of OPEC that you would find Iran and Venezuela’s policy stances to be “business as usual”.
In any event, the future energy security and quality of life of the USA lie in the hands of American citizens not member countries of OPEC despite the partisan political incentives to continuously finger-point Arab-dominated OPEC.
With nation states dominating oil production, I wouldn’t rule out the possibility that aggressive north american extraction could bring prices down.
Russia has improved operations greatly since the 90’s. But I think the 90’s description of former soviet oil along with Greenspan’s characterization of operations in Venezuela paint a good picture of the oil industry. Even the tiniest bit of real competition could spur on better production around the world.
The simple acknowledgment by the US that oil prices can’t stay high for ever, and clear commitment to exploration and production would give those who seem to largely rely on rising prices pause.
Re: Aaron
Following is an excerpt from the linked article:
Peak oil versus peak exports:
http://www.energybulletin.net/stories/2010-10-18/peak-oil-versus-peak-exports
Figure One shows the 1972 Texas oil production peak lined up with the 1999 North Sea oil production peak (crude + condensate in both cases). These two regions were developed by private companies, using the best available technology, with virtually no restrictions on drilling, yet both regions show clearly defined production peaks. Furthermore, the initial declines in both cases corresponded to sharply rising oil prices. These two examples, which jointly accounted for about 9% of global cumulative crude oil production through 2005, show that, contrary to conventional wisdom, Peaks Happen, even in the best of circumstances.
Jeffery, I was suggesting that most producers expect higher prices to boost profits regardless of efficiency and discovery. In fact, they efficiency and discovery work against them.
The north sea is the exception that proves the rule, they are a developed economy that happens to also produce. They can be expected to optimize production regardless of price, others not so much. Greenspan’s characterization of Venezuela is probably a lot more representative of the market.
I’m not suggesting higher prices will increase production, I’m suggesting the opposite.
My point is that once conventional production peaks in a region, in the absence of political factors, there is probably not an oil price, at least not a realistic oil price, that will keep conventional production on an upward slope.
And I think that there is only an incremental difference, and not a material difference, between the ability of national oil companies and private major oil companies to find and produce oil–for the simple reason that companies tend to find the biggest fields first.
Based on the quantitative logistic models, global conventional crude oil production in 2005 was at about the same stage of depletion at which the North Sea peaked in 1999. In my opinion, global total crude oil production has stayed approximately flat only because of slowly rising unconventional production.
Following are what we show for Global Net Exports (GNE), using the updated data, with revisions, through 2010:
Global Net Export Data*
2002: 39.1 mbpd
2003: 41.6
2004: 44.8
2005: 45.5
2006: 45.5
2007: 44.6
2008: 44.5
2009: 42.3
2010: 42.6
*33 net exporters with 100,000 bpd or more of net exports in 2005, BP + Minor EIA data
Saudi net oil exports were down from 7.3 mbpd in 2009 to 7.2 in 2010. Note that Russian net exports have been at or below 7.1 mbpd since 2007. The (2005) top five went from 23.7 mbpd in 2005 to 20.8 in 2010. So, the (2005) top five fell by about three mbpd over a five year period, while the bottom 28 showed basically no change from 2005 to 2010.
Chindia’s combined net oil imports went from 5.1 mbpd in 2005 to 7.5 mbpd (inclusive of the rather curious increase in reported Chinese production). In any case, their combined net oil imports, as a percentage of GNE, went from 11.2% in 2005 to 17.6% in 2010.
So Available Net Exports (ANE), i.e., GNE not consumed by Chindia, fell from 40.4 mbpd in 2005 to 35.1 mbpd in 2010. I’m projecting that ANE will be down to about 27 to 30 mbpd in 2015.
Steven Kopits wrote:
“Interesting article from Platts about Eagle Ford (Texas) shale oil crude being too light and sweet for Gulf Coast refineries, so it might be exported. Kind of a reverse Libya.
http://www.platts.com/weblog/oilblog/2011/06/08/eagle_ford_crud.html”
Which is interesting, but unlikely given that crude exports from the US are prohibited in all cases except for: (1) crude oil derived from fields under the State waters of Alaska’s Cook Inlet; (2) Alaskan North Slope crude oil; (3) certain domestically produced crude oil destined for Canada; (4) shipments to U.S. territories; and (5) California crude oil to Pacific Rim countries. (see explanatory notes here: http://www.eia.gov/dnav/pet/TblDefs/pet_move_exp_tbldef2.asp)
You can, under very limited circumstances and after acquiring the proper permit from the BIS and DOE, export oil purchased or swapped from the SPR, if the BIS and DOE determine that such export will result in import of petroleum products needed in the US and not otherwise available–ie, this scenario probably has never even happened.
Wrote a blog on “Does the market listen to OPEC anymore?” last year. My opinion is not so much though the long end of the curve depends more on OPEC (but even then my opinion has changed since i wrote the blog. That I believe will depend on the marginal costs of production in the costlier oil fields.