In my previous post
I described a new research paper with University of Chicago Professor Cynthia Wu on the Effects of Index-Fund Investing on Commodity Futures Prices. Previously I discussed what we found for the prices of agricultural commodities. Here I review our findings about oil prices.
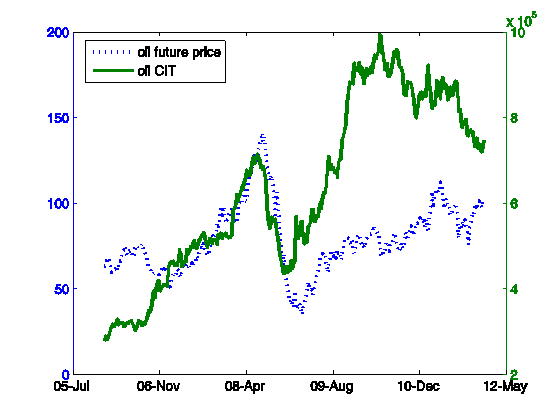
Part of the interest in a possible effect of commodity-index funds on oil prices comes from testimony before the U.S. Senate by hedge fund manager Michael Masters, in which he produced a provocative graph of oil prices against an estimate of the number of crude oil futures contracts held by commodity-index funds. We reproduced his methodology to update his graph below. The figure certainly seems to suggest a strong connection between these two series, particularly during 2008 and 2009.
 |
The CFTC does not release a direct estimate of index-fund holdings of crude oil contracts at the weekly frequency of data plotted above. Masters therefore used an indirect method based on CFTC-reported holdings by commodity-index funds of 3 particular agricultural commodities to construct the green line in the graph above. His reasoning was that most index funds follow one of two popular strategies, trying to track either the S&P-Goldman Sachs Commodity Index or the Dow Jones-UBS (formerly Dow Jones-AIG) Commodity Index. He noted that soybean oil, one of the 12 agricultural commodities for which CFTC does report a weekly estimate of index-fund positions, is included in the Dow Jones but not the Goldman strategy. Masters’ proposal was that, by using the CFTC estimate of holdings of soybean oil by index funds, and from the known weights that the Dow Jones strategy calls for holding soybean oil relative to crude oil, one could infer how many crude oil contracts were being held by funds following the Dow Jones strategy. Similarly, the Goldman strategy includes Kansas City wheat and feeder cattle, whereas the Dow Jones index does not, so either of these commodities (Masters used the average) could generate an implied holding of crude oil contracts by those trying to replicate the Goldman Sachs Commodity Index. Summing these two estimates produced the green line in the figure above. Thus this estimate of crude oil holdings is actually based on reported holdings in soybean oil, Kansas City wheat, and feeder cattle contracts.
This approach of imputing crude oil holdings from a few agricultural commodities has been sharply criticized by Irwin and Sanders (2011), who note that the implied estimates using Kansas City wheat often differ significantly from those based on feeder cattle. They also document that, for dates for which we have separate reasonable estimates of crude oil contracts held by commodity-index funds, the actual holdings differ substantially from the series plotted in the green line above. (See my discussion of Irwin and Sanders’ paper in Econbrowser last August).
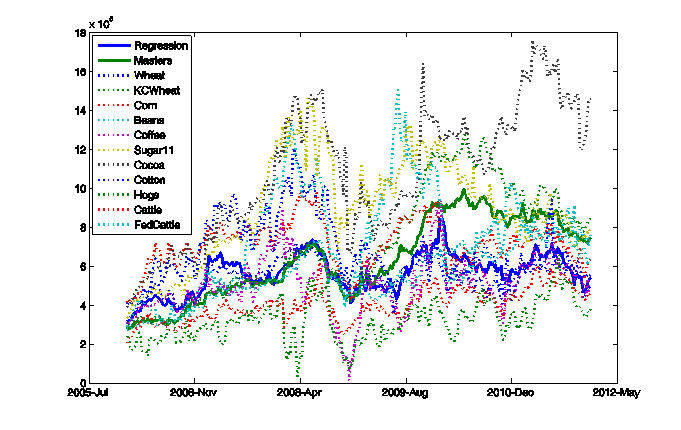
In my new paper with Cynthia Wu, we demonstrate that Masters’ idea for imputing crude oil holdings from agricultural measures does not require finding a commodity that appears in one index but not the other. Algebraically, the method can be thought of as simply solving a system of two equations to determine two unknowns. In fact under Masters’ assumption, it would be possible to infer crude oil holdings from almost any two arbitrary agricultural commodities. The graph below shows what those inferences look like if one uses soybean oil plus any one of the indicated second commodities. The inferred series for crude oil holdings is quite sensitive to which agricultural series one uses. The figure also plots a regression method that we developed that makes use of all 12 commodities together, which can be viewed as a generalization of Masters’ averaging idea.
 |
A recent paper by Stanford Professor Ken Singleton found that the 13-week change in Masters’ estimates of crude oil holdings can help forecast returns on crude oil futures contracts. Cynthia and I were able to reproduce this finding, though the level and 1-week change of the Masters series don’t have any predictive power.
Returning to the first figure above, the striking feature of the Masters series is that it collapses as the recession worsened in 2008 but began to rebound sharply before the recovery began, features that help give it apparent predictive power over the sample period that Singleton originally studied. Since Singleton’s paper was written, we now have 2 more years of data with which to see if the relation has true predictive power. We estimated the forecasting regression using a sample that ended at the same date as Singleton’s original analysis (January 12, 2010), and then used those regression estimates to try to forecast crude oil futures prices over January 17, 2010 to January 3, 2012. We found that in this out-of-sample exercise, the regression actually did 22% worse than one would have done if one simply used the naive forecast that futures prices would never change.
Interestingly, we found that Masters’ measure not only appeared to forecast changes in crude oil prices over the 2006-2009 period, but would equally appear to have been able to predict changes in the S&P500 stock price index over that period. However, this relation, too, turns out to perform worse out-of-sample than the naive prediction that stock prices will never change.
Our conclusion is that the correlation between 13-week changes in commodity-index holdings of agricultural futures contracts over 2006-2009 and other series such as changes in crude oil or stock prices is likely to just be a coincidence. Overall, we find very little support in the data for the claim that index buying exerted significant effect on commodity futures prices.
Professor,
You studied the positive predictive results of speculation on prices and found no correlation. What of a dampening effect of speculation? Can you draw any conclusions that speculation actually reduced extreme price swings by market actions that worked against price extremes actually moderating the market price?
Hi whats your thought on US dollar index and Gold and silver going in same direction ?
@Ricardo: A quick look at “managed money” and “other reportable” positions in the CFTC Commitment of Traders data (the old non-commercial category, or “speculators”, in common parlance) on WTI futures shows they increased to 47pc of open interest this year so far, from 43pc in the second half of last year.
At the same time, historic volatility on front-month WTI futures fell from 27pc to 20pc.
So, from this very quick take on it, yes, apparently speculators decrease volatiltiy.
OCC derivatives report is late this year 2012, as the only one available is as of end of 2011.
(http://www.occ.treas.gov/topics/capital-markets/financial markets/trading/derivatives/dq411.pdf)
Banks and banks holdings companies have registered a very steady profit growth in aggregated amounts at the chapter commodities trading. When the average quarterly trading revenue since 2000 are a mere 106 million USD with a standard deviation of 166 million USD, they have been skyrocketing at 7906 million USD as of year end 2011.
http://www.occ.treas.gov/topics/capital-markets/financial-markets/trading/derivatives/dq106.pdf
Since recorded as trading revenues they are deemed to be proprietary trading.
Masters report may not be supported through the right correlation, but the conclusion may still be valid.
Interesting to follow each OCC report on derivatives since 2000 up to 2011.
We’re still trying to find the dog that’s not barking.
If supply is growing less than demand, then producers will, over time, be able to consume the entire consumer surplus, and prices will rise until demand falls away. This point was hit in the US in August 2010, and China is just about there now.
This does not require intermediaries of any sort. However, a relative shortage of product does require an increasing number of financial investors to hold open positions. Thus, investors will be responding to investment opportunities, not vice versa.
If we wish to see correlations between oil prices and speculation, I would suggest running a regression on oil prices and pronouncements by politicians about speculation. Which comes first, the interest in speculation, or a rise in oil prices?
JDH: “The basic idea is that the more futures contracts the funds want to hold, the more risk the counterparties who short the contract are exposed to. According to the model, the futures price must be bid high enough to compensate the short side for absorbing the risk. This compensation comes in the form of an expected profit to the short side of the futures contract.”
Correct me if I am wrong, but isn’t this an attempt to prove a version of Keynes’s theory of normal backwardation? Here is Keynes: “If supply and demand are balanced, the spot price must exceed the forward price by the amount which the producer is ready to sacrifice in order to hedge himself, ie. to avoid the risk of price fluctuations during his productions period.”
Keynes wrote that speculators would require a premium if they were to bear the risk of price movements. In a way, it seems you are substituting Keynes’s hedgers with a more modern sort of naive indexer from whom speculators demand an extra return.
JP Koning: Exactly right, as we note in the papers mentioned.
Excellent post, thank you. Loved the point about the SPX — have people not noticed the risk-on/risk-off phenomenon?
I always think of the speculative net long position in commodity markets as following the market — because people who have big swings in their positions from net long to net short are trend followers. Why? Because people who are not trend-followers must be either short-term traders who fade market moves (and thus will not be net long or short for any extended period), or losers (who get carried out). Thus it is not surprising that the speculative net position “predicts” the trend — because the trend causes causes movements in the speculative net position. It strikes me that the same argument can be applied to the case of commodity ETF’s.
@John Butters:
Repeated studies from market analysts at the CFTC down the years — using their non-public data sets — have indeed shown that speculators follow the trend. Causal direction in price formation flows from commercial firms, not speculators.