Here I comment on some recent developments affecting oil and gasoline prices.
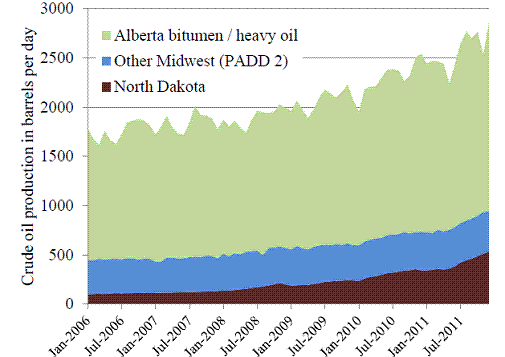
There is no oil shortage in the central United States, and has not been for some time, thanks to increased production from Canadian oil sands, North Dakota, and the Midwest United States:
 |
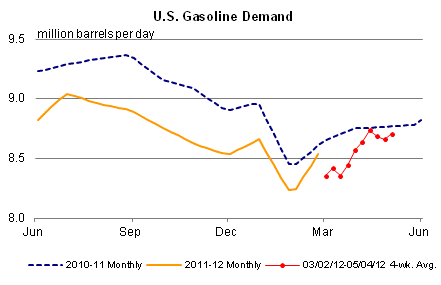
At the same time, demand in the U.S. is down, as Americans are driving fewer miles than in 2008 with more fuel-efficient cars:
 |
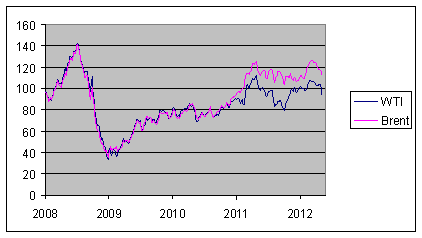
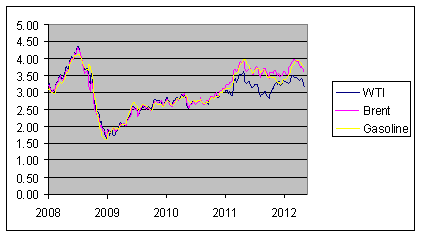
The result has been that oil is piling up in the central U.S. With inadequate pipeline capacity to transport that crude so that it could replace more expensive oil imported by refineries on the U.S. coasts, a dramatic divergence developed between the price of oil in the central U.S. (as represented by West Texas Intermediate) and that paid by refiners on the U.S. coasts (which is close to the European benchmark Brent).
|
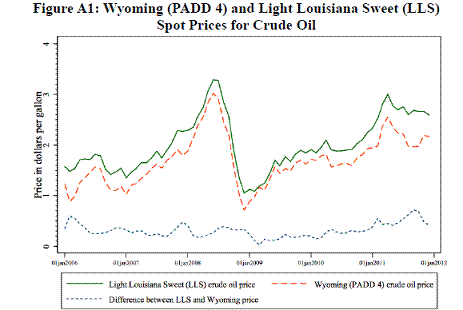
However, as U.C. Berkeley Professor Severin Borenstein and University of Michigan Professor Ryan Kellogg note in a new research paper, that discrepancy in cost of crude did not translate into differences Americans pay for gasoline in different parts of the country. The main reason is, unlike crude oil transportation capacity, our pipelines for moving refined products were adequate to enforce the law of one price for the wholesale gasoline market.
 |
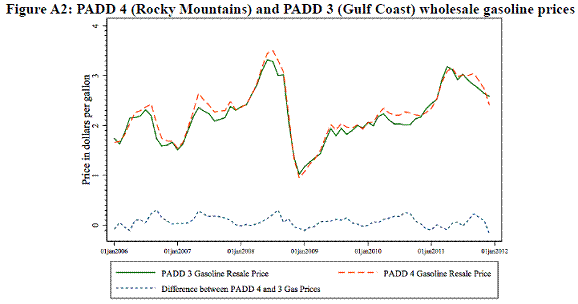 |
The result is that the U.S. retail price of gasoline has been following the international price of crude oil rather than the price received by producers in central North America.
 |
The process of building new infrastructure to move crude to refineries on the American coast is now underway. Canadian pipeline company Enbridge issued this press release last week:
Enbridge announced it had received sufficient commitments from shippers to upsize its proposed Flanagan South Pipeline Project and, with joint venture partner, Enterprise Products Partners, L.P. (Enterprise) to twin the Seaway Crude Pipeline System, bringing Enbridge’s expected investment in its U.S. Gulf Coast initiative to $5.2 billion.
“The commitments secured in the open seasons held in the fourth quarter of last year and the first quarter of 2012 will support additional infrastructure to meet the growing transportation needs of Bakken and western Canadian producers and U.S. Gulf Coast refiners, contributing to North America’s energy security,” said [Enbridge CEO Patrick] Daniel. “The new upsized Flanagan South Pipeline, combined with our existing Spearhead Pipeline system, will offer shippers 775,000 barrels per day of capacity from Flanagan to Cushing, with the Seaway Crude Pipeline System reversal and expansion offering capacity of 850,000 barrels per day from Cushing to the Gulf Coast.”
The first shipments through Seaway should take place this week.
Reuters reported on Monday:
U.S. cash crude differentials
were weaker for light sweet crudes on Monday as two cargoes of
550,000 barrels of light sweet, domestic crude offered off the
Seaway pipeline were seen pushing down the differential of the
Gulf’s benchmark cash crude.Changing relationships between sweet and sour crudes are
seen as a result of the reversal of the Seaway crude pipeline
around May 17, which initially will carry 150,000 bpd of crude
out of the oil hub of Cushing, Oklahoma to Gulf Coast
refineries.
What will this mean for the price Americans in the Midwest pay for gasoline? Borenstein offers this assessment on the Energy Economics Exchange blog:
The first stage of the Seaway will narrow the crude price differential only partially, but even as its capacity expands and other new pipelines come on line, the narrowing of the price spread will have no discernible impact on prices at the pump….
when the price of crude dropped in the Midwest during 2011 (relative to the rest of the world), the price of gasoline and diesel in the Midwest continued to be set by the marginal supply, which was coming from the Gulf Coast. Midwest refineries made big profits refining cheap crude, and selling the output at prices set by higher-cost crude in the Gulf. They weren’t doing anything nefarious; they were just the lucky beneficiaries of being in an oil-rich area that, temporarily, couldn’t get its crude oil to world markets.
The new pipeline capacity between the Midwest and the Gulf Coast will have big economic impacts. Oil producers in the Midwest and Canada will be able to sell their output for higher prices and refiners in the Midwest will see the sweet ride they’ve been on for the last year and half start to come to an end. But this will be a non-event at the local gas station.
At the same time that the new pipelines start to deliver oil to the coast, supplies are for now looking more ample globally as well. The IEA estimates that global oil production was 600,000 barrels/day higher in April than in March, led by increases in Iraq, Nigeria, and Libya. Their estimates put production 3.9 mb/d above April of last year and about 2 mb/d above the previous peak reported by IEA prior to last year’s cutbacks from Libya. The recession in much of Europe and slowing of growth in the U.S. and China are other factors restraining growth in demand.
All of which means that near-term prospects are for lower gasoline prices, even for consumers in the American Midwest.
Seems like I have, once or twice, noted that US consumers are effectively paying global prices for crude oil.
Monthly production data tend to be quite noisy and subject to later revision, and they can also be influenced by inventory changes.
Regarding global annual production data, the annual data for 2005 to 2011 show a slow (about 0.5%/year) increase in total liquids production, inclusive of low net energy biofuels (EIA).
However, global annual crude oil production has been virtually flat since 2005, despite a doubling in global crude oil prices, from $55 in 2005 to $111 in 2011.
And our data base shows a material decline in Global Net Exports of oil (GNE) and especially in Available Net Exports of oil (ANE, or GNE less Chindia’s combined net oil imports).
The combined net oil exports from the seven major net oil exporters in North & South America, inclusive of rising net exports from Canada, fell from 6.2 mbpd in 2004 to 4.8 mbpd in 2010 (BP, total petroleum liquids). If we extrapolate their 2004 to 2010 rate of increase in their combined ratio of consumption to production of total petroleum liquids, they would collectively approach a 100% ratio, and thus zero net oil exports, in about 21 years.
The dominant trend we are seeing is that developed oil importing countries like the US are gradually being shut out of the global market for exported oil, which is why the US became a net exporter of refined petroleum products last year. We couldn’t afford to buy all of the refined products coming out of US refineries.
Incidentally, if we use Texas Railroad Commission (RRC) data for Texas production, instead of the EIA, there was no increase in US crude oil production from 2010 to 2011. An average of a thousand rigs drilling for oil in the US in 2011 resulted in a net increase of zero bpd per drilling rig drilling for oil.
The RRC sums the production from Texas producers, and it has been doing so far decades, while the EIA uses a sampling approach. And we have of course seen sizable discrepancies between the EIA and other data sources regarding production in Saudi Arabia in 2010, e.g., the EIA’s number for Saudi total petroleum liquids production in 2010 is 500,000 bpd higher than what BP shows.
Art Berman has been warnning of something like the following:
A blogger on The Oil Drum pointed out some stunning natural gas numbers in the RRC data base:
January, 2011 Texas natural gas production: 18.3 BCF/day
January, 2012 Texas natural gas production: 15.6
Here’s the kicker:
February, 2012: 14.6
These are preliminary numbers, but the subsequent revisions to preliminary RRC crude oil production numbers have not been material. And once again, the RRC sums the reports from Texas producers, while the EIA estimates, using a sampling approach.
Incidentally, Art Berman will be doing a webinar presentation on US shale oil plays tomorrow. For more info: http://www.aspousa.org
Have you looked at the trade data recently, especially the real ( 2005 $) data from census.
Oil exports have exploded over the last few years.
Oil exports had been running at a sum equal to about 10% of imports for years. But oil exports — both crude and refined –have exploded over the last few years and exports are now equal to about a third of imports.
On a net basis,imports less exports, real oil imports are back to below their 1994 level and almost 50% below their 2004 peak.
“Oil producers in the Midwest and Canada will be able to sell their output for higher prices and refiners in the Midwest will see the sweet ride they’ve been on for the last year and half start to come to an end. But this will be a non-event at the local gas station.”
So why should consumers care one way or the other if a pipeline is built? This is just a pi**ing match between two sets of billionaires over who gets to collect a windfall.
Incidentally, it is amusing to see the conservatives that screamed bloody murder when a local developer used eminent domain to take over private property in the Kelo Supreme Court case are now totally silent when a foreign oil company walks in and seizes private property from U.S citizens.
Joseph,
I think that the pipeline should be built, but you are basically correct that it’s only immediately relevant to Mid-continent producers and to Mid-continent refiners.
However, if most of the Canadian oil exports are diverted to their coasts, the US will probably lose any realistic chance at getting the Canadian to US refiners.
Regarding slowly rising–or flat–US crude oil production, as I have previously noted, most US consumers are probably more focused on the fact that global annual crude oil prices have doubled in six years.
GAO: America has 2.5 TRILLION barrels of recoverable oil on federal lands in Colorado, Utah and Wyoming
That’s roughly 15 or 16 times the national debt in today’s price of the oil. Even if only 25% were recoverable, that oil is still fairly valuable.
“The Rand Corporation, a nonprofit research organization, estimates that 30 to 60 percent of the oil shale in the Green River Formation can be recovered,” [Anu K.] Mittal [GAO’s director of natural resources and environment] told the [House Science] subcommittee [on Energy and Environment].”
http://hallofrecord.blogspot.com/2012/05/us-too-many-assets-too-little-cash.html
Jeffery, I think saying we’re being shut out of market isn’t quite right. We’re in the market and selling. We are opting out.
We’re only getting shut out in the sence that we aren’t increasing our capacity to move and refine oil. Keystone is an examply. We’ll be shut out of the market for that oil if it’s not built. We lose the first choice on whether to buy or sell. We’ll have to pay higher transportation costs…
Joseph: re Kelo.
Yes, I am very surprised about that as well.
Bruce,
At best, the net energy to be derived from the Kerogen deposits in the Green River Formation is probably close to zero.
Here is a 2005 essay by Randy Udall and Steve Andrews:
Oil shale may be fool’s gold
http://www.energybulletin.net/node/11779
Excerpt:
“All hype aside, oil shale is the poorest of the fossil fuels, containing far less energy than crude oil, much less even than hog manure, peat moss or Cap’n Crunch. A meager amount of energy, tightly bound up in an enormous volume of rock, oil shale seems destined to remain an elusive bonanza, the petroleum equivalent of fool’s gold.”
My comments:
My view is that the doubling in annual global crude oil prices, which corresponded to collapsing real estate values in the US, especially in outlying suburban areas, provides all the evidence necessary to conclude that the US auto-centric suburban way of life is dead, but like many of the ghosts in “The Sixth Sense” movie, most of us don’t know our auto-centric suburban way of life is dead, and we only see what we want to see.
The decline in the price of oil is being confirmed by a decline in the price of gold. The ratio of oil to gold has essentially maintained its relationship. That means that the decline in oil is being driven by fiscal events not monetary events. That is bad news for the economy. The oil market is passing judgement on the world economy and the picture is not pretty. The judgement is that industrial production is in serious decline.
Aaron,
Following is my chart showing normalized oil consumption for China, India, Top 33 net oil exporters and the US from 2002 to 2010 (BP data base):
http://i1095.photobucket.com/albums/i475/westexas/Slide1-22.jpg
I guess readers can draw their own conclusions as to who the high bidders were as global annual crude oil prices increased from $25 in 2002 to $111 in 2011.
In any case, if we extrapolate current data, by the time that a child born this year, 2012, graduates from high school, in 2030, the Chindia region would consume 100% of Global Net Exports of oil.
“My view is that the doubling in annual global crude oil prices, which corresponded to collapsing real estate values in the US, especially in outlying suburban areas, provides all the evidence necessary to conclude that the US auto-centric suburban way of life is dead”
I think that that overstates things quite a bit. Perhaps it is the death knell of exurbia, but it seems to me that simply downsizing of vehicles (i.e. trade the F-150 4 x 4 crewcab for a Prius C) can more than make up for the increase in crude prices.
Obama is pushing through very aggressive CAFE standards. The unintended consequence will be to allow the ‘burbs to thrive. It’s not even like European countries, with their much higher gas prices, don’t have suburbs.
Buzzcut,
Average per capita energy consumption in the EU is about half of what it is in the US, and most European countries have excellent mass transit systems.
On the supply side, our data base shows a material decline in Global Net Exports* of oil (GNE) and in Available Net Exports of oil (ANE, or GNE less Chindia’s net imports).
In my opinion we are only maintaining something resembling Business As Usual because of a sky high depletion rate in the post-2005 cumulative supply of GNE and in ANE.
Based on extrapolating the 2005 to 2010 data, the estimated post-2005 cumulative GNE and ANE depletion rates for 2005 to 2010 were 5%/year and 10%/year respectively. The depletion rate is the rate that we consume a resource.
Based on a model and several case histories, and based on extrapolating the 2005 to 2010 data, I am estimating that about half of the post-2005 cumulative supply of Global Net Exports of oil will have been consumed by the end of 2020, and I am estimating that about one-half of the post-2005 cumulative supply of Available Net Exports will have been consumed by the end of next year, 2013.
*BP + Minor EIA data, total petroleum liquids, top 33 net oil exporters in 2005
II think April over April oil production data is perhaps more illustrative: Over that period, the EIA (May STEO) reports that global oil (all liquids) was up 3.3 mbpd. Quite impressive. Of this, 1.2 mbpd was recovery of Libyan output (which was supposed to take years, as readers will recall). This leaves about 2.1 mbpd of net increase. Of this, the US accounted for a whopping 0.9 mbpd and the Canadians an entirely acceptable 0.2 mbpd. So more than half of the net increase was North America. (Jeffrey will point out EIA vs TRRC data discrepancy. I don’t know the cause either–I should ask, I suppose.) The Saudis kicked in another 0.9 mbpd, bringing them back to production levels of 2008, or 1979, for that matter. Thus, the true increase in production was all North America. Now, let’s look at prices: In April 2011, average Brent was $123; April 2012, $119. So, oil production increased by 3.3 mbpd, we’ve seen massive demand destruction in the OECD, and the oil price fell by all of $4 / barrel? How much was inherent demand growth for the 12 month period? If we define inherent demand as the incremental volume which must be supplied to keep prices constant, then it would appear inherent demand growth was pretty close to 3.3 mbpd. Not 1.5 mbpd, not 1.8 mbpd. 3.3 mbpd. That is a whole lot–almost double the demand growth estimates of the likes of the IEA, EIA, and OPEC.
Jeffrey:
“All hype aside, oil shale is the poorest of the fossil fuels, containing far less energy than crude oil, much less even than hog manure, peat moss or Cap’n Crunch. A meager amount of energy, tightly bound up in an enormous volume of rock, oil shale seems destined to remain an elusive bonanza, the petroleum equivalent of fool’s gold.”
There is ample profit to be made from shale oil and the only limitation on that and our “auto-centric way of life” is from a certain U.S. Agency gone rogue. Otherwise, that is simply wishful thinking from those who believe the human population should be limited to a few million globally.
http://mjperry.blogspot.com/2012/01/north-dakota-oil-fuels-continued-job.html
That’s the problem with relying on 7-year old analyses. They’re wrong.
Bruce Hall It takes a ridiculous amount of heat and fresh water to extract the oil and move the kerogen down a heated pipeline. It will never be more than a marginal player. And God help us if there’s another spill like the one in Michigan because kerogen sinks to the bottom and essentially kills the lake, stream or aquifer. Shale oil is a loser.
You’ve also been completely taken in by a very misleading chart with two different axes. Total mining employment in North Dakota has indeed increased, but total employment in that sector is still very small (compare the scales on each axis). Employment in the mining industry in North Dakota is the same as employment in the financial sector…and we all know that young powerhouse Wall St. quants are just dreaming of working in Fargo. Almost all of the ag states in the upper midwest have low unemployment rates. Have you checked wheat prices lately? Have you checked John Deere’s earnings report from today?
Shale oil, oil shale–not the same thing. The former is what’s in the Bakken; the latter is kerogen, which no one has yet exploited commercially.
Steven Kopits Thanks, but I thought the stuff that Rick Santorum held up in his hand was the latter…oil shale. Isn’t that the stuff that’s supposed to be so abundant?
Slugs –
Both shale oil and oil shales are abundant. The question is how much, how fast, and at what price they can be called upon. I refer you to Jeffrey on these matters.
To your more general point, I find that in Washington, people are very committed to a given position or line of reasoning because i) they known how it will be received and attacked, and therefore ii) feel safe and comfortable. It’s theatre (sometimes quite entertaining!), not science.
I would add that this is not necessarily a good thing. But if we don’t pay politicians for results, this is what we get. If you want to de-politicize politics, then you have to reward people for specific results; you have to separate the actions from the rhetoric.
… if we don’t pay politicians for results, this is what we get.
They are paid for results. Oil companies pay them and as a result get lots of taxpayer subsidies.
Joseph –
If what you said were true, here’s how the numbers would look:
– Production from Federal shale lands: +500 kbpd
– Alaska: +1,200 kbpd
– California: +800 kbpd
– Gulf of Mexico: +200 kbpd
So were land readily accessible, US production could easily be more than 2.5 mbpd greater than it is. If you were right, there’d be drilling off Californa and in ANWR. There would be shale gas drilling in NY. There’s not.
As for subsidies, do I have to calculate this again? Why don’t you go to the 10-K’s and read through the financial reports. Exxon’s taxes, last I checked, were twice its profits.
Exxon’s taxes, last I checked, were twice its profits.
Steven, surely you would not have us believe that Exxon’s effective corporate tax rate is 66%? These are the sorts of misleading claims that give oil pundits a bad name and cause people to immediately dismiss anything you say.
An interesting article on Iceland, from Saturday’s WSJ (behind paywall):
http://online.wsj.com/article/SB10001424052702304203604577396171007652042.html?mod=WSJ_hp_MIDDLENexttoWhatsNewsSecond
In European Crisis, Iceland Emerges as an Island of Recovery
Excerpt:
“VESTMANNAEYJAR, Iceland—Three and a half years after Iceland collapsed in a heap, Dadi Palsson’s fish-processing plant has the air of a surprising economic recovery. Mr. Palsson arrived at 4 a.m. on a recent workday. Twelve tons of cod were coming in. Soon, his workers would bone, slice and pack the fish for loading onto towering container ships headed abroad.
In 2008, Iceland was the first casualty of the financial crisis that has since primed the euro zone for another economic disaster:
Greece is edging toward a cataclysmic exit from the euro, Spain is racked by a teetering banking system, and German politicians are squabbling over how to hold it all together. But Iceland is growing. Unemployment has eased. Emigration has slowed.
Iceland has a significant advantage over stressed euro-zone countries—a currency that could be devalued. That has turned its trade deficit into a surplus and smoothed its recovery . . . . unlike Ireland, for example, Iceland let its banks fail and made foreign creditors, not Icelandic taxpayers, largely responsible for covering losses.”
End Excerpt
This website, from the Economist, indicates that total global public debt, from 2005 to 2010, was growing at about 7%/year, on track to double in 10 years:
http://www.economist.com/content/global_debt_clock
Meanwhile, I estimate that the post-2005 Cumulative Supply of Global Net Exports of oil (GNE) and of Available Net Exports of oil (ANE*) respectively fell at about 5%/year and 10%/year from 2005 to 2010, on track to respectively fall by an additional 50% in 14 years and 7 years, after 2010.
In any case, it occurs to me that if most oil importing countries are following Iceland’s path, just at different rates, perhaps the following quote is relevant:
“If it were done when ’tis done, then ’twere well?It were done quickly”
For more info, search for: Peak Oil Versus Peak Exports.
*GNE = Global Net Oil Exports, top 33 net oil exporters in 2005, total petroleum liquids, BP + Minor EIA data; ANE = Available Net Exports (GNE less Chindia’s combined net oil imports)
Steve,
As noted up the thread, the short term monthly production data are really just rough estimates, and are subject to revision, and they can also be distorted by inventory changes.
I prefer to use the annual data, which show a slow (0.5%/year) rate of increase in total liquids production, inclusive of low net energy biofuels, from 2005 to 2011 (EIA), while crude oil and total petroleum production has been virtually flat, with an ongoing decline in Global Net Exports of oil.
Regarding the TRRC versus EIA discrepancy, I vote for an actual counting of Texas production, which is what the RRC does, versus the sampling approach that the EIA uses. And as also noted up the thread, there is about a 500,000 bpd gap between what the EIA shows for 2010 Saudi production, versus the BP (and JODI) data base. In round numbers we are looking at about a million barrel per day discrepancy, just from two producing regions.
Note that the RRC shows a decline in Texas natural gas well production, starting in 2010, with the decline recently accelerating.
Bruce,
I’m reminded of a scene from another movie, “American Beauty,” to-wit:
“Never underestimate the power of denial.”
If you prefer to believe that we will obtain hundreds of billions of barrels of oil, that will probably, at best, have about zero net energy content, you are certainly not alone.
For Q1 2012, Exxon discloses its effective tax rate as 49%. See slide 4.
http://www.exxonmobil.com/Corporate/Files/news_presentation_1q12.pdf
For Q1 2012, Exxon discloses its effective tax rate as 49%.
Here is why you can’t trust anything said by an oil pundit. First he just drops a 67% tax rate hoping to impress you and hope nobody will notice. Then when he actually gets around to citing a real number it turns out he just inflated it by a third. (Note: forget anything oil pundits tell you about the number of jobs a pipeline will generate. As seen here, they just invent numbers whole hog to make a case.)
First, even the 49% number is phoney. These are just numbers that are reported on a SEC filing. The accounting rules for GAAP and for the IRS are entirely different, so unless you actually see their IRS filing, anything put in the SEC report is meaningless. Exxon will not disclose their actual IRS filing.
Remember the big stink about Exxon paying zero U.S. income taxes in 2009. Here is what the Exxon spokesman said back then: “Jeffers explains that what ExxonMobil reports in its annual consolidated financial statements is just accounting, that the numbers reflect expenses or credits recorded throughout the year and “do not represent our real tax bill.” So even Exxon says that their SEC numbers are phoney when they want to excuse a zero tax SEC report. Why should you believe the SEC numbers when they say they pay lots of taxes? They already told you they don’t reflect actual taxes paid.
Second, they include foreign taxes paid in their report to pump up the appearance of taxes paid for U.S. income. In many years, Exxon pays almost nothing in U.S. taxes because they get credits for foreign taxes paid.
Third, in their total they include deferred taxes on foreign income for which they have never paid taxes and may never pay taxes. An enormous amount of Exxon profit is from overseas and they don’t pay U.S. taxes on that unless it is brought back to the U.S. They may never do that, or they may get another repatriation tax holiday like they did in 2004, yet they include that unpaid tax in their 49% accounting.
Here are some other things the oil industry includes in their big tax numbers when they are trying to impress you.
1. Royalties paid for drilling on land they don’t even own. So I guess a book publisher should complain about their high taxes since they have to pay royalties to authors.
2. Sales taxes paid by consumers at the pump. So I guess if I buy a TV at Walmart, Sony should complain about the high sales taxes they pay.
But really, all these arguments about how much tax oil companies pay is irrelevant. What is relevant is that they pay much less than they would pay if it were not for all the special subsidies and loopholes they put in the tax code just to favor oil companies. A cement factory or a shoe factory does not get these subsidies. Why should oil companies?
Something to keep an eye on, interesting discrepancy regarding Russian oil production data:
http://www.forbes.com/sites/markadomanis/2012/05/20/is-russian-oil-production-plummeting/
Is Russian Oil Production Plummeting?
Excerpt:
“I would argue that a half million barrels a day of production can’t simply disappear, and that there has to be something seriously wrong with the data: either previous Russian production figures were artificially high, or the most recent production figures released by JODI are artificially low. . . The two figures match almost exactly until there is a dramatic and sustained divergence starting in January. If JODI has some sort of an anti-Russian grudge, it’s a very recently acquired one.
What does this tell us? Well, either Russia experienced a significant production loss that nobody noticed or reported or there is something dramatically wrong with the data supplied by JODI.
As someone who has a keen interest in
comparative demographics and economics, I’m consistently amazed by the lack of good data sources: even using a wide variety of internet search tools, finding basic information is a lot harder and more time consuming than I ever would have guessed, particularly if you’re trying to find anything from the past year or two. It would be very discouraging, and more than a little scary, if one of the few trusted data sources such as JODI turned out to have such serious flaws in its data.
It would be even scarier if the oil market was even more opaque and confusing than was assumed to be the case.”
End Excerpt:
http://blogs-images.forbes.com/markadomanis/files/2012/05/JODI-vs-Energy-Ministry.png
Recent Russian net oil exports (BP):
Increasing Net Exports:
2002: 5.0 mbpd
2003: 5.8
2004: 6.5
2005: 6.8
2006: 6.9
The Net Export Plateau:
2007: 7.1
2008: 6.9
2009: 7.1
2010: 7.1
Here is a link to Sam Foucher’s modeling of Russia, Norway, Iran and UAE net exports, using data through 2006. Actual data points for 2007, 2008, and 2009 circled (this slide was not updated for 2010). Dashed lines represent estimated 95% probability boundaries:
http://i1095.photobucket.com/albums/i475/westexas/Slide2-3.jpg
@Joseph:
Here are some other things the oil industry includes in their big tax numbers when they are trying to impress you.
1. Royalties paid for drilling on land they don’t even own. So I guess a book publisher should complain about their high taxes since they have to pay royalties to authors.
I beleive you are confusing severance taxes with royalties paid to landowners. Quite different. It is indeed a tax, albeit paid to the state. But one the states are nonetheless fortunate to have.