On Friday I attended a conference at the Federal Reserve Bank of San Francisco, which included a very interesting presentation by Fed Chairman Ben Bernanke on long-term interest rates.
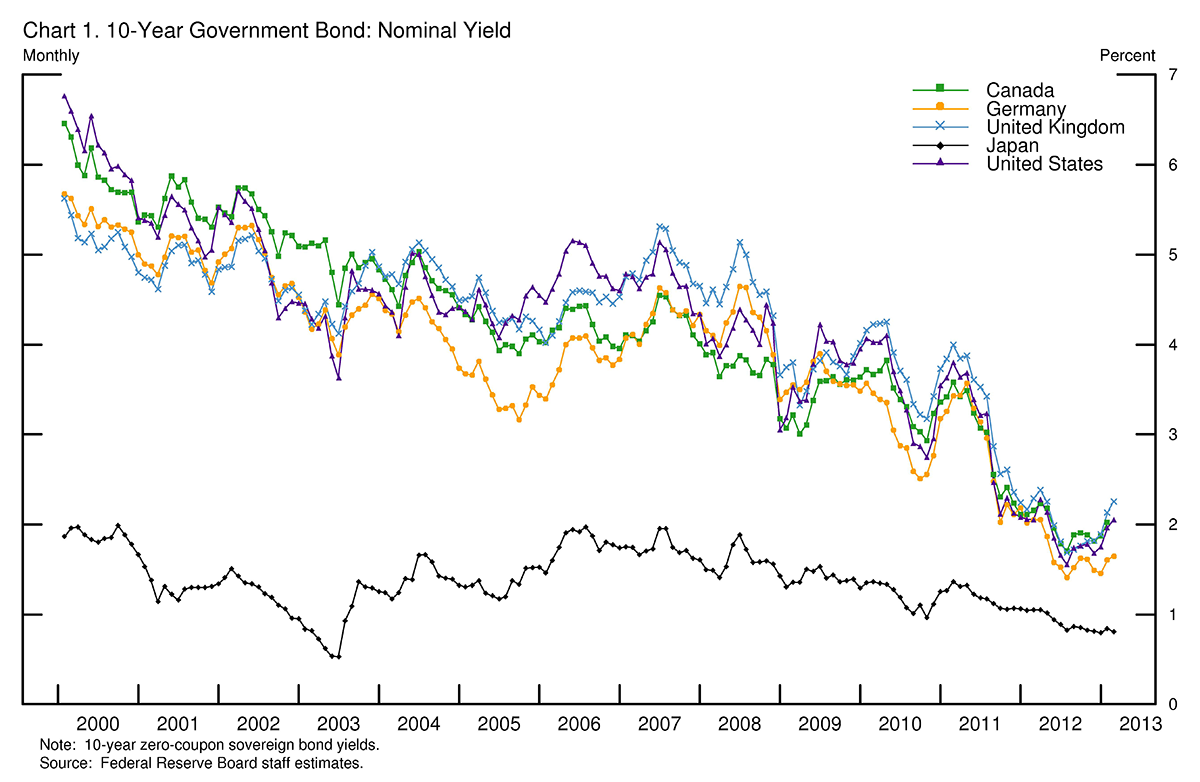
The Chairman began by noting that, with the exception of Japan, the nominal yields on 10-year bonds in many of the major economies have moved together quite closely over the last decade. The data below are quite persuasive– one should not attribute the recent very low yields in the United States to policies or developments that are unique to our country.
|
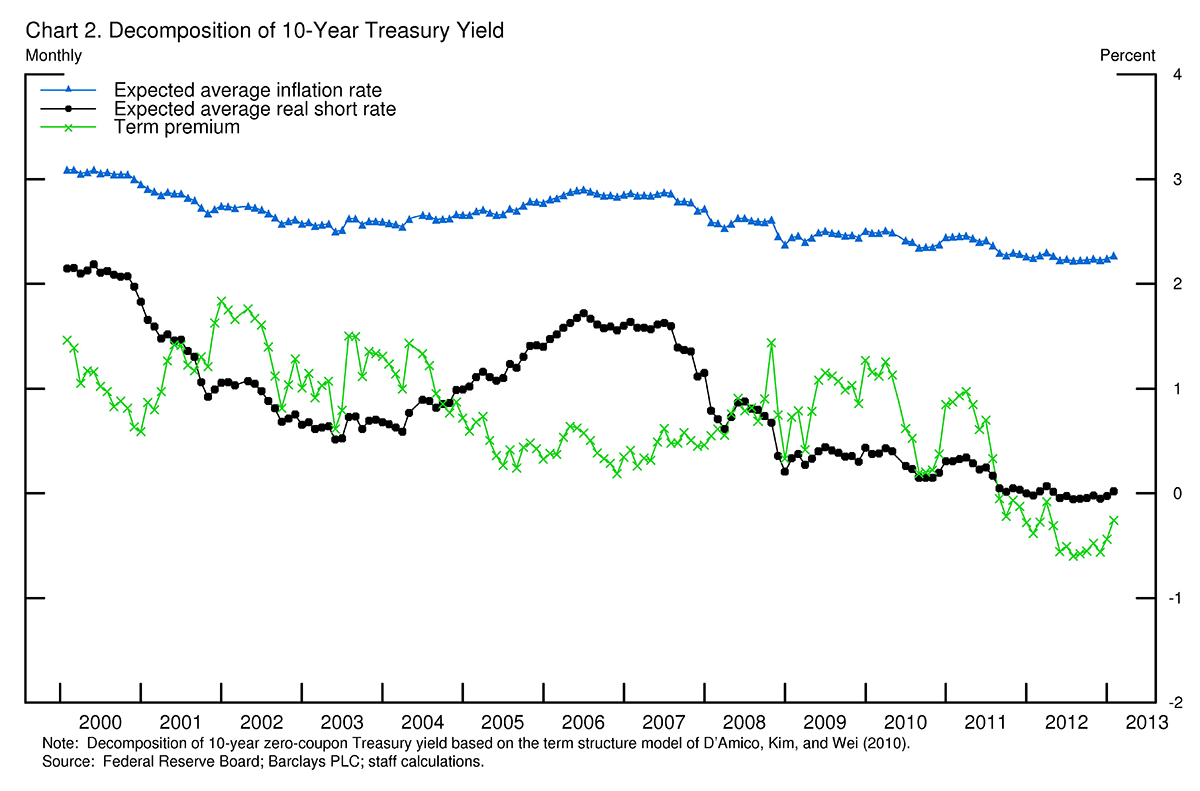
Using a model of bond yields
developed by Federal Reserve staff, Bernanke showed how the movements in the U.S. nominal 10-year rate might be broken down into three separate components: market expectations of future inflation (blue triangles in the graph below), expectations of future short-term real interest rates (black circles), and a residual referred to as the term premium on 10-year bonds (green crosses). The contribution of the first of these (expected inflation, in blue) has been reasonably steady around the Fed’s long-run goal of a 2% inflation rate.
|
By contrast, expectations of future short-term real interest rates (black line) have fallen significantly since 2006. Bernanke noted that this, too, has been the experience in other major economies, and offered this interpretation:
Real interest rates are expected to remain low, reflecting the weakness of the recovery in advanced economies (and possibly some downgrading of longer-term growth prospects as well). This weakness, all else being equal, dictates that monetary policy must remain accommodative if it is to support the recovery and reduce disinflationary risks.
The term premium (green in the above figure) has also been declining. Bernanke attributed this to the lower levels of yields themselves (which makes near-term short rates easier to forecast), a flight to safety supporting demand for U.S. Treasury debt, and the Fed’s large-scale asset purchases.
The Chairman also noted that as economic conditions improve, expected future real yields and the term premium would be expected to return toward more normal levels:
If, as the FOMC anticipates, the economic recovery continues at a moderate pace, with unemployment slowly declining and inflation expectations remaining near 2 percent, then long-term interest rates would be expected to rise gradually toward more normal levels over the next several years. This rise would occur as the market’s view of the expected date at which the Federal Reserve will begin the removal of policy accommodation draws nearer and then as accommodation is removed. Some normalization of the term premium might also contribute to a rise in long-term rates.
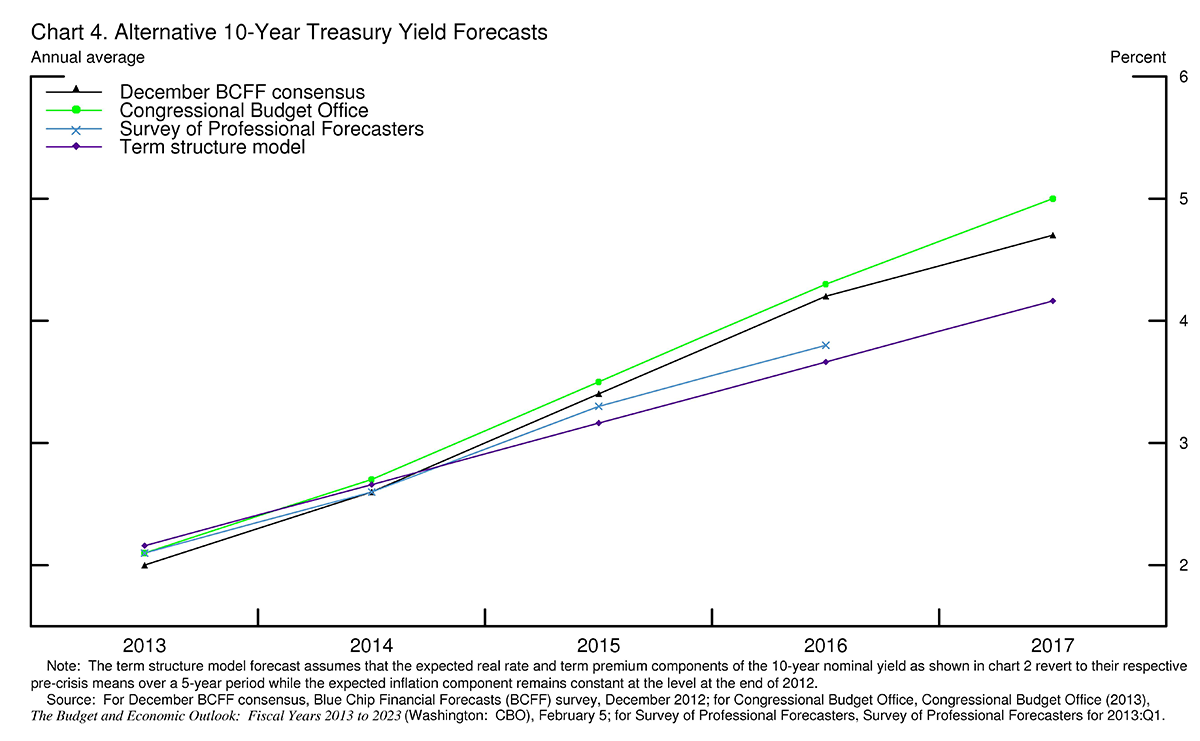
Bernanke called attention to several different forecasts of where the 10-year yield might be a few years down the road, including the Blue Chip consensus, Survey of Professional Forecasters, CBO, and the term-structure model that was used to construct Figure 1 above.
|
I was quite surprised to see the Fed Chairman produce this graph. If it is indeed the case that the 10-year yield is going to rise from 2% to 4% relatively quickly, it would mean significant capital losses for someone who buys a 10-year bond today. If the market comes around to taking such forecasts more seriously, bond prices should fall on Monday.
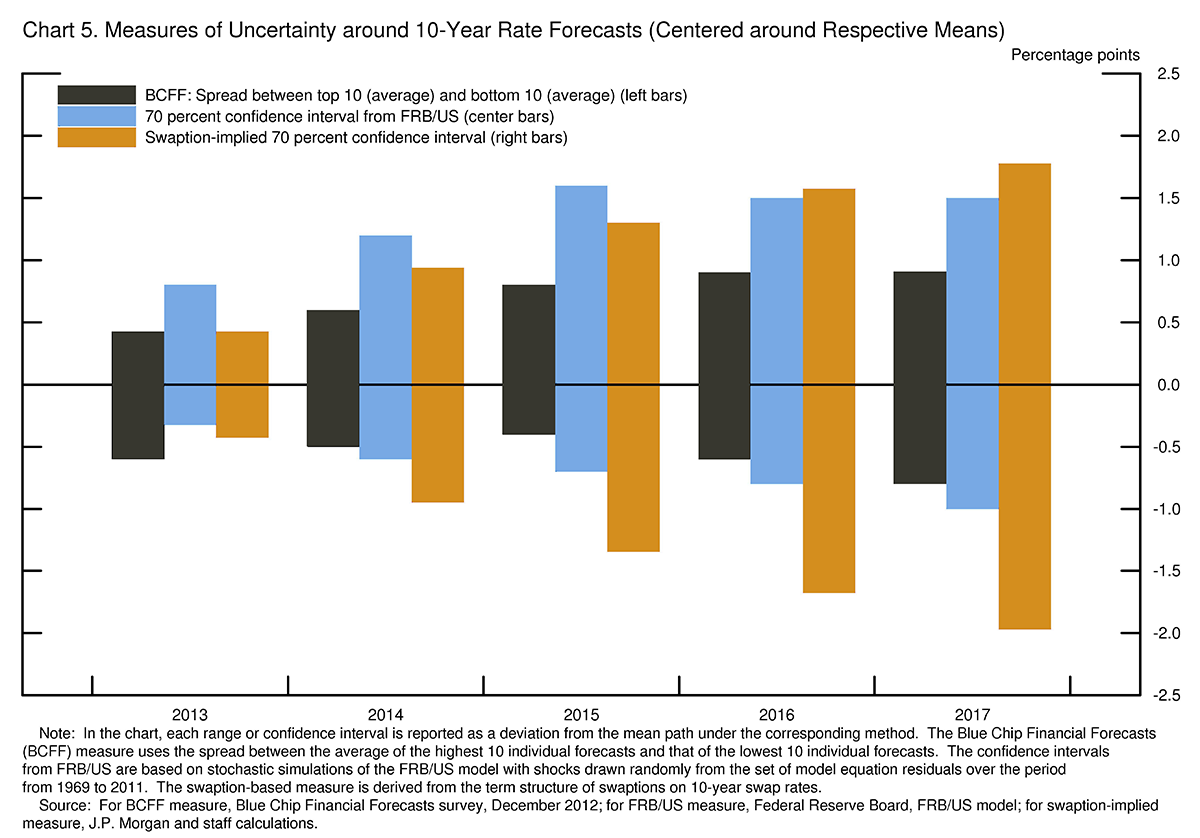
However, Bernanke also emphasized that there is considerable uncertainty associated with these forecasts, on the down side as well as the up side.
|
Bernanke offered the following explanation for why he wanted to call attention to forecasts of future ten-year rates:
It is worth pausing to note that, not that long ago, central bankers would have carefully avoided this topic. However, it is now a bedrock principle of central banking that transparency about the likely path of policy, in general, and interest rates, in particular, can increase the effectiveness of policy. In the present context, I would add that transparency may mitigate risks emanating from unexpected rate movements.
Bernanke is clearly committed to keeping short-term interest rates low for quite a while yet. But a separate question is how much more the Fed wants to allow its balance sheet to grow with additional large-scale asset purchases. I think they’ll want to give ample warning in advance of actually stopping the new purchases.
And perhaps before dropping more direct hints about ending LSAP, Bernanke would want to make a speech like this one.
UPDATE at 10:42 PST March 3: The original version of this post made an error in calculating the size of the prospective capital loss on long-term bonds, which has been deleted from the current version.
Hi Jim,
I just did a back of the envelope calculation. I don’t think the losses are as significant as you suggest. The roll-down and carry in 10 year USTs (about 40pbs/year) should compensate for the yields rising over time. Of course, there is huge risk for fixed income investors who have levered up to compensate for low interest rates. Those people will get hurt if Bernanke’s scenario plays out.
Ed
Ed: You’re right, I miscalculated. Will try to fix this later today.
Interesting will be the unwinding of interest rates positions in the banks books. Profits are looking up throughout this quarter, the associated risks must all likely fall through the Value at Risk. To be noticed a healthy recovery from derivatives exposures in the banks holdings companies.
The same report shows that all banks are not born equal when it comes to the weighing of their trading positions as a percentage of their total revenues P 20.
Same report from ECB would be welcome.
http://www.occ.gov/topics/capital-markets/financial-markets/trading/derivatives/dq112.pdf
“Real interest rates are expected to remain low, reflecting the weakness of the recovery in advanced economies (and possibly some downgrading of longer-term growth prospects as well). This weakness, all else being equal, dictates that monetary policy must remain accommodative if it is to support the recovery and reduce disinflationary risks.”
INTERPRETATION: The FED and other OECD central banks (the BIS) will continue with a policy of Financial Repression for a very long time as a means of reducing the overall credit debt burden while minimizing trauma in the process. Consequently, Central Banks through the Federal Reserve will support (subsidize) debt servicing to maturity at whatever speed necessary to support a low and stable inflation rate.
I would also comment that Chart 4 would only be true if the BIS would adopt the same expansionary credit policies (decline in bank reserve requirements and lax regulation) that existed prior to 2008… The odds of adopting such an expansionary policy in the next decade is close to zero (see chart 5).
Professor, see the historical precedent for yields during past Long Wave Trough and debt-deflationary regimes, including data for the UK Consols and discount rate going back to the late 17th and early 18th centuries.
What we are seeing is the normative pattern coinciding with a decelerating, or negative, 10-year rate of real GDP per capita, notably during the 1930s-40s, 1880s-90s, 1830s-40s, 1780s, 1730s, and 1690s.
The debt-deflationary regime has barely begun this time around, however, as Canada, Australia, parts of Europe, and China-Asia have yet to experience the full effects on their banking systems and economies from the inevitable bursting of their unreal estate bubbles.
The precedent for the LW Trough is that yields will remain low for many years to come.
The dominant mass consensus is deeply conditioned by 40- to 100+ years’ worth of price inflation (debasing of the purchasing power of after-tax wages) from growth of bank lending, asset prices, gov’t borrowing and spending, and effects of imperial wars.
However, debt deflation cannot be resolved by even more public debt and increasing claims on future wages, profits, and gov’t receipts. The larger the debt/GDP, the larger the net after-tax claims, the slower growth of demand, profits, and tax receipts hereafter.
The debt (and associated equity) will be “corrected”, which is why Bernanke and the banksters are so desperate to postpone the inevitable negative effects of the end of capitalism’s Long Wave Downwave reflationary debt cycle.
Banks’ real net interest margin after charge-offs and delinquencies remains negative, discouraging bank lending, apart from to the US gov’t with free digital credits from their printing press at the Fed.
Moreover, the flattening of the yield curve at lower nominal yields and 0% to negative real spreads further discourages banksters from expanding lending.
Thus, banks are today just TBTE gov’t-sponsored hedge funds that cannot make money or remain solvent without free reserves from the Fed and gov’t guaranteeing every larger mistake they make and from which their CEOs receive obscene bonuses.
TBTE banks are a VERY expensive utility offering little or no utility to the vast majority of us.
The TBTE banks should be taken out and shot and put out of our misery.
Menzie –
To follow up on my earlier comment:
I used the deficit per real GDP; you used potential GDP.
I find potential GDP problematic. If one believes we’re energy constrained, rather than labor constrained, the calculations of potential GDP are essentially wrong.
But even if we believe oil doesn’t matter, potential GDP depends, as I understand it, on differentials between the unemployment rate and the natural rate of unemployment, and implicitly, workforce participation rates.
As for the natural rate of unemployment, anyone have a clue as to what that might be (assuming one even accepted the concept)? Is it 7%, 6.5%, 4.5%? Do we have any real idea?
As for workforce participation, is it 66%, 64%, 63%? Declining? Rising? What is the “natural” labor force participation rate?
As a result, I have real doubts about potential GDP as a firm number.
I think, rather, that an oil-constrained economy is the reality, and that’s the primary determinant of potential GDP in the short to medium term.
It also explains very nicely the missing GDP growth:
http://www.washingtonpost.com/blogs/wonkblog/wp/2013/03/02/is-slow-growth-americas-new-normal/
A friend gave a great analysis of Bernanke’s speech.
Can you please review the graphs that Bernanke used when he warned the US of the coming financial meltdown circa 2006? Oh that’s right, he didn’t see it coming. So why would anyone be so foolish to listen to a single word he says now?
Regarding Steve’s characterization of our situation as an oil-constrained economy, I could not agree more.
Following is a line chart showing normalized (oil) liquids consumption for China, India, (2005) Top 33 net exporters and the US from 2002 to 2011, versus annual Brent crude oil prices. I suspect that some version of the above consumption trends are likely to continue out to at least 2021 or so.
http://i1095.photobucket.com/albums/i475/westexas/Slide2-6_zps4d059c52.jpg
Ratio of Global Net Exports of oil (GNE) to Chindia’s (China + India’s) Net Imports (CNI), from 2002 to 2011:
http://i1095.photobucket.com/albums/i475/westexas/Slide03.jpg
The GNE/CNI ratio has already fallen by half, down from 11.0 in 2002 to 5.3 in 2011, and the rate of decline in the ratio has accelerated in recent years. The 2005 ratio was 46/5.1 (8.9) and the 2011 ratio was 44/8.3 (5.3).
I suspect that the ratio will be down to between 2.0 and 2.5 in 2021. For example, GNE of 36 mbpd and CNI of 18 mbpd would be a GNE/CNI ratio of 2.0, while GNE of 40 mbpd and CNI of 16 mbpd would be a GNE/CNI ratio of 2.5.
Definitions:
GNE = Global Net Exports = Top 33 net exporters in 2005, BP + EIA data, total petroleum liquids
ANE = Available Net Exports = GNE less Chindia’s (China + India’s) Net Imports (CNI)
ECI = Ratio of total petroleum liquids production to liquids consumption
CNE = Cumulative Net Exports, after a given index year
My 5,000 word and 24 graph analysis of global net oil export market, and why, in my opinion, things are not quite what they seem to be:
http://aspousa.org/2013/02/commentary-the-export-capacity-index/
The Export Capacity Index (ECI):
A New Metric For Predicting Future Supplies of Global Net Oil Exports
Here are some rough numbers on the returns for holding a 10-year bond and rolling the position once per year. Eyeballing Bernanke’s chart, let’s say 10-year yields start at 1.85% and then go to 2.5%, 3.25%, 4%, and 4.5% in 2014-17. The capital losses on the bond would be between 5-6% the first three years and under 4% the final year. If we add in the coupon payments to get the total return, the losses would be about 3.3% the first two years, a loss of 2.3% the third year, and a small gain the final year. Your calculations may differ depending on your bond pricing formula, but it should be reasonably close.
I agree that Bernanke’s apparent comfort with this mean scenario is bearish for bonds in the short term. 10-year yields are up 3bps today as I write this, but of course it’s hard to know if this is the catalyst. I didn’t see these particular comments get a lot of publicity.
For those willing to take a longer term investment perspective, the 10-year bond short is a great opportunity.
If you set out to model the Canadian T Bond yield the first thing you put in the model is the US T bond yield. Than you work on getting the things that determine the spread between the two yields like the exchange rate, real growth differences, inflation differences and the differences in each countries business cycles.
So now that the US financial markets are highly dependent on foreign capital inflows shouldn’t you do the same thing to model US bond yields. Shouldn’t you start out with British, German and Japanese yields and than work on the factors that determine the spreads between US and foreign yields. Since about 1990 the spread between US 10 year bond yields and the average of British, German and Japanese 10 year T bond yields has been
amazingly narrow.
I just do not understand how you can discuss US T bond yields without incorporating these foreign yields into your discussion.
We are operating in a world of integrated financial markets and the discussions in this blog completely ignores that. I just do not understand why someone should take any of your discussion seriously.
«I was quite surprised to see the Fed Chairman produce this graph. If it is indeed the case that the 10-year yield is going to rise from 2% to 4% relatively quickly, it would mean significant capital losses for someone who buys a 10-year bond today. If the market comes around to taking such forecasts more seriously, bond prices should fall on Monday.»
He is talking up stocks… He desperately wants to stop or slow the collapse of the SP500, because the SP500 goes down, most pension funds and other insurers blow up, as well as
As Greenspan argued recently the main goal of USA policy is to boost stock prices (and house prices).
Stock prices have been sliding in real terms since the 2000 peak, and every time they suffer a collapse, as the pump-and-dump insiders start a dump phase, the Fed opens the credit tap to push them back up, thus the oscillating pattern around a downwards trend in 2000-2012.
My impression is that the Fed is trying merely to slow down the fall in the SP500, while keeping wage inflation low, and they are now talking down bonds to push up stock prices to avoid further expansions of their balance sheet that could spillover into lower unemployment or higher wages.
«Regarding Steve’s characterization of our situation as an oil-constrained economy, I could not agree more.»
My guess is that the “austerity” policies in the UK, in the USA and other countries are not ideological mistakes by policy makers who really believe that they will lead to higher growth, as many policy makers used to think before Keynes.
My guess is that in at least some if not most countries “austerity” policies are designed to deliberately prolong the recession (or “no-growth recovery”) and thus suppress demand, wages and living standards, to reduce oil imports in an oil-constrained world.
The overall impression I get is that global investors and the parties and governments they “sponsor” use the BCG Growth-Share Matrix applied to whole countries, and because of oil constraints they regard some first-world economies as “cash cows” (the USA still) or “dogs” (the UK for example).
Those “sponsored” governments and their financial systems including the central banks are promoting policies that allow large proprietors to disinvest from “cash cow” or “dog” countries at the highest prices (whole-country asset stripping) to invest in far more profitable resource based growth opportunities in third world countries.
«I just do not understand how you can discuss US T bond yields without incorporating these foreign yields into your discussion. We are operating in a world of integrated financial markets»
How I agree with this! I often point out the same as to the relationship between loose monetary and fiscal policy in the USA or the UK and investment and employment in the same country.
Most bloggers and analysts assume that looser USA policy has effect mostly on the USA real economy, while the experience of the past 25 years is that it has mostly effect on Chinese etc. investment and employment, and on USA asset prices.
Indeed arguably the enormous loose-credit bubble in the USA has led to lower employment and wages in the USA as it has given exceptionally cheap funding for USA companies wanting to clopse down and write-off USA productive assets and replace them with productive assets in China etc.
Even if exceptionally loose credit has boosted employment in finance-related jobs like finance itself and related sectors like house construction, but this depends on unsustainable continuation of the credit bubble, and is a relatively minor effect with respect to the effect of exceptionally cheap financing for moving productive capital offshore.
But I suspect that mentioning the global aspect of capital markets is politically incorrect…
Bernanke’s analytical presentation suggests that inflation can be the only reason for future interest rates to rise enough to meet CBO’s forecast. Absent signs of inflation, or discernible inflationary pressures, we must conclude that Bernanke has deliberately left the nature of the inflationary force to the listener’s discretion.
More from Sivak (UMTRI) on long term fuel economy trends:
http://deepblue.lib.umich.edu/bitstream/handle/2027.42/96632/102926.pdf
It’s great to have guys like Sivak around–folks who actually track these things.
Let me offer another answer: long-term interest rates are currently so low because the Federal Reserve wants them low, has committed to keeping them low for the foreseeable future, and is essentially buying up most of the newly issued long-term Treasury debt in order to keep them low. Long term interest rates are no longer set by the market—they are controlled by the Federal Reserve, and the pricing reflects the beliefs of the Board of Governors and nothing else: not inflation expectations, not the expected path of short-term rates, nor a mythical “term premium.” To predict the future movement of interest rates is to predict the actions of the Fed governors.
The Fed’s decision to purchase long-term Treasuries do not reflect its inflation expectations, its expected path of short-term interest rates, or its assessment of the term premium. The Fed has not bought these securities with the intention of making a positive return on its investment—if anything, it purchased them with the anticipation of losing money (on a mark-to-market basis) when it succeeded in reinvigorating the economy. The Fed purchased the securities as a policy action and not as a market decision. Therefore, Professor Bernanke’s decomposition is nothing more than compost—the prices reflect nothing other than the Fed’s desire to set them.
If the Chairman doesn’t think he is distorting the long-term debt market with his purchases, he is a moron; if he thinks he is distorting them (with the best of intentions) then he is engaging in a deception of Oz-like proportions suggesting that the rates reflect the expectations of the market. Deception? Of course. Self-deception? Who knows.
But What Do I Know,
My thoughts exactly. The argument used by Bernanke is entirely circular. The market expectations are set by the FED. The fact that this matches other Western nations is no surprise because they have followed similar policies.
People today would do well to re-read “Madness of crowds and popular delusions”. Bernanke is a modern John Law. Like John Law he will find that you cannot print your way to real economic activity and lasting prosperity. When will the bubble burst?
If 10 yr yields were to increase what are some good asset classes to consider as an investment? How would gold/silver fare in this event?