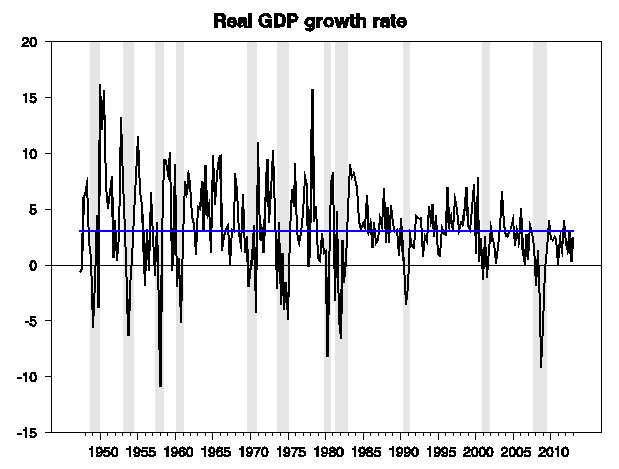
The BEA released today its estimate of 2013 first-quarter real GDP, which grew at a 2.5% annual rate from the previous quarter. That’s below the average 3.1% growth rate since World War II, but better than the 2.1% average since the recovery began in 2009:Q3.

|
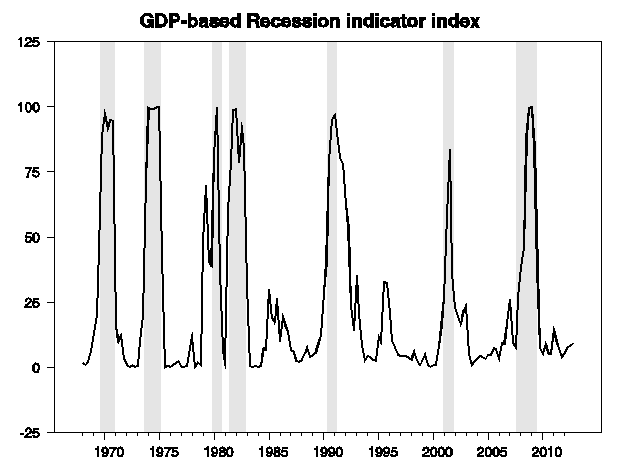
The ongoing slow growth has brought our
Econbrowser Recession Indicator Index to 9.2%, up slightly from our previous reading of 8.2%. For purposes of calculating this number, we allow one quarter for data revision and trend recognition, so the latest value, although it uses today’s released GDP numbers, is actually an assessment of where the economy was as of the end of the fourth quarter of 2012, for which the growth rate is now reported to be a decidedly worse-than-mediocre 0.4%. The index would have to rise above 67% before our algorithm would determine that the U.S. has entered a new recession.

|
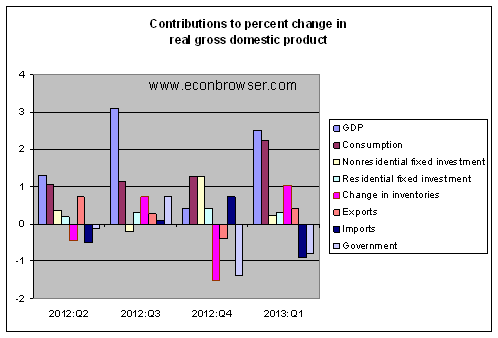
One percentage point of that 2.5% growth came from restocking inventories. In other words, real final sales grew at an even more mediocre 1.5%. Strong growth in consumption spending was offset by declines from the public sector, with lower defense spending subtracting 0.6% from the growth rate by itself, and declines in other categories of federal, state, and local spending subtracting an additional 0.2%.

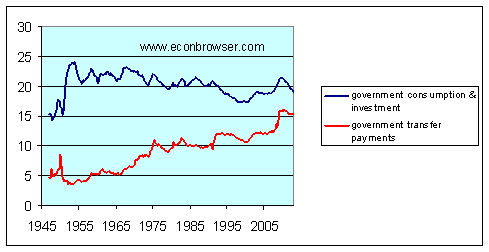
Let me call attention to one often-overlooked detail of the fiscal drag. The numbers that go into the GDP calculations just reported are direct government purchases of goods and services, which fell by $19 B between 2012:Q4 and 2013:Q1 (measured in nominal dollars, reported at a seasonally adjusted annual rate). But what many people think of as “government spending” includes not just government purchases of goods and services, but also government transfer payments. These rose by $35 B between 2012:Q4 and 2013:Q1. Although the latter don’t figure directly in GDP, they influence it indirectly. Insofar as many of the recipients of transfer payments have a high marginal propensity to spend out of that income, the transfer payments helped support some of the growth in consumption spending in the first quarter.
The graph below displays the longer term trends for these two components of government spending. Government purchases of goods and services (the blue line) fell significantly as a percentage of GDP from 1991-1997. They rose in 2001-2002, and again in 2008-2009. These have been falling as a fraction of GDP since 2010, and are now back to 2007 levels, or about where they were in 1994. By contrast, government transfer payments rose from 5.2% of GDP in 1965 to 12% in 1995 and 16% at the start of 2010. They’ve since declined to 15.4%, still above the 14.8% level of 2009:Q1.

|
Although many analysts have been describing the decline in government purchases of goods and services during the last two quarters as reflecting austerity policies at the federal, state, and local levels, another relevant factor is that spending on goods and services is being crowded out by the budget demands of making growing transfer payments. This is part of a broader pattern that has characterized the last four decades, and is something that seems likely to continue over the next decades as well.
I was struck by these lines from the report:
“Real exports of goods and services increased 2.9 percent in the first quarter, in contrast to a decrease of 2.8 percent in the fourth. Real imports of goods and services increased 5.4 percent, in contrast to a decrease of 4.2 percent.”
Given the state of the world economy, it’s hard to understand the export line.
I think we are remiss if we do not acknowledge that the 3-, 5-, and 10-yr. rates of growth of real GDP per capita are making, uh . . ., progress q-q:
3-yr.: 1.26% to 1.28%
5-yr.: -0.3% to -0.07%
10-yr.: 0.78% to 0.80%
So, at the avg. annualized trend rate of real GDP per capita since ’07-08, i.e., the “new norm”, it will take only about 78 years to get back to the long-term historical rate of real GDP per capita of 2.1% vs. ’00.
Hey, it’s only the avg. lifespan of an American male today. Sometimes progress requires some patience . . .
Besides, that’s more time for the banksters to print themselves trillions more free reserves; cut taxes for the “job creators”; cut spending on the “takers”; and start another imperial war for oil somewhere, e.g., China, to kickstart war spending back to 6-8% of GDP, below which no self-respecting empire would dream of spending less.
If it didn’t work to close the GDP gap with $2 trillion in free reserves and nearly $6 trillion in cumulative federal deficits, doubling down on that amount over the next 3-4 years has to work this time, right? Right?!
Is consumption coming from savings and from an underground economy? Consumption is up and personal income is down.
1. Real personal consumption expenditures increased 3.2 percent in the first quarter.
2. Current-dollar personal income decreased $109.1 billion (3.2 percent) in the first quarter.
3. Disposable personal income decreased $136.3 billion (4.4 percent) in the first quarter.
4. Personal outlays increased $116.3 billion (4.1 percent) in the first quarter, compared with an increase of $97.0 billion (3.4 percent) in the fourth. Personal saving — disposable personal income less personal outlays — was $313.3 billion in the first quarter, compared with $566.0 billion in the fourth. The personal saving rate — personal saving as a percentage of disposable personal income – was 2.6 percent in the first quarter, compared with 4.7 percent in the fourth.
5. The personal saving rate — personal saving as a percentage of disposable personal income was 2.6 percent in the first quarter, compared with 4.7 percent in the fourth.
I expected the real GDP number to come in closer to $13.800 trillion. It came in at $13.750 trillion which no one seems to be reporting. Well, anyway I expect the revision will be higher next month and everyone will settle back down.
http://effectivedemand.typepad.com/ed/2013/04/1st-quarter-real-gdp.html
A recession is not going to happen soon barring a disaster. The economy is holding steady. The probability of a recession soon is “effectively” zero, because we haven’t even passed the point where a recession would occur. A recession won’t occur until the expansion has ended, and the data shows there is still a bit more expansion ahead of us.
The answer is yes. Household consumption has been at a pretty stable ~1.5% growth rate since 2010, coupled with somewhat stronger export growth and mild fiscal drag. The actual economic news has been downright dullllll for three years now. The rest is noise in the data and seasonal adjustment efforts, and journalists trying to make up a story when there is none.
Semester after semester we are graduating millions of deeply indebted and embittered college graduates, with job skills that very poorly equip them for the realities of today’s economy, basically sacrificing millions of young people every year on the alter of Political Correctness.
WSJ: The Diploma’s Vanishing Value
Bachelor’s degrees may not be worth it, but community college can bring a strong return
Excerpt:
For full article, do a Google Search for: The Diploma’s Vanishing Value
An excerpt from my April, 2007 essay on “The ELP Plan.”
http://www.resilience.org/stories/2011-08-08/elp-plan-economize-localize-produce
At one time most of the workforce in the US was involved in the production and distribution of agricultural products. Mechanization of agriculture reduced the demand for these workers but the concomitant industrialization of the economy and the introduction of the (then) modern factory with its labor-hungry assembly lines served to more than soak up the available supply of labor driving higher labor’s share of the wealth produced by the investment in capital equipment.
Over time, automation of manufacturing, along with its globalization due to lower wages offshore and lower tariffs, reduced the demand for US-based industrial workers just as jobs in the new service economy appeared for “Knowledge Workers”. However as the costs of the physical capital equipment used by these Knowledge Workers (i.e. computer power and communication bandwith) falls the relative value of the intellectual or human capital, the asset that goes down the elevator at the end of the day, becomes more valuable.
Around 1995 (when Internet Explorer was released) the open communication protocols of the Internet began to be widely adapted by businesses allowing for far greater levels of connectivity and global integration that was ever possible before. At the same time the response to the looming, but temporary, Y2K problem gave the offshore outsourcing industry its toehold into corporate America.
The popping of the Internet bubble on March 10, 2000 (see the chart of the NASDAQ index) lead to the collapse in the price of bandwith on multiple brand new and never used, as well as preexisting, global undersea communication cables just as hoards of experienced, newly unemployed, Y2K and Internet workers hit the job market. Soon after then the Bush administration’s labor policies, and its liberal interpretation of the US’s work visa rules, lead to the explosion of visas being granted for the purpose of outsourcing US-based work to lower cost locations around the world.
I submit that the slowdown in average real GDP starting around the year 2000 is fully explained by these events. US firms are hiring and employing just as many as they ever did, they are just not hiring many here in the US, and many of those that they do hire are on visas coordinating the work done by “Knowledge Workers” offshore.
As more and more of the added value to productivity growth comes from the human capital of “Knowledge Workers” the more valuable the fully trained engineer (who paid only $4,000 USD for his or her bachelor degree in a STEM field) is to US corporations, especially when compared to the comparable US student with $80K in non-recourse debt.
The current policies of the US government are as if, back during the industrialization period, they only allowed foreign non-US citizens to work in the newly invented factories, labeling them “jobs the US workers can’t or won’t do”, leaving the US workers to fight over the shrinking pool of remaining agriculture jobs.
Is the term “real GDP” intentionally ironic(as opposed to imaginary GDP)? It goes beyond Bhutan and statistical problems. GDP is a single entry form of bookkeeping all credits,no debits. Increasing the natural legacy burn rate is bad. Decreasing the burn rate is good. A slow downward trend in population,GDP and finance would be salutary. Surely economists could engineer a 2% annual decline rate getting us to about half the present levels in a generation. Almost certainly easier than a 2% growth rate. Otherwise it may be done for us.
Professor Hamilton asked:
…is this the new normal?
He then answers:
…GDP…grew at a 2.5% annual rate from the previous quarter.
That’s below the average 3.1% growth rate since World War II, but better than the 2.1% average since the recovery began in 2009:Q3.
Although many analysts have been describing the decline in government purchases of goods and services during the last two quarters as reflecting austerity policies at the federal, state, and local levels, another relevant factor is that spending on goods and services is being crowded out by the budget demands of making growing transfer payments. This is part of a broader pattern that has characterized the last four decades, and is something that seems likely to continue over the next decades as well.
As the professor recognizes the answer to his question is yes, because for the past four decades our government has chosen to trade slower growth for “growing transfer payments.” As with unemployment slow economic growth is a function of just how much the government will put up with.
But the professor doesn’t paint the complete picture of how far our country has fallen by only looking at the past four decades. That does not tell the whole tale of just how bad the government has made the situation. Nor does real GDP alone tell the whole tale. As Menzie shared with us in an earlier post the GDP calculator at measuringworth.com tells us that under Keynesian economics and a floating currency real US GDP was 2.8% and nominal GDP was 6.8% for the past four decades. In contrast under a structure of classical economics and the gold standard for the entire 100 years of the 19th Century real US GDP grew at 4.1% while nominal GDP grew at 3.8%. What that tells us is that inflation has significantly sapped the strength out of GDP under a floating currency while under the gold standard even though the value of the currency did not change innovation and technology brought nominal GDP down below the real GDP.
While we see a decline in both the real GDP and the value of the currency over the past four decades in the 19th Century it was just the opposite.
Our government has chosen to push our economic environment into a state unprecedented in the history of our country.
It is simple to return to the growth rates and currency values of the 19th Century with the innovation of our modern world but it will require our political class to lose power. The question is did our Founding Fathers create a system that will allow the citizens to turn the government around or will we continue to empower the political class and continue the decline in power and wealth allowing another country to acquire world leadership?
Another sharp decline in Federal national defense spending reduced real GDP growth by 0.6 percentage points after reducing it by 1.3 points in the fourth quarter.
It does not seem likely that these negative impacts will continue at this rate, which should modestly increase real GDP growth in future quarters, other things equal. Sequestration, though, could have an impact.
JDH another relevant factor is that spending on goods and services is being crowded out by the budget demands of making growing transfer payments. This is part of a broader pattern that has characterized the last four decades, and is something that seems likely to continue over the next decades as well.
But keep in mind that over the last 40 years revenue supporting those transfer programs has exceeded expenditures. In that sense those same programs added to national saving; i.e., they represented “forced saving.” The problem was that those surpluses from transfer programs were used to reduce income taxes needed to support government purchases of goods and services.
Past surpluses could have been used either to offset income taxes or they could have been invested to improve future productivity, with returns from that higher future productivity being used for debt servicing of those various trust fund bonds. Our leaders took the path of immediate consumption and chose lower tax rates. In many ways this is similar to the choices that Britain and Norway faced in the 1980s with revenues from North Sea oil. Thatcherite Britain used the revenues to justify immediate tax cuts. Lefty-commie-pinko Norway applied those revenues to support a sovereign wealth fund. In hindsight it’s pretty clear which country made the better decision.
A quick look at the numbers from the BEA indicates that year-over-year private sector growth has been between 2.5% and 3.6% for each of the last 12 quarters, starting in Q2 2010. That seems to be relatively steady growth from that side of the economy, but producitivity gains and profit-hoarding have kept the growth from being translated into better wages for the vast majority of America.
If it wasn’t for consistent year-over-year cutbacks on the Government side of 0.7%-1.3% since the Census ended in Summer 2010, we’d probably be seeing decent level growth, and this wouldn’t be a topic. But austerity at both the federal and especially state/local sides have kept the growth in check, and did so again in this quarter.
The only slowdown concern I’d see comes from non-inventory private GDP, which was at the lowest since Q1 2011 (just under 1.5%). The sequester and crappy Spring weather could cause some bleed-over there for Q2.
But otherwise, just another moderate-growth report, and really not much different than the last 3+ years.
“A recession won’t occur until the expansion has ended, and the data shows there is still a bit more expansion ahead of us.”
Lolwut? Data isn’t forward looking. Anyway, we average a recession every what, 8 years? We’ll most certainly have another one before the next Presidents 4 years are up, which will certainly to destroy all those rosy growth/deficit projections.
So the “corrected” R&R data shows basically linear drops in GDP growth with increasing debt. And we’re shocked our growth continues to be “low?”