The conventional wisdom is that the big jump in interest rates since the beginning of May is the result of a poorly conceived or poorly communicated shift in policy by the U.S. Federal Reserve. The conventional wisdom is wrong.
Prior to the Great Recession, I thought we had all agreed on the practical limits on the Fed’s capabilities. We understood that to some extent the Fed could control the short-term interest rate by changing the supply of reserves available to the banking system. But we also understood that the Fed’s influence over longer-term interest rates was much less immediate and direct. The Fed can communicate its long-run inflation objectives, and certainly the 10-year inflation rate is a very important determinant of long-term yields. But regardless of what the Fed may say about its 10-year inflation goals, the market would form its own view of whether the Fed could or would achieve those. Other determinants of long-term yields, such as the term premium, long-run economic growth rate, and global saving and investment decisions were understood to be even farther beyond those things that the Fed can hope to control.
In the fall of 2008, the interest rate on U.S. overnight loans fell essentially to zero, and reserves ballooned far beyond levels that banks needed to meet reserve requirements. These developments meant that the Fed lost its most important policy tool for influencing interest rates. The Fed was forced to rely on even blunter instruments for conducting policy, such as hoping through massive asset purchases to alter the supplies and demands for assets such as Treasury bonds and mortgage-backed securities. You would think that in an environment in which the primary instrument of monetary policy is useless, the Fed has less, not more, control over long-term rates than it used to.
But somehow many observers seem to have persuaded themselves otherwise, thinking of the current interest rate on a 10-year Treasury bond as if it were a direct policy choice of the Federal Reserve. Among those who take this view, retirees have been mad at Bernanke for making the interest they earn on bonds so low, while many other observers are upset with Bernanke for now raising rates too quickly, threatening the struggling economic recovery.
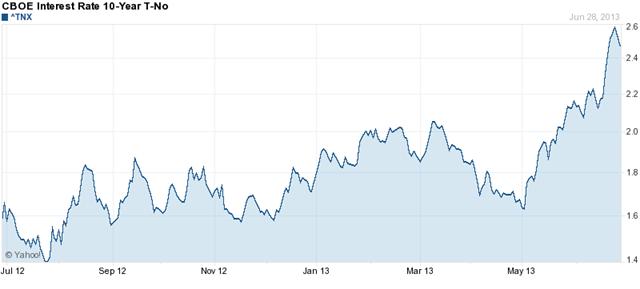
The yield on 10-year U.S. Treasury bonds is up 85 basis points from where it had been at the start of May. But only 13 basis points of that rise came on June 19, the day that the Fed released the statement from the latest FOMC meeting and Bernanke held a post-meeting press conference. Of course, just because rates were climbing before the Fed’s statement doesn’t mean the Fed didn’t cause them, as markets are always trying to (and usually do) anticipate the Fed’s moves before they are announced. And the fact that rates continued to rise another 27 basis points in the week after the Fed’s statement also doesn’t mean that the hikes weren’t caused by the Fed. Sometimes it takes a while for analysts to digest what’s been reported and figure out what it really means.
 |
But as I argued last week, it’s hard to see how the Fed’s statements on June 19 changed anything, even (and especially) if you had anticipated them verbatim 6 weeks before they occurred. The accurate message from those statements is that while the Fed is eventually going to stop its large-scale purchases, even slowing down the rate of purchase is still quite a bit down the road. That’s what a reasonable observer should have believed before June 19, and it’s what a reasonable observer should still believe today.
It’s also worth noting that the interbank loan rate in China has been climbing since May. Although the dramatic spike in Chinese rates came immediately after (and appeared to be caused by) the Fed’s statement on June 19, an earlier spike had hit Chinese banks in the second week of June.
 |
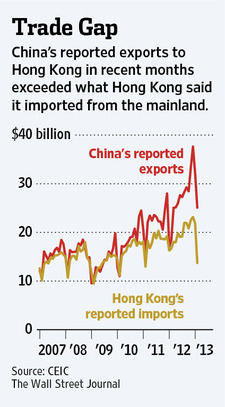
Some remarkable investigating by Izabella Kaminska documented that one important source of short-term funding within China had resulted from over-invoicing of exports, with loans extended for goods that never shipped. Evidence of this can be seen in an explosion of goods that Chinese companies claimed they had shipped to Hong Kong that are not matched by imports that entities in Hong Kong claim to have received.
 |
Business Week reported last May:
Slower growth in last month’s official trade data may reflect measures announced by China’s State Administration of Foreign Exchange (SAOFEZ) to crack down on speculative funds entering the country disguised as payments for trade.
The currency regulator said May 6 that it will send out warning notices to companies whose goods and capital flows don’t match as well as those bringing large amounts of cash into China. SAFE on May 22 told banks to improve checks of customer documents related to special trade zones amid speculation that the areas have been exploited to mask money inflows as exports.
The withdrawal of an important funding source would have created a sudden tightening of credit. One manifestation would be the interbank lending rate displayed in the first figure above. Another could be Chinese sales of other assets such as U.S. Treasury securities.
And broader asset sales outside the United States could be a more important development than anything that was said or not said by Ben Bernanke.
Clearly the “big jump” (hah!) in interest rates is due to massive public debt, or something.
Luckily for us the flailing is just starting to get entertaining.
So let’s assume then that China falls into outright recession, the sort of debt crisis we used to associated with emerging (rather than mature) economies. That’s my current working assumption. In response, let’s suppose the Chinese, to support their financial system, sell, say, $1 trillion of US govt bonds to cover domestic banking losses.
Were this to happen, it would seem that the price of Treasuries would fall, and the interest rate would rise.
Is that right? How might it play out?
There are a few oddities with the recent move in 10 year rates:
1. It has been associated with declining inflation expectations, not rising ones. 2. The negative impact on emerging market equities and bonds has been outsized relative to most people’s expectations. 3. Currency value changes have been strangely small (excepting the yen).
I like the China theory, as it explains these oddities better than the standard explanation that investors suddenly reinterpreted the timing of the Fed’s future actions.
Take a look at Plosser’s comments on May 14th in the context of that graph. Worrying chatter about tapering largely began with the altered text of the May 1st Fed statement, and intensified dramatically after Plosser’s speech.
James,
It seems that you don’t take into account (talking about short rates and reserves – “Fed lost its most important policy tool”) interest paid by FED on reserve balances (http://www.federalreserve.gov/monetarypolicy/reqresbalances.htm).
My bad, it basically started going up right after the May 1st Fed statement…
“You would think that in an environment in which the primary instrument of monetary policy is useless, the Fed has less, not more, control over long-term rates than it used to.”
Wow. Somehow you missed the fact that, since the primary instrument of monetary policy us useless (sic), the Fed had adopted a secondary tool that involved buying longer-dated Treasury paper, the very stuff that provides the benchmark interest rate for privately issued debt, and that the Fed has been buying longer-dated mortgage debt. Cause “you would think” that if the Fed began manipulating longer-dated debt, that the Fed might have more, not less, control over longer-term rates than it used to (have).
So, here’s how I read what you’ve written. The market did not comport with your views, so you’ve gone looking for something to confirm those views and you’ve come up with China. China is always a great fallback explanation, because China is to blame for everything. It’s just a coincidence that US rates began to rise at just about the time that the FOMC began to “clarify” its short-term policy outlook.
For a whole bunch of reasons, you really should put a bit more thought into the possibility that your view is simply wrong.
Steve, if that happened, I would have a hearty LOL I TOLD YOU SO while standing in the bread lines.
Excellent post, Jim. That graph of Chinese exports versus Hong Kong imports is interesting.
Regarding US rates, let’s keep in mind that even though they’ve run up quite a bit the past month or two, they’re still at historically low levels. Even just four or five years ago no one would have dreamed about buying a house with a 4% mortgage.
Save me a spot, Anon.
China is now firmly on my radar for the oil business.
As an industry, we are not able to handle the pressure of increasing exploration and production costs, rising at 11% a year; and declining Brent prices, down $10 from two years ago.
If China goes down, the oil price could go down even further (although it’s hanging in there), and that would really tank the industry.
So we now have to develop a cyclical view of China. Ask me in a month, and I’ll have an opinion on the matter.
JDH wrote:
The conventional wisdom is that the big jump in interest rates since the beginning of May is the result of a poorly conceived or poorly communicated shift in policy by the U.S. Federal Reserve. The conventional wisdom is wrong.
Could we have all the talking heads in the financial media go to the black board (or white board) and write this 100 times!!!
Great post professor. There is so much fantasy thinking out there it is amazing.
You are spot on. The FED has weak if any control on interest rates. There most powerful tool is to destroy segments of the economy and watch as failing businesses “prevent an overheating economy.” Of course the FED is not close to the destructive power of congress and the President.
Alexander, do you really believe that financial institutions are stampeded by o.25% in interest payments? Bernanke’s claim that he can control excess reserves by changing the interest rate on reserves is nothing but hogwash intended to pacify the financial press.
The sooner we recognize the real impotence of the FED the better. It can destroy but it cannot build.
I agree with benamery21. The Fed changed its message in May and the market reacted.
Some of the issues in the markets are trading concerns. Those are complicated, but one basic point is that rates are so low there is almost nothing in any position to hold you there; you aren’t going to stick in a position and ride out any short term wiggles because there isn’t enough yield in that position, only potential loss.
When the 10 year (sort of) crossed over from negative real yield to positive, a lot of people took that as a signal. It is, if only because you can focus on that and talk about it. That inflation is coming in even lower then reinforces the rather sensible view that we’re looking at real rates out there. That has not only been a signal for short rates – which people I think agree may not hold – but it makes you look at your positions. You suddenly see the downside risks are big.
Does it hold is a big question. If the Chinese economy actually slows, if Europe continues to flail, we may look back at this as a high point before lousy conditions dragged us back down.
I think that Steven Kopits is probably among the best in the world when it comes to demand side analysis, but something to keep in mind regarding China & India is that recently their oil production has stagnated. It’s basically been flat at 5.0 mbpd (EIA, total petroleum liquids + other liquids) from 2010 to 2012 inclusive.
When US oil production peaked in 1970 (and we are still about 25% below our 1970 peak crude oil production rate), the rate of increase in US net oil imports increased from 11%/year (1949 to 1970) to 14%year (1970 to 1977).
Note that the 2005 to 2012 rate of increase in Chindia’s Net Imports (8.3%/year) was actually below the post-1949 rate of increase in US net oil imports.
On May 31 Krugman did a simple chart analysis of the rise in long rates and concluded it meant “Stronger recovery”:
http://krugman.blogs.nytimes.com/2013/05/29/rate-stories/
The key thing was the dollar and the stock market were both up at that time.
But with the benefit of hindsight we see that the S&P 500 had peaked on May 21 and whereas it was only down 0.9% on May 30, it is now down much more than that. Thus Krugman’s nifty little chart analysis is now saying “Tougher Fed”.
So what happened on May 22? Two things.
According to Business Week:
“SAFE on May 22 told banks to improve checks of customer documents related to special trade zones amid speculation that the areas have been exploited to mask money inflows as exports.”
But May 22 was also the date of the Bernanke’s testimony before the Joint Economic Committee and when the minutes from the previous FOMC meeting were released (it was a busy day).
In his testimony Bernanke said:
http://www.federalreserve.gov/newsevents/testimony/bernanke20130522a.htm
“Unfortunately, withdrawing policy accommodation at this juncture would be highly unlikely to produce such conditions. A premature tightening of monetary policy could lead interest rates to rise temporarily but would also carry a substantial risk of slowing or ending the economic recovery and causing inflation to fall further. Such outcomes tend to be associated with extended periods of lower, not higher, interest rates, as well as poor returns on other assets. Moreover, renewed economic weakness would pose its own risks to financial stability.”
And the FOMC minutes, released hours later, said:
http://www.federalreserve.gov/monetarypolicy/fomcminutes20130501.htm
“A number of participants expressed willingness to adjust the flow of purchases downward as early as the June meeting if the economic information received by that time showed evidence of sufficiently strong and sustained growth; however, views differed about what evidence would be necessary and the likelihood of that outcome. One participant preferred to begin decreasing the rate of purchases immediately, while another participant preferred to add more monetary accommodation at the current meeting and mentioned that the Committee had several other tools it could potentially use to do so.”
So maybe it’s China and maybe it’s not. But even if China is a factor, China is not responsible for how the Fed reacts, or fails to react, to changing economic conditions. If monetary policy is getting tighter the Fed probably should do something rather than nothing.
Don’t forget other emerging markets that are big holders of Treasuries as well. Brazil in particular has been seeing some stress with the Real falling. We’ve recently seen a firming in the Brazilian currency. Has Brazil been selling Treasuries to support their currency? I also wonder what other Asian central banks are doing to offset the weakening Yen. Would Korea, for instance, sell US Treasuries to buy JGBs? There are lots of reasons Treasuries may have sold off and any blip down would also put stress on any leveraged players in the market. I have no idea where people got the idea the Fed can control the long end of the market but it simply isn’t true.
As Steven and I have discussed, we seem to be seeing something of a confluence between the price floor necessary to continue to support a high rate of drilling in US tight/shale plays and the price ceiling, beyond which we see a decline in aggregate demand.
In any case, the 2002 to 2011 rate of increase in annual Brent prices was 17%/year. Brent was flat in 2012, and then down somewhat. It seems very likely that a major contributor to recently flat to down global crude oil prices was the large increase in US oil production + a continued decline in US oil consumption, but as noted below it’s going to get harder and harder for US oil companies to just maintain current US crude oil production.
Following is my brief summary, in a bullet points format, of the Global export market and US oil & gas production:
Global Net Exports
EIA data show that what I define as Global Net Exports of oil (GNE) have been below the 2005 rate for seven straight years, with the developing countries, led by China, consuming (so far at least) an increasing share of a post-2005 declining volume of GNE.
Available Net Exports
I define Available Net Exports (ANE) as GNE less Chindia’s Net Imports (China + India). ANE fell from about 41 mbpd in 2005 to 34 mbpd (million barrels per day) in 2012, an average annual decline of one mbpd per year in the volume of exported oil available to importers other than China and India.
I examined this topic in the following paper on what I call the Export Capacity Index (not yet updated with 2012 data):
http://peak-oil.org/2013/02/commentary-the-export-capacity-index/
US Crude Oil Production
While the current increase in US crude oil production is very helpful, the steady increase in the decline rate from existing production means that the US oil and gas industry is facing enormous challenges in just trying to maintain current production levels, and in all likelihood we will continue to see an “Undulating Decline” pattern in post-1970 US crude oil production (currently US crude oil production is about 25% below the 1970 peak annual rate).
As noted in the following article, if we assume a probably conservative average year over year decline rate in existing US crude oil production of 10%/year from 2013 to 2023, the US oil industry would have to replace, over a period of 10 years, the productive equivalent of 100% of current US crude oil production, in order to maintain the current US crude oil production rate:
http://www.resilience.org/stories/2013-06-10/commentary-is-it-only-a-question-of-when-the-us-once-again-becomes-a-net-oil-exporter
US Natural Gas Production
A recent Citi Research report puts the current year over year decline rate in existing US natural gas production at about 24%/year, which implies that the US has to replace virtually 100% of current US natural gas production in the next four years, in order to maintain the current US natural gas production rate.
Note that a 24%/year decline rate in existing natural gas production would require the industry to put on line the productive (peak rate) equivalent of 30 Barnett Shale plays from 2013 to 2023, in order to maintain the current US dry natural gas production rate of 66 BCF/day.
Bottom Line
The bottom line for developed net oil importing countries like the US is that (so far at least) we are gradually being shut out of the global market for exported oil, via price rationing.
Definitions:
GNE = Combined net exports from top 33 net oil exporters in 2005
Net Exports = Total petroleum liquids + other liquids production less liquids consumption (EIA)
EIA Production Data for 2002 to 2012:
http://www.eia.gov/cfapps/ipdbproject/iedindex3.cfm?tid=5&pid=55&aid=1&cid=regions&syid=2002&eyid=2012&unit=TBPD
EIA Consumption Data for 2002 to 2012:
http://www.eia.gov/cfapps/ipdbproject/iedindex3.cfm?tid=5&pid=5&aid=2&cid=regions&syid=2002&eyid=2012&unit=TBPD
Professor,
I have been thinking about the implications of what the FED can actually do. It is pretty clear that the FED cannot “stimulate” anything. As you note it has virtually no control on interest rates.
But we do know that by its actions the FED can destroy. It can create conditions that harm economic growth. This brings me to one of my primary concerns with the Keynesian theory of stimulating when the economy is weak then restricting when the economy is good.
If we recognize that the FED can destroy but cannot stimulate then it is easier to recognize that the theory of central planning of “stimulate the constrict” will only have the result of creating a declining economy. If the FED is unable to stimulate growth but is able to constrict growth then such FED actions will average the economy down. While Keynes believed in stabilizing the economy to mediocrity such actions that weigh decline over growth results in more and more decline.
This is another example of bad theory leading to economic decline.
What’s the trade volume in the secondary market for 10 year treasuries? In other words, how much selling is driving this rate increase? Or, how much would QE4 have to expand to offset it?
@jeffreybrown
if i read you right: there’s trouble ahead!
Holy heck. I’m very pleased to see this article.
I do believe, however, that people are using conventional perceptions of cause-effect relationships to incorrectly judge the FED’s capabilities, actions, and subsequent effects on the economy (on BOTH sides of the aisle).
This unfortunately really does cause most to miss the full extent of the potentiality of the FED’s impact through its policy tools (funds rate, velocity of purchases, retention of accumulations, size of purchases, forward guidance, etc.).
The accumulation of reserves is in and of itself an effect…an effect whose present impact (and potential future impact) on financing should not be underestimated or projected simplistically.
Methinks that ultimately, this QE is a form of market-risk-underwriting combined with debt-interest-control. The FED funds rate is a separate yet intertwined component of the total monetary policy.
Linear extrapolation & changing expectations are the bane of formulaic projections.
Thank you very much for this nice article. Please labor to ensure that your students learn how to read & understand basic English. It seems the media, and many market participants, are unable to do so.
benamery21,
You wrote:
“What’s the trade volume in the secondary market for 10 year treasuries? In other words, how much selling is driving this rate increase? Or, how much would QE4 have to expand to offset it?”
I happen to have some related data at my fingertips.
As you know, the Fed has stated that it is buying $45 billion a month in Treasuries. According to SIFMA, in April average daily trading volume of Treasuries (counting TIPS) was $530.2 billion. So the Fed is supposedly a purchaser in 0.28% of daily Treasury trades.
Also according to SIFMA, the trading volume of Treasuries with more than 6 years in remaining maturity was $168.2 billion, or about 32% of the total Treasury daily trading volume. And, according to the Federal Reserve balance sheet, holdings of Treasuries with more than 5 years in remaining maturity increased by about $16.6 billion in April whereas total holdings of Treasuries increased by about $41.7 billion, so Treasuries of longer remaining maturity represented about 40% of the increased holdings. In other words purchases of Treasuries of longer remaining maturity are roughly in proportion to their relative daily trading volume.
The increase in US bond yields was preceded by a sharp rise in Japanese yields an the rise in US yields was accompanied by similar increases in British, German and other countries bond yields.
Yet it almost a universal conclusion among analysts and commenters that this had no impact on US rates.
I for one find this essentially un-understandable.
Can someone explain to me in simple terms why I should ignore these developments?
Some facts of the day:
The global oil business has spent $3.5 trillion on upstream spend–for exploration and production–over the last seven years. That’s more than the GDP of Germany.
The increase in upstream spend over the past seven years, compared to the previous seven years, was $2 trillion. That’s more than the GDP of Italy.
For that incremental $2 trillion, we were able to increase the oil supply by a modest 4.1 mbpd or 5% (0.7% per annum).
In the previous seven years (through 2005), we were able to increase crude oil production by 8.6 mbpd, on total upstream spend of $1.5 trillion. Not incremental spend, total spend.
And it’s worse than that. Of the 4 mbpd gain to 2012, half was natural gas liquids, not crude oil at all. Conventional production, including Iraq and all the legacy producers but excluding US and Canadian unconventionals and incremental NGLs, fell by about 1 mbpd from 2005 to 2012.
In other words, $3.5 trillion dollars in spend was not enough to arrest the decline of the conventional base as it existed in 2005.
For conventional production, 2005 remains the peak year.
So let’s assume that it’s all China’s fault. That was 6 weeks ago. Wouldn’t that be an argument for the Fed increasing its bond purchases rather than sending out trial balloons about “tapering”? Explaining a possible cause is not the same thing as explaining away inaction. The Fed’s inaction certainly didn’t help matters irrespective of whether conventional wisdom is right or wrong.
And are we supposed to believe that a crack reporter knew about the export/import imbalance before Team Bernanke did? So the Fed issued its “tapering” policy statement without any whiff of understanding of China? Really? Is that what we’re supposed to believe?
The 10-year yield rose from its May 1st low mainly for two reasons: the announcement effect of the probable unwinding of QE3 this fall to be completed around April, and the flow of economic numbers. Early announcements about tapering off QE occurred 3 days in May in comments by 2 district presidents and the Fed chairman. On those 3 days, the 10-year yield rose 4, 8, and 9 basis points. Another day can be added when S&P changed its guidance for the credit rating of US Treasuries from negative to stable adding to expectations of tapering. Yields rose another 5 bp. Then the press conference after the June FOMC meeting where the announcement effect spread over Wed, Thurs, and Fri raising yields 13, 8, and 11 bp. Total announcement effect – 58 bp. As the overall move from May 1st to the Friday after the FOMC was 86 bp, it’s a fair judgment that two-thirds of the up move in yields was announcement effect. On just 3 days during this period – those of the May and June employment report releases and on May 28th when the Case-Shiller and Conference Board confidence indices came out – yields jointly rose an additional 35 bp. The rest of the time was a mostly neutral flow of reports with small offsetting ups and downs that if anything held back the rise in yields.
Technical conditions also added to the rise in yields off the May 1st bottom. Going into May 1st, the market was quite overbought. By Friday June 21st, the market had reached one of the most extreme oversold conditions of the past 20 years. The initial unwinding from greatly overbought to the opposite of extremely oversold by the end of the move also was causal of yields over this period. This type of causality nets out over the long trend. But for a swing of less than 60 days its effect is every bit as real as that of fundamental factors.
At the granular level of days, this is as clear and robust an explanation of the move in the 10-year as can be expected. Now that the preliminary announcement effect is in the market, and considerable oversoldness remains to be dissipated, there is no reason for yields to rise any further until something new happens. Other things equal, of course. In particular the flow of reports going forward. A spate of good economic and bad inflation numbers would definitely take yields higher.
Even more germane for the road ahead is the implication for bonds of the two offsetting effects of QE. I label these the current buying effect (reversed once the Fed throttles back the flow of buying) and the economic stimulus effect. As the Fed buys fewer bonds, yields unambiguously rise because fewer are being taken off the market. But at the same time, the reduced flow of liquidity will take steam out of asset markets and eventually reverse them and their wealth effect. Other non-interest rate channels as well lead from base money to growth and inflation. On net, the reduced flow of liquidity to the economy will outweigh (by a modest amount) the current buying effect. As the Fed unwinds QE3, longer yields will fall modestly (again dependent on the flow of economic reports). I well understand this is not conventional belief, but there is support for it in the literature.
@stevenkopits:
Between you and J. Brown, the problems in the bond markets are small potatoes compared to what the oil market is about to do to us.
@anon2
My premise for some time has been that the huge increase in public debt in net oil importing OECD countries, largely financed by accommodative central banks, has primarily been in response to constrained global oil supplies, as net oil importing OECD countries try to keep their “Wants” based economies going.
In my opinion, the reality is that we are seeing a fundamental transformation, from an economy focused on meeting “Wants,” to an economy focused on meeting “Needs.”
Meanwhile, despite all the evidence to the contrary, the conventional wisdom is that high oil prices are temporary, and we will soon be back to cheap and abundant crude oil supplies.
Kopits: Investments in end-use fuel switching and efficiency are significantly more cost-effective. My mental numbers are a bit dated, but I believe we could permanently reduce U.S. oil consumption by roughly 5% for less than $100B, simply by replacing oil and propane space and water heaters (either to gas or to heat pump with wood stove backup as needed).
Converting our 25,000 locomotives to dual-fuel and using LNG would reduce oil consumption by 1% for less than a few billion.
The national interest, and indeed the global interest, is sufficient to justify public funding of this transition.
More evidence of what Steven Kopits has been talking about regarding the cost/price squeeze in the upstream sector:
Batista’s Woes Deepen as He Suspends Development of Brazil Oil Fields
http://online.wsj.com/article/BT-CO-20130701-707054.html
Excerpt:
Incidentally, a few years ago, Bloomberg ran a column about Brazil, a net oil importer, “Taking market share away from OPEC.” Even if we count biofuels, Brazil is still a net liquids importer, with a recent pattern of increasing net imports.
Bena –
Some of the conversions and efficiency measures you are describing are already occurring or in the works.
I think we need to pick up the pace. I believe Jim has also made that point in an earlier post.
Kopits: Yes, the currently prevailing rate of fuel-switching and energy efficiency improvements is far too low, even with the policy inducements currently in place. There are several reasons for this (energy gap means individuals and firms are leaving private benefit on the table, and externalities that mean some of the benefits can’t be captured by private investment). Ignoring the many other benefits, there are significant economic benefits for the U.S. in structurally reducing oil demand faster/smarter than reductions which would be driven by insufficient economic carrying capacity.
I believe the public benefits of reducing oil demand are great enough to justify significantly stronger public policy. In the current economic conditions, the first policy to take is to give away free stuff (funded by federal debt), while mildly penalizing those not taking advantage of said free stuff to fulfill their civic duty. This has the added advantage of fiscal stimulus, in a world where we’ve been at the ZLB for years. In a stronger economy raising the gas tax would be the first place to start.
I usually like Kaminska’s stuff, but her recent pieces on the RMB have been nonsensical. So part of the story in China is that people were using export invoicing to do a collartorized carry trade between the USD and RMB. How does the unwinding of this trade, which is a decrease in USD borrowing by chinese enitites, cause long term rates in the US to go up?
I guess this is why this non-sequitur is thrown in at the end of the post: “Another could be Chinese sales of other assets such as U.S. Treasury securities.” Why would a tightening of credit in the China cause a sale of Treasury Securities in China, when treasuries are held by the central bank? Plus there is the fact that there is zero evidence that anyone in China is selling treasuries.
The whole argument isn’t even wrong, it’s just nonsense.
Bena –
In a supply-constrained model, raising gasoline taxes tanks the economy.
The point is not to reduce oil consumption, but to increase affordable mobility.
A H: Do I understand correctly that you are not disputing that the sharp rise in Chinese interbank rates is due to the disruption of disguised carry-trade financing?
If you grant that Kaminska has identified an important reason for the sharp rise in Chinese interest rates, it is odd that you find nonsensical the suggestion that this development could also affect other interest rates globally. The fact that interest rates move together is basic arbitrage. If as a borrower I’m having trouble getting getting cash in one market, I’ll try to liquidate other assets or borrow more on another. As a lender, given a higher rate offered by borrowers in one market, I’m less inclined to hold other assets unless they offer a higher rate as well.
I agree that Kaminska’s proposed mechanism of deliberate central bank intervention to stabilize the exchange rate is perhaps not the most important channel for the transmission from the Chinese interbank interest rate to other rates. I also agree that it would be important to document exactly who is doing what to implement the arbitrage.
Jim, you’re right that the fed is not all powerful especially over long rates, and you’re right to look globally for explanations of global events, which surprisingly few American economists ever do. But, in this case you’re barking up the wrong tree. The big move in global long rates has been overwhelmingly driven by fed communication since May 22 that brought forward market estimations and increased uncertainty over when short rates might rise. The action in China was indeed a corollary move as were all kinds of repositioning across EMs, for well known reasons. I disagree though with the “mis”communication interpretation. The fed has been roughly correctly interpreted. Arguably markets wrongly interpreted earlier fed communication and overbet on “qe infinity”. But I would just chalk it up to live markets second guessing a moving target. This always happens around the fed’s pivots from loosening to tightening.
Steven Kopits wrote:
The point is not to reduce oil consumption, but to increase affordable mobility.
Could we please make every member of congress recite this every time they take a vote on transportation, fuel, or the factors of such production.
Kopits: Agree, which is why I said “in a stronger economy” I don’t think oil supply constraints explain the totality of the underlying weakness in the economy. In a stronger economy, gas should bear the burden of its direct costs, as well as externalities. Last I checked gas taxes only covered 1/3rd of the direct cost of roads at all levels of government. Further, it’s arguable that it covers less than that since in most states motor fuel is exempt from sales tax.
I won’t be proposing increased fuel taxes anytime soon, given the state of the economy.
JDH: “If as a borrower I’m having trouble getting getting cash in one market, I’ll try to liquidate other assets or borrow more on another. As a lender, given a higher rate offered by borrowers in one market, I’m less inclined to hold other assets unless they offer a higher rate as well.”
Yes exactly. The cash crunch in China was (partially) caused by the Chinese authorities disrupting this very arbitrage opportunity.