World oil production stagnated between 2005 and 2007, which given rapid growth in demand from emerging economies sent oil prices shooting up. Some observers suggested that production might never rise much above the levels seen in 2005. Among those who raised this possibility, two of the more thoughtful have changed their mind. Euan Mearns last month summarized what he saw as three (or four) nails in the coffin of peak oil. And Stuart Staniford, an early editor and contributor for the Oil Drum, declared a few weeks ago that the data have spoken.
Certainly world oil production did not stop growing in 2005. Last year’s total was estimated by the EIA to be 4.8 million barrels higher each day than it had been in 2005.
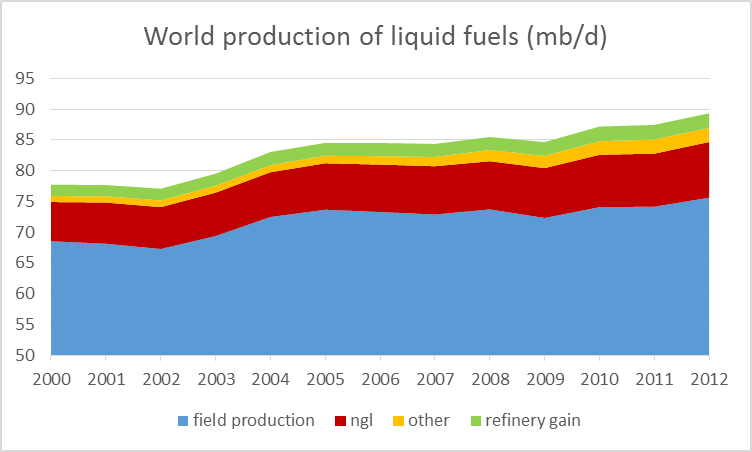 |
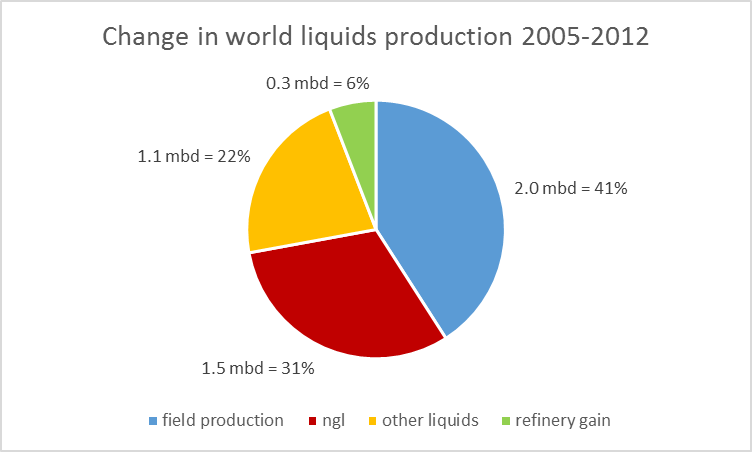
About a third of the growth between 2005 and 2012 came in the form of natural gas liquids, chief among which are ethane and propane. These are useful hydrocarbons, but you can’t use them to power your car. The growth in NGL production has been a big benefit to industrial users of these chemicals; for motorists, not so much. Another important source of gain has been biofuels, which themselves require a significant energy input to produce. Actual field production of crude oil, which accounted for 87% of the total liquids produced in 2005, accounted for only 41% of the growth since 2005.
 |
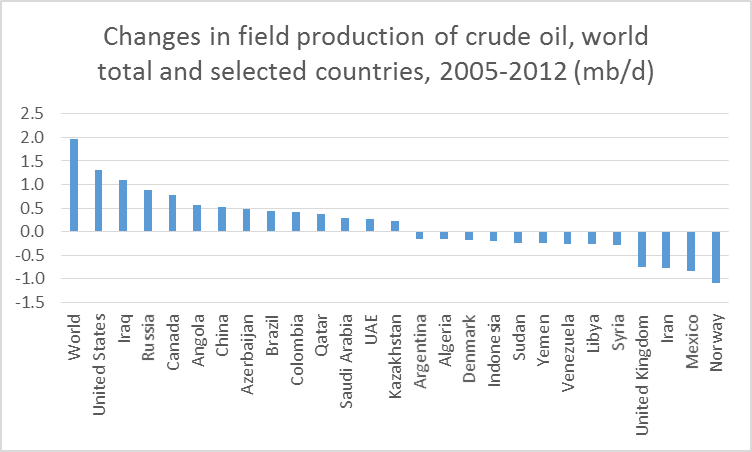
It’s also interesting to look at where the growth in field production came from. U.S. production grew by 1.3 mb/d and Canada by 770,000 b/d. Between them, these two countries could account for more than 100% of the 2.0 mb/d increase in world crude oil production since 2005, Production from all of the other countries in the world combined actually fell a little between 2005 and 2012. Significant gains in places like Iraq, Russia, and Angola were more than offset by declines in the North Sea, Mexico, and Iran.
 |
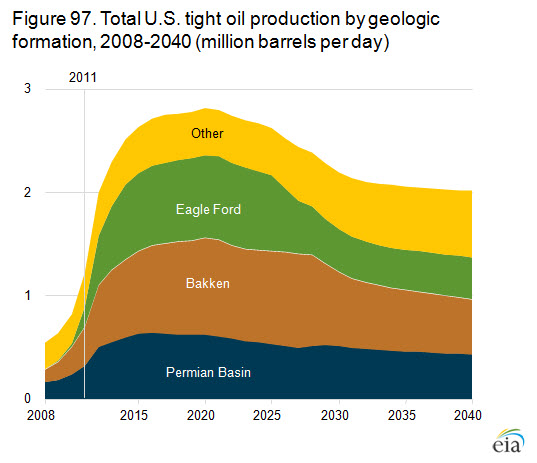
Within the United States, more than all of that 1.3 mb/d increase could be attributed to production of oil from tight formations, which the EIA estimates accounted for 2.0 mb/d of total U.S. oil production in 2012. And within Canada, more than all of that 770,000 mb/d increase could be attributed to production of liquids from oil sands, which the National Energy Board estimates increased by 830,000 b/d between 2005 and 2012. In other words, without oil sands and tight oil, crude oil production in the United States and Canada, and for that matter the world as a whole, would have been lower in 2012 than it was in 2005.
The EIA anticipates that U.S. tight oil production can continue to increase another 800,000 b/d above 2012 levels before peaking in 2020.
 |
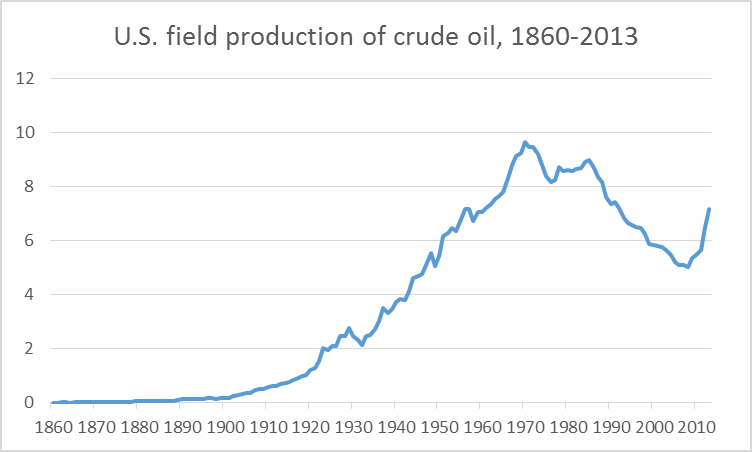
It’s interesting to put these numbers in the perspective of the entire history of production from America’s bountiful supplies. The surge over the last two years is unprecedented. Even so, the levels for the first half of 2013 remain 2.5 mb/d below the peak of 1970. If the EIA projections above are correct, none of this is going to change the fact that U.S. production peaked 40 years ago. Instead, tight oil will give a dramatic but temporary bump back up in a longer trajectory of decline, similar to that provided by new production from Alaska in the mid 1980s.
 |
The new sources of liquid fuel do not come cheap. Production from oil sands and tight formations could not be sustained if the price of oil were to return to the levels to which we were accustomed before 2005. Euan Mearns concluded his obituary for peak oil with these thoughts:
The new higher oil / energy prices are here to stay but I believe they will stay range-bound in $100 to $150 / bbl bracket, perhaps for decades as we munch our way through the $125±25 slab of resource.
That’s a plausible assessment, but Stuart Staniford notes an important qualification:
As I write, Libya, Tunisia, Egypt, Syria, Lebanon, Iraq, and Iran are all subject to varying degrees of economic and political turmoil…. I assume at some point a large oil producer will descend into turmoil and then there will be a large price spike, and that may kick the global oil market out of the current meta-stable state.
To which I would further add, a major economic downturn in China would send the price of oil plunging back down.
Those who thought that world oil production would peak in 2005 have been proven to be wrong. But so, too, were those who thought the run-up in oil prices of the last decade would be a temporary disruption until we found a way to return to the world as it had been for a century up until that point.
“Those who thought that world oil production would peak in 2005 have been proven to be wrong.”
Adjust production and oil exports for population growth and the statement above is wrong.
Look at real GDP per capita from ’00, ’05, and ’08 and the persistent constraint from the tripling of the average price of oil on growth of real value-added output per capita is obvious.
Deep, tight, and tar oil extraction and renewable capacity for electricity has been booming even as growth of US domestic consumption consumption of oil, gasoline, and electricity per capita is not growing because of flat or decelerating growth of real GDP per capita.
Regressing the trend rates of increase in the price of crude oil and US crude extraction since ’08, in order for US extraction to continue growing to, say, 10Mbbl/day by ’16, the price of oil will need to rise to $200/bbl ($5.25 gasoline), and to well over $400/bbl ($10 gasoline) for 16Mbbl/day by ’20.
However, there is a log-linear limit bound constraint for the price of oil to extraction, final demand, and real GDP per capita at $100-$110, which is where we are today.
Therefore, US extraction is peaking at a price that constrains extraction and growth of real GDP per capita. The high fixed cost of extraction will again reduce US extraction to 5-6Mbbl/day during the next recession in real GDP per capita, which is increasingly likely going forward.
One of the little ironies of many “Peak Oil is Dead” is dead stories is that the authors are usually using what is so far a (crude oil) post-peak region, the US, to claim that “Peak Oil is Dead.” As you noted, I think that post-1970 US crude oil production is best characterized as showing an “Undulating Decline.”
Regarding global production, the long term (1930 to 2005) and 2002 to 2005 rates of increase in global Crude + Condensate (C+C)) production were about the same, on the order of about 3%/year. “Gap” Charts for Global C+C and for Global Net Exports (total petroleum liquids + other liquids) follow, showing the gaps between where we would have been at the 2002 to 2005 rates of increase versus actual post-2005 data, by year. Of course, annual Brent crude oil prices approximately doubled from $25 in 2002 to $55 in 2005, and then doubled again, from $55 in 2005 to $112 in 2012 (with one year over year annual decline, in 2009).
C+C Gap Chart:
http://i1095.photobucket.com/albums/i475/westexas/Slide1_zpsddc49796.jpg
GNE Gap Chart:
http://i1095.photobucket.com/albums/i475/westexas/Slide1_zps3161a25b.jpg
Note that I estimate that we have already burned through about one-fifth of post-2005 Global CNE (Cumulative Net Exports). A similar extrapolation for the Six Country Case History* produced a post-1995 CNE estimate that was too optimistic.
*Six major net exporters, excluding China, that hit or approached zero net exports from 1980 to 2010.
Following is a link to my Export Capacity Index (ECI) article and excerpt from same:
http://www.resilience.org/stories/2013- … city-index
And a Six Country example of production versus CNE depletion:
(Post-1992 production as a percentage of 1992 production, versus remaining post-1992 CNE, by year)
http://i1095.photobucket.com/albums/i475/westexas/Slide1-27.jpg
The doomsayers of “Peak Oil” are as bad as the doom mongers of man-made global warming. It is always exciting to think that we live in special times and face insurmountable challenges but the fact is it is all bull.
There simply is NO shortage of fossil fuels for the foreseeable future (at least 600 years and probably much more).
As oil prices rise from inflation, higher rent from rentier states, higher consumer taxes and increasing demand resulting in extraction from higher cost deposits, inevitably conservation will eventually kick in and ultimately global population/consumption will balance. Ultimately most fossil fuel will be left in the ground once a viable alternative is found. (And viable is NOT Solar, not Wind nor Tidal power which are a waste of tax dollars – viable would be something new like a fusion reactor)
James Cameron’s Avatar is an awesome work of art but the idea that we could ever run short of resources on Earth is totally ridiculous.
Jeffery, you should have READ the ARTICLE, not just the title.
The production increase came from a DEFINITION Change. Now, we’re including Natural Gas, which doesn’t run are auto fleet. Now, were counting the shit oil known as tar sands, which has more then twice the pollution of water, and twice the energy requirement to refine.
This is EXACTLY the Definition of Peak Oil.
Mike9,
You might want to look at the graphs linked above, and I noticed that the full link to my recent paper on net exports was not posted. You might want to peruse the following article, which can also be found by searching for: Export Capacity Index. I have once or twice opined on the topics of Peak Oil and Peak Exports.
http://www.resilience.org/stories/2013-02-18/commentary-the-export-capacity-index
In any case, there has been no change in liquids definitions. There are four basic categories:
Crude oil (Crude + Condensate, or C+C)
Total Petroleum Liquids (C+C+NGL’s)
Total Petroleum Liquids + Other Liquids (C+C+NGL’s + mostly biofuels)
Total Liquids (all liquids, including refinery gains)
The EIA is not counting natural gas as liquids production (although for reserve purposes companies frequently convert natural gas reserves to barrels of oil equivalent). The EIA is counting natural gas liquids (NGL’s) as liquids production.
“My basic premise is that the net oil importing OECD countries are maintaining something resembling “Business As Usual” only because of huge and almost totally overlooked rates of depletion in post-2005 Global and Available Cumulative Net Exports of oil.”
Jeffrey, emphasis on “rates”, which in my experience is where most get lost. Then add population growth to the rate factor, and you’ll be lucky to reach 1 in 1,000.
“This is EXACTLY the Definition of Peak Oil.”
Mike9, correct.
I am convinced that the vast majority of people do not understand Peak Oil, Jeffrey’s ANE and ECI, and the implications, even as the structural effects are occurring right before our eyes all around the world.
There is no incentive for the financial, corporate, and political powers that be to inform the mass public about Peak Oil and the implications for the oil-, auto-, and debt-based
economy and the civilization it supports. The have little to gain and credibility, legitimacy, public confidence, and power to lose.
With respect to crude oil production per capita I earlier referenced, the world is now where the US was in the mid- to late ’70s at the onset of US deindustrialization and financialization.
Just watch what happens to global real wages and real GDP per capita growth hereafter as crude oil and oil exports continue to decline in per-capita terms with the high price of oil and the increasing extraction costs per bbl and as a share of GDP.
As Means noted, conventional oil production *did* peak in 2005. The gap has been filled by expensive “Tier 3” assets that decline quickly such as shale oil. Sub-$50/bbl oil is in the rear view mirror.
Whale oil peaked, kerosene peaked, buggy whips peaked.
Real economics is about innovation and entrepreneurs, not about questionable statistics pulled from estimates. Why is it athat most economists discount the connection between the oil price and oil production or alternative fuels. For example, certainly right now automobiles are powered by gasoline. Gasoline is cheaper per gallon that water so of course gasoline will be used for fuel. Let the price of gasoline increase significantly and see just how long it takes for entrepreneurs to find a way to use ngl powered cars.
All the fatalists want to pull us all into a hole and cover our heads, but that is just the reaction that will bring disaster. The right reaction is to release the creativity of men to produce energy. Throughout history man has struggled with producing heat and energy, and throughout history man has found new and innovative ways to do that at a cheaper and cheaper price per capita. Don’t let you econometrics drive you to support tomorrow’s solutions. Let the prices rise; let the oil be depleted. If they come they will be the catalyst for the energy of tomorrow.
This is the difference between the analysis of a central planner and a true free market capitalist.
Very good post as usual.
It seems that the peak oil theory in the 2000’ was not supposed to forecast such a large peak in the price of oil, from 20$ to 100$, in just a few months.
The consequences, after five years of these very high prices, could be discontinuity in demand, as well as discontinuity in supply ; where peak oil theory supposed continuous supply and demand volumes.
On the demand side, with OECD countries like the PIIGS having real difficulties with their huge trade deficits. The question could be even worse and more brutal if a large EME oil importing country, where energy subsidies are usually unsustainable, went bankrupt with civil disorder consequences, and a fast drop in demand …
On the supply side, with many oil producers countries, which economics are already sick from the “Dutch disease”, following key countries like Nigeria, Libya or Iraq on the road to civil war, massive theft, war …
Are these discontinuities the new normal “trend” of years to come ? Is volatility (of volume ; of prices) the new normal for the world economy ?
Best regards
Hi,James, Yellen is coming and the future is bright !
I.e. there will be enough oil and money around to pump up the engine, bet McBride was right again.
Ricardo:
While we frequently talk about the production of oil and gas, it is more accurately characterized as the extraction of oil and gas. From the Wikipedia entry for Conservation of Energy:
Having said that, in my opinion our remaining supplies of oil and gas should be viewed as a bridge toward a far less energy intensive future, powered primarily by wind + solar, with a heavy reliance on electrified transportation.
However, the dominant story line being presented via the MSM is that there is no problem with a virtually infinite rate of increase in our consumption of a finite fossil fuel resource base, at the same time that the data show what is probably a catastrophic rate of decline in the remaining post-2005 supply of Global CNE (Cumulative Net Exports), with the developing countries, led by China, so far at least consuming an increasing share of a declining post-2005 volume of Global Net Exports of oil.
Just a point of clarification on the statements like “natural gas can’t run cars” or “propane can’t run cars”: neither can run the vast majority of today’s cars without modification; both can run cars designed for those fuels without any trouble. Yes, the delivery infrastructure is currently inadequate. And yes, neither fuel provides the same energy density as gasoline or diesel. But we are already seeing considerable experiments in various fleet operations to make use of both.
+1 for Ricardo. Only academics in cotton wool worry about silly things like running out of oil. Practical people know that higher prices will drive ingenuity to find alternatives.
Bruce:
No argument about people having trouble understanding multiple exponential functions.
I frequently use the “Midnight on the Titanic” metaphor. At midnight, about 20 minutes after the ship hit the iceberg, perhaps three people on the ship (about 0.1% of the people on board) knew that the ship would sink. However, the probability that 99.9% of the people on the ship did not know, around midnight, that the ship would sink did not mean that the ship was not sinking.
The Export Capacity Index (ECI) is the ratio of total petroleum liquids + other liquids production divided by liquids consumption for a net oil exporting country (EIA data). It’s roughly equivalent to the income to expense ratio for a company or a group of companies.
Given an ongoing decline in gross income, unless expenses fall at the same rate of decline as the rate of decline in gross income, or at a faster rate, the rate of decline in Net Income will exceed the rate of decline in gross income, and the rate of decline in Net Income will accelerate with time. In addition, if the rate of increase in expenses is exceeding the rate of increase in gross income, the company is trending toward zero Net Income (even if Net Income is temporarily increasing). Also, the bulk of post-peak Cumulative Net Income will be shipped early in the Net Income decline phase.
All of the foregoing is true also for production, consumption and net exports from net oil exporting countries. And these are mathematical observations that are not subject to debate.
To help me understand “Net Export Math,” seven years ago I proposed a simple model for a hypothetical country called “Export Land.” What the Export Land Model (ELM) showed is that given an ongoing production decline in an oil exporting country, unless they cut their consumption at the same rate as the rate of decline in production, or at a faster rate, the resulting net export decline rate would exceed the rate of decline in production and the net export decline rate would accelerate with time. Furthermore, if the rate of increase in consumption exceeds the rate of increase in production, the net exporting country is headed toward zero net exports, which is why the US and China became net oil importers, prior to production peaks.
The Six Country Case History* showed exactly what the ELM predicted we would see, and now globally we are seeing the same kind of decline in the Global ECI ratio that the ELM showed and that we observed with the Six Country Case History. Also, we are seeing an ongoing decline in the ratio of Global Net Exports of oil (GNE) divided by Chindia’s Net Imports (CNI). At the 2005 to 2012 rate of decline in the GNE/CNI ratio, China & India alone would theoretically consume 100% of GNE in only 17 years.
In any case, here are the 2005 to 2012 rates of change in the ECI ratios for the top 33 net oil exporting countries:
http://i1095.photobucket.com/albums/i475/westexas/Slide1_zps5a656e89.jpg
Roughly four-fifths of the (2005) Top 33 net oil exporting countries are trending toward zero net oil exports, and as noted above, I estimate that we have already burned through about one-fifth of post-2005 Global CNE (Cumulative Net Exports) in only seven years. Note that a similar CNE extrapolation for the Six Country Case History was too optimistic for post-1995 CNE from the Six Countries.
*Six Country Case History: The six major net oil exporters that hit or approached zero net oil exports from 1980 to 2010, except for China.
What is important for the U.S. and North America is energy independence with regard to supply. Prices will still be bound to the world market, but as long as supply is reliable, the economic impact will be significantly less than being whipsawed by shortages.
North America is moving toward supply independence… not there yet, but moving toward it. Of course, that is dependent on removal of political barriers such as the Keystone pipeline interference by the Obama administration. Otherwise, we could become another version of Energy-Europe.
https://www.eiu.com/public/topical_report.aspx?campaignid=Oilgasnorthamerica
Bruce,
However, if we expand the regional filter a little bit to Western Hemisphere net oil exports, from the seven major net oil exporters in the Americas in 2004, their combined net exports fell from 5.9 mbpd in 2004 to 5.0 mbpd in 2012.
Meanwhile, Brazil, a country that a Bloomberg columnist suggested would “Take market share away from OPEC,” is a net oil importer, with a recent trend of increasing net imports, even if we count biofuels production.
Incidentally, regarding the (2005) Top 33 ECI (2005 to 2012) rate of change chart by country:
http://i1095.photobucket.com/albums/i475/westexas/Slide1_zps5a656e89.jpg
From 2005 to 2012, only one major net exporter in North America showed an increase in their ECI ratio, Canada, and only one major net exporter in South America showed an increase in their ECI ratio, Colombia.
As shown on the chart, the other five major net exporters* in the Americas, circa 2004/2005, showed declining ECI ratios from 2005 to 2012.
*Mexico, Venezuela, Ecuador, Argentina, Trinidad & Tobago
Jeremy wrote: “Ultimately most fossil fuel will be left in the ground once a viable alternative is found. (And viable is NOT Solar, not Wind nor Tidal power which are a waste of tax dollars – viable would be something new like a fusion reactor)”
Why do you spoil your first most likely correct statement with nonsense like “fusion reactor”
Even in the most optimistic scenarios the fusion reactor is still 20 years away. But more important, even in case of a running reactor in 2035 you have no guarantee that an industrial scale reactor would provide energy at a price lower than today’s NPPs. Or if I have to choose between onshore-wind (today 5-8 cent/kWh) and fusion reactor, i.e. between science and science fiction, I know what to choose. 🙂
Jeffrey, the issue I was pointing out was strategic supply issue for the U.S./North America. South American politics has made oil production a basket case. Sure it’s in the same “region” just as the Middle East in the same region as Europe.
Europe could have its economies disrupted by supply shortages at any time. North America is positioned to take advantages of new oil and natural gas technologies to move quickly toward supply independence.
By the way, automotive technology for natural gas has been around for quite awhile. Expanding the re-fueling infrastructure for NG is far easier than setting up recharging stations since NG is readily available on almost every metropolitan area block in the U.S.
http://www.chron.com/cars/article/Natural-gas-fueling-stations-in-Texas-set-to-4716846.php
The “world’s” energy problems are a myth. They are local and regional energy problems.
Ricardo: “Whale oil peaked, kerosene peaked, buggy whips peaked.”
Sigh.
Those things/resources “peaked” because superior alternatives were found/developed. Whether that process continues is a race of invention against geological and physical realities. The outcome of this race is not certain. Your naive comments to the contrary are based on nothing more than a child-like faith in free markets.
Is there any way to separate out Chinese demand from oil prices? How much of the current price of oil is due to Chinese demand?
It seems to me that the Chinese are in an un-economic “Great Leap Forward” to “modernization”. Like the Great Leap Forward, it is government driven, that’s why I say it is un-economic, it it not an organically driven process (some of it may be organic, but not most).
Thus, I think a lot of Chinese demand is artificial. If the Chinese government cannot sustain this “Great Leap Forward”, demand for oil could collapse.
Bruce Hall,
A recent Citi Research report put the decline rate from existing US natural gas (NG) production at about 24%/year. This implies that the US has to replace 100% of current US NG production about every four years, just to maintain a current dry US NG production rate of 66 BCF/day. Or, over a 10 year period, we would need the equivalent of the peak production rate of about 30 Barnett Shale plays, in order to maintain current NG production. And of course, as of 2012, the US was a still a net NG importer.
Regarding the “World’s” energy problems, after 2005, through 2012, it’s been a problem for developed net oil importing countries like the US, as developing countries, led by China, consumed an increasing share of a post-2005 declining volume of Global Net Exports of oil.
Regarding electrified transportation, I think that electrified rail makes the most sense.
Henry Ford said:
“If I have listened to my customers, I would have built a faster horse.”
…and Jobs and Gates would have build faster calculators and Standard Oil would be Standard Wood.
“Why do you spoil your first most likely correct statement with nonsense like “fusion reactor””
While I agree that a fusion is still at least a few decades away if not longer, I disagree in wasting taxpayer money on what are proven to be uneconomic and impractical sources of energy, such as wind and solar. At least fusion, if mastered has the “potential” for unlimited clean energy!
Bruce Hall: “…political barriers…Keystone pipeline interference…”
The Administration hasn’t been very effective at erecting political barriers to growth in energy supply. Canada sent more C + C to the US in 2012 than in any previous year, without Keystone XL, and the total for 2013 looks like it will be even larger.
In the past two years more than 80 million acres offshore in the Gulf of Mexico have been offered for lease, opening them to exploration and production. The Gulf Coast oil patch is quite happy with the current administration’s energy policies.
The coal industry isn’t happy about emission controls but that need has to be addressed. The industry is quite profitable and will likely continue to be, as there’s a lot more coal than there is oil and demand overseas climbs and climbs. I don’t know of any policies by the Administration to hinder coal exports, and the US is the fourth largest exporter in the world, maybe closing in on third place–not a good sign, in my opinion.
Jeffrey, not sure of what Citibank research to which you refer. These are government stats that tell a different story:
http://www.eia.gov/dnav/ng/hist/n9010us1m.htm
Synapsid, the administration includes the EPA which has remained a major negative factor in oil/gas distribution development. For several years, it has been well documented that oil/gas production has decreased on Federal land and that the entire national increase has been on state and private land. It’s all well and good to offer leases in the Gulf of Mexico, but for that to benefit the U.S., they have to be easily developed and have high certainty of large reserves… not necessarily the case.
+1 for Bruce. The job killing enviro-fascist debt up to our eyeballs administrations has so far only helped ONE sector of the economy – their high placed friends working at the Vampire Squid that is wrapped around the face of humanity. To be fair, although the situation has been made orders of magnitude worse by Obama, the current mess started under Bush and profligate spending actually began way back under Reagan. So there is nothing for Democrats or Republicans to be proud of.
http://www.rollingstone.com/politics/news/the-great-american-bubble-machine-20100405
In the new Vampire Squid run economy, we don’t need coal, or oil or manufacturing or real jobs…just ever more debt and ever more injection of liquidity into the market ad infinitum. Thank goodness the disciples of Keynes broke the paradigm and realized that you don’t need a real economy when you can monkey with the money supply and create the new artificial economy with the government at the center of everything.
Total US taxpayer dollar supported research on fusion since 1953 is ~29 billion in inflation adjusted dollars according to these guys.
http://focusfusion.org/index.php/site/reframe/wasteful
Total DOE research on all renewables energy sources since 1948 is ~22.5 billion in 2011 adjusted dollars.
http://www.fas.org/sgp/crs/misc/RS22858.pdf
Renewables have problems, but they are functional now and are likely to be cost-competitive with any fossil fuel if externalities are brought into account. Fusion reactors would be awesome, but they will require tens of billions of more dollars in research to develop.
Jeremy wrote: “While I agree that a fusion is still at least a few decades away if not longer, I disagree in wasting taxpayer money on what are proven to be uneconomic and impractical sources of energy, such as wind and solar. At least fusion, if mastered has the “potential” for unlimited clean energy!”
You have no evidence that large scale fusion will be cheaper than alternatives, therefore, your statement makes no sense. The most optimistic assessments by engineers were in the range of NPPs.
The problem in 2012 is already that onshore wind in central Europe is cheaper than new hard coal power plants. NG is much more expensive. Should we really take the risk and wait 25 years for a wonder?
The other point is that for me as customer PV (on my roof) must beat the price of electricity delivered by my utility, the price the utility pays does not matter for me. Therefore, PV is competitive as long as I can use at least 50% of the produced electricity.
Bruce Hall,
The chart you provided shows no material increase (or decline) so far in total US Natural Gas (NG) production since late 2011, but that is not what I was talking about.
The issue is, how much new NG production does the industry have to put on line each year in order to offset the declines from existing wells? In other words, if no wells of any type were completed in 2014, by what percentage would US NG (and oil) production fall from 2013 to 2014?
The study I referenced was done by Robert S. Morris, with Citi Research and it is dated April, 2013, entitled “E&P Sector Update, As Winter Wraps Up.”
In the above study, Citi Research estimates that the decline rate from existing US NG production is about 24%/year.
It’s interesting to look at a specific case history, the DFW Airport Lease, in the Barnett Shale Play.
In 2007, Chesapeake estimated that late 2011 production from the lease would be up to 250 MMCFPD (million cubic feet per day), and they estimated that production would continue for at least 50 years. In 2007, they also said that the lease ” likely contains one of the thickest and best-developed reservoir facies anywhere in the play.”
Actual late 2011 production from the lease was only about 35 MMCFPD. Of course, the sharp decline in gas prices had an impact on drilling, but it’s interesting to take a look at how the wells that Chesapeake drilled and completed on the lease in 2007 have done over the past few years.
The DFW Airport Lease produced 52 MMCFPD in January, 2008, which would presumably be attributable to the 21 wells drilled and completed in 2007. In early 2013, the wells still producing from the 2007 group produced 2.6 MMCFPD in April, 2013 (with 10 of the 21 wells already having been plugged & abandoned).
This is about a 95% simple percentage decline in a little over five years, or an exponential decline rate of about 60%/year in monthly production (2007 wells only).
Total cumulative production from the 21 wells completed in 2007 was 0.8 BCF per well through early 2013, after a 95% decline in production from January, 2008. Note that Art Berman puts the average EUR per well on the DFW Airport Lease at about 0.9 BCF per well. Cheseapeake has estimated that per well recoveries would be on the order of 2.5 to 3.0 BCF per well.
It does seem that Chesapeake’s proclamation that the DFW Airport gas wells would produce gas for at least 50 years is a “little” on the optimistic side, especially since about half of the wells that they publicized in 2007 have already been plugged and abandoned. Odd that they did not issue a press release about that.
Here’s a thought experiment. Assume that the 21 wells they put on line on the DFW Airport Lease in 2007 were the total gas supply for the country. In a little over five years, our total gas supply would have dropped by 95%. This is the revolution that will power us to a virtually infinite rate of increase in oil and gas production?
Onshore wind requires a back up source for when the wind does not blow – therefore – de facto it can never be cheaper. Generally wind and solar work out at $500 per barrel equivalent when full life cycle costs are taken into account.
Incidentally, regarding Natural Gas (NG) production, the best measure of usable NG production is dry production, which is what the EIA uses in their summary charts:
http://www.eia.gov/dnav/ng/hist/n9070us2m.htm
Since late 2011, new NG production–from dry gas wells, from wet gas wells and from associated gas (associated with crude oil production)–has only been sufficient keep US NG production on a plateau of about 66 BCF/day.
As noted above, the industry is facing enormous challenges over the next 10 years, just offsetting the decline from existing wells, as an increasing percentage of US oil & gas production comes from very high decline rate tight/shale plays.
That EIA forecast of US tight oil production is actually quite grim. It implies that, without some major new sources, the US oil production boom will be over by 2015, and a rapid collapse will ensue from 2020.
Bruce Hall: The EPA writes the regulations to implement laws written by Congress. Enforcing the Clean Air Act (was that the Nixon administration?) causes extra costs for power generation, so the power industries could call the EPA a negative factor affecting power generation. I wouldn’t expect that view to be widely shared, though. Similarly, there’s likely a fairly tight grouping of interests that would view enforcement of regulations on, say, pipeline safety as something negative.
We hear, often, that production of oil and gas has decreased on Federal land for several years and that the entire national increase has been on state and private land. Um…look at where the oil and natural gas are. Conventional oil and gas production has been in decline pretty much everywhere for years. That “national increase” has come mostly from fracking tight shales and is mostly in 14 (if memory serves) counties, divided between East Texas and North Dakota, and that production can go on because very high oil prices support it. The price of oil is high because global production has been pretty flat for about eight years but consumption has been picking up. Eventually we’ll see the same thing with natural gas (overproduction from the shales killed drilling for dry NG a few years back.) We know where the oil (and NG) are, and most of it is not on Federal land except in the Gulf of Mexico.
It seems odd, then, that you view the offering of tens of millions of acres offshore in the Gulf of Mexico in what seems to be a negative light. You say that for leases to benefit the US they have to be easily developed and have high certainty of large reserves. The way to determine high certainty of large reserves is to drill; do you suggest that the US (there is no national or Federal oil company) should drill first and then offer those leases that fit the bill? The business works the other way round. And if “easily developed” were a requirement there would be no companies drilling in the Gulf of Mexico at all, yet tens of billions of dollars have been spent doing just that–on leases from the Federal government. I don’t understand your point.
With regard to natural gas, it seems a little bit like cherry picking to say that DFW represents all of the fields since we should be out of gas by now, but I’ll let that slide since the trend is more, not less gas, available.
With regard to the EPA regulations, I’d say that it’s a bit of a stretch to correlate the original mandate of the EPA with the way that agency presently operates.
With regard to the Gulf of Mexico, my point is simply that offering 80 million acres of high-risk, deep-water exploration doesn’t necessarily offset the government’s closure of vast coastal regions. The sweet spots in the Gulf have been probed for quite a long time… and I’m not so sure about the oil companies being “happy” about the present situation.
Bruce Hall,
As I noted several times, Citi Research analyzed total US NG production and concluded that the decline rate from existing gas production is about 24%/year, which as noted, requires the industry to replace 100% of current production in about four years, just to maintain constant production.
The 2007 vintage DFW Airport Lease wells are merely one example of what happens to a group of shale wells, with time. One could select a similar grouping of wells in virtually any tight/shale play and see similar five year production declines.
Regarding more gas available, as the above charts showed, all the new gas production that has come on line in the US since late 2011 has served to offset the declines from existing wells, as we have stayed–for the time being–on a plateau of about 66 BCF/day since late 2011.
Since the peak oil refers to fossil oil as a finite source of energy, the increase in oil production from renewables should not be included in the peak oil estimate. If, for instance, the increase of renewable oil was to increase sharply in following decades, it could theoretically contribute to shorten the time-to-peak for fossil fuel production.
I hate to bring this up but you need to do an apples to apples comparison. Liquid fuels is not the same thing as crude production so the argument above is not truly supported by sound data. Today we have a lot more ethanol, biofuels, and heavy oil being reported while in the past there was far more light sweet crude in the production data. Since heavy oil, ethanol, and biofuels all require much more energy to produce the end products that consumers use the aggregate numbers are hiding a big problem by double counting barrels that are consumed in the energy extraction process.
As for the US shale boom, it is a clear bubble. A month or two ago I could not find any primary producers of shale that were able to make a true economic profit. While their 10Ks may have reported the occasional profit the cash flow statements and balance sheets were indicating that the ‘profit’ came by underestimating the real depreciation rates. For some reason the producers are allowed to use their Estimated Ultimate Recovery rates to come up with depreciation schedules even though the actual well production data is indicating that the EURs are too high by a factor of two or more for the typical shale well. We have already seen the shale gas sector destroy capital. How much longer will we ignore the data before we recognize the same thing is happening in oil?
Bruce Hall: DFW? If that’s Dallas-Fort Worth, where Chesapeake did not do well developing NG, I didn’t mention it. East Texas in my comment is the Eagle Ford Shale. If by DFW you mean something else, please let us know.
I’ll take your word for it that you aren’t sure about how the oil industry views the policies of the current administration. I’m quoting from the oil patch.
Chiding the administration for offering leases in the deep-water Gulf of Mexico makes no sense. There were 170 drilling permits granted in shallow Gulf waters in 2011 and 171 in 2012. For comparison, 165 permits were granted in Deep Gulf waters in 2011 and 395 (more than twice as many) in 2012. The deep waters are where the interest is–that’s where the bids are–because that’s where the oil is.
Many shallow shelf areas are not on offer, for various reasons. Offshore California meets strenuous local resistance, as does some of offshore Florida. Blocks off northern California and coastal Oregon were offered during the Reagan administration and the industry took a look and walked away, because there was no potential seen there. It’s worth noting that many shallow shelf areas that do produce are tapping the same reservoirs that adjacent onshore production is; offshore California and onshore Monterey shale is an example. Looking at East Coast shallow shelf that is not on offer is looking at a region lacking much in the way of production in adjacent onshore regions. Oil and NG are not present everywhere. You’re making another very broad statement about a topic that has a good deal of detail in it.
And some areas not on offer just haven’t been offered yet. These auctions are planned ahead and spaced in time, and a good part of what determines the scheduling is industry demand.
It’s also worth keeping in mind that drilling and producing from tight formations (such as the Bakken in ND and the Eagle Ford in E Texas) is very expensive, and that drilling and producing in the deepwater Gulf is very expensive indeed–a platform can cost $100 million to build and $1 million a day to run. That the industry is doing it at all testifies to the lack of large prospects of conventional type elsewhere, not because of political interference but because they don’t exist.
“Renewables have problems”
Not being able to reliably keep our lights on reliably being foremost among these “problems”.
Solve the intermittency/energy storage problem, then talk to me about renewables. Until then it’s vapourware.
Don’t like greenhouse gases, but want to keep the lights on? Nukes. The problems with nuclear are absurdly and hysterically overstated, as all numerate and scientifically literate individuals know.
Darren wrote: “Solve the intermittency/energy storage problem, then talk to me about renewables. Until then it’s vapourware.”
This argument is weak. To assume that baseload power plants are essential, because they are sufficient, lacks intellectual depth. You can combine Wind, PV with cheap NG power plants.
You have to analyse duration power curves to make an educated guess how much wind can be incooperated WITHOUT ANY storage (40% in Germany). Then you have to think harder about not correlated production. The advantage of the USA is that maximum power demand is in summer, therefore, PV is indeed a good solution for many consumer.
“Don’t like greenhouse gases, but want to keep the lights on? Nukes. The problems with nuclear are absurdly and hysterically overstated, as all numerate and scientifically literate individuals know.”
As long as the economy of nukes is bad, the last generation is at >4500 USD/kw, nobody invests in nukes. Absolute no need for “hysterically overstated, as all numerate and scientifically literate individuals know”, only basic economy.
BTW you take of RE does not prove that you are a “scientifically literate individual”. 🙂
From my website:
US shale oil hides crude oil peak in rest of world
http://crudeoilpeak.info/us-shale-oil-hides-crude-oil-peak-in-rest-of-world
Euan Mearns’ ‘4 nails in the coffin’ post to TOD made me wonder if I’d been reading about a different ‘peak oil’. He refers to the expansion of unconventional oil and gas production, which is exactly what peak oil theory predicted. And with it, falling energy returns. I’m not sure why people think that the availability of expensive (whether conventional or not) oil and gas won’t be a problem.
It is risible how the “Peak Oil Doomsters” move the goal posts now that they have been proved completely wrong. Oil is Oil it still comes out of the ground whether you chose to call it conventional or not. Oil Sands have been exploited since the 80’s. Fraccing for tight oil began in the 40’s – the same technique is used to extract Shale Oil.
This is just like the man-made Global Warming alarmists, who said for decades that CO2 dominated our climate in the face of incontrovertible evidence that man-made CO2 has negligible effects. Now, after nearly two decades of stagnant global temperatures, the man-made global warming goal posts are being rapidly moved to include the big natural variations so that the fraudsters can claim that global temperatures are still rising because of fossil fuels but nature is mitigating all of it.
How much longer do we need to listen to these false “Priests of Doom” and their incoherent nonsense?
“I was wrong about Peak Oil but we still face a disaster because supply is coming from an expensive unconventional type of Oil”
“I was wrong about natural climate variation but CO2 is still the greatest challenge faced by man”
and on and on and on.
Jeremy,
Is it your assertion that the finite sum of discrete sources of oil that peak and decline, e.g., the North Slope of Alaska (see graph below) will show an infinite rate of increase in production?
Annual crude oil production from North Slope of Alaska:
http://www.eia.gov/dnav/pet/hist_chart/MANFPAK2a.jpg
The following article discusses a study that examines how people’s beliefs tend to affect their ability to process quantitative data, i.e., they tend to have difficulty processing quantitative data that contradicts their beliefs. Basically, it’s cognitive dissonance at work, i.e., people will believe what they want to believe, no matter what the data show.
http://grist.org/politics/science-confirms-politics-wrecks-your-ability-to-do-math/
Two examples come to mind.
It seems to me that many people of the liberal persuasion want to believe that the Federal Government has an objective value in the Social Security Trust Fund, even though the asset in the Trust Fund is offset, dollar for dollar, by the liability that the Treasury Department has to made good on the Treasury instruments in the Trust Fund.
And it seems to be an article of faith among conservatives that there is no problem with maintaining an infinite rate of increase in our consumption of a finite fossil fuel resource base.
Who said anything about infinite rate of increase?
Fossil fuels will last at least 600 years more if not much much longer – plenty of time to find something else.
I object to all the peak oil doom mongering rather than the concept that eventually man will move away from fossil fuels.
Jeremy,
So, you are one of the wacko Peak Oilers?
In any case, I agree that we will consume fossil fuels for a long time, but the question is the rate of consumption. For oil specifically, it’s about flow rates.
As the Professor and I both noted up the thread, the US has–so far at least–shown an “Undulating Decline” pattern in crude oil production since 1970, with current US production about 25% below our 1970 peak rate, and we remain dependent on imports for about half of the crude oil processed daily in US refineries.
If we focus on actual global crude oil production (most commonly defined as crude + condensate, or C+C), we averaged 74 mbpd for 2006 to 2012 inclusive, the same rate as 2005, with the 2012 rate slightly exceeding the 2005 annual production rate.
As noted above, Global Net Exports of oil (GNE, calculated in terms of total petroleum liquids + other liquids, EIA) have been below the 2005 annual rate for seven straight years, with the developing countries, led by China, so far at least consuming an increasing share of a post-2005 declining volume of GNE. Available Net Exports, the volume of GNE available to importers other than China & India, fell from 41 mbpd in 2005 to 35 mbpd in 2012.
That’s just factual data, and as noted up the thread, recent research suggests that people frequently refuse to process quantitative data that contradict their beliefs.
So, while the data show that developed net oil importing countries like the US were, after 2005, gradually being shut out of the global market for exported oil, via price rationing, the conventional wisdom is that we can look forward to an indefinite rate of increase in our consumption of oil.
I have frequently used the “Midnight on the Titanic” metaphor. Around midnight, after hitting the iceberg, perhaps three people on the ship (about 0.1% of the people on board) knew that the ship would sink, but the fact that perhaps 99.9% of the people on board did not know that the ship would sink did not mean that the ship was not sinking. Later, as the first lifeboat pulled away, the passengers in the boat were reportedly ridiculed by some passengers remaining on board. As a character in a movie from a few years ago said, “Never underestimate the power of denial.”
Somewhat surprising interview in the WSJ:
Our Chat With Jeremy Grantham
(For link and possible access, do a Google Search for title)
He called the Internet bubble, then the housing bubble. What alarm bell is Jeremy Grantham, the chief investment strategist at GMO, ringing about now?