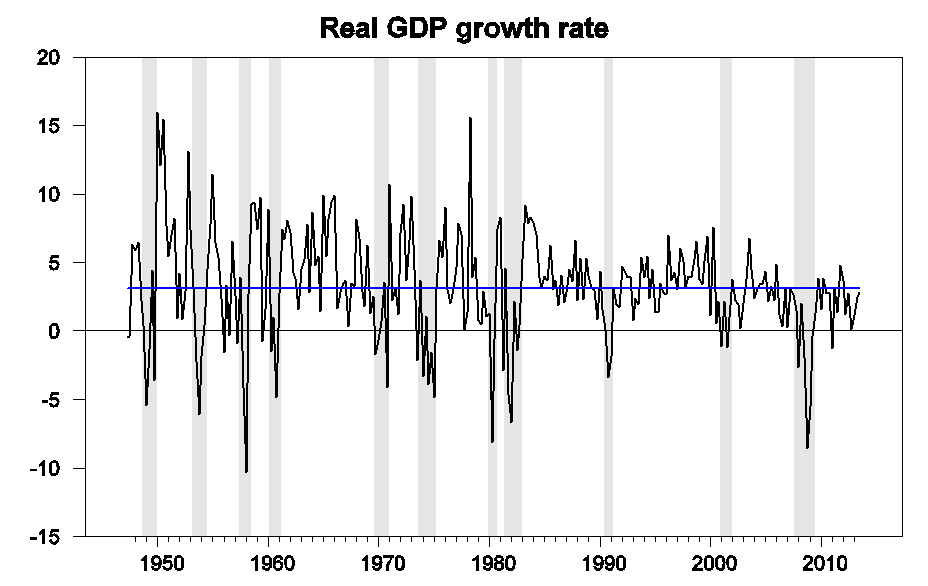
Yesterday the BEA finally reported GDP numbers for the third quarter, a month later than originally scheduled owing to the earlier shut-down of federal operations. The U.S. economy is estimated to have grown at an annual rate of 2.8%. That’s below the historical average, but better than the previous three quarters.
|
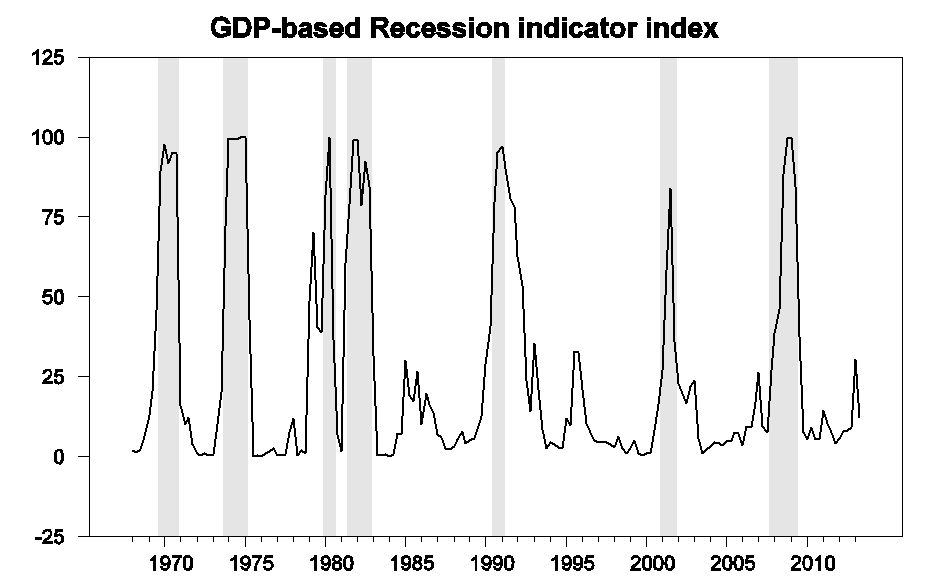
The gradual improvement in the growth rate has brought our Econbrowser Recession Indicator Index back down to 12.4%. The weak performance earlier this year had led to a moderate spike in this summary statistic, though far from the 67% threshold at which we would declare that the economy had entered a new recession. Note that in calculating this index we allow one quarter for data revision and trend recognition. Thus the latest value, although it uses the GDP numbers released yesterday, is actually an assessment of the state of the economy as of the end of 2013:Q2. However, our index is never revised, so that the numbers plotted in the graph below since 2005 are exactly the values as they were reported one quarter after each indicated historical date on Econbrowser.
|
In terms of the individual components of GDP, 0.83 percentage points of the 2.8% total came from inventory rebuilding– real final sales were up at less than a 2% rate. Another 0.8 percentage points of the improvement over the second quarter came from a reported decline in import growth, a number that is particularly subject to revision. But despite the government shutdown in September, the fiscal drag that showed up in the 2012:Q4-2013:Q1 figures has disappeared. In addition, housing continues to make a modest positive contribution.
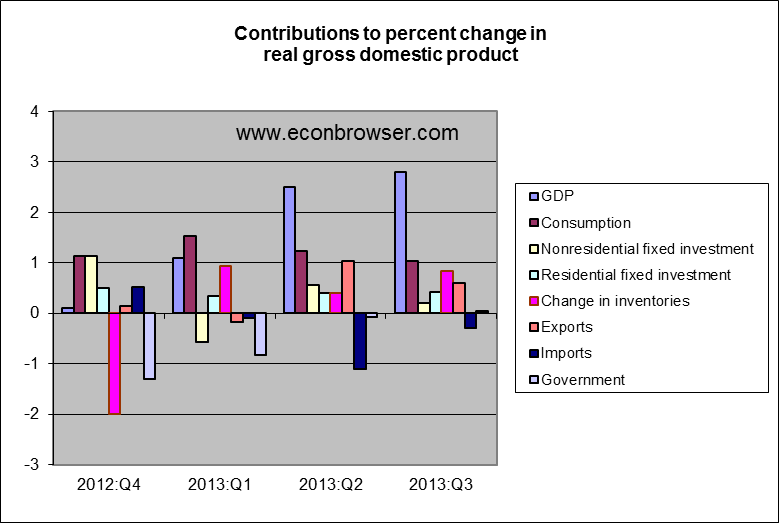
If you add the fiscal drag back in to previous quarters, the growth isn’t quite as big. Consumption is down relative to the first quarter, but I question the value of consumption when it’s fueled by debt. The increase in exports far more encouraging than an increase in consumption would be.
However, I suspect that that decline in government spending contibutes to future growth.
I also think that it’s not the fiscal effects (not largely) of decreasing government spending that drive private growth, but rather spending as proxy for government activity level. I think debt growth relative to private sector growth adds to uncertainty and inhibits private investment as do likelihood of increased spending and regulation and policy uncertainty.*
* There isn’t evidence of this though, since investment is down from 4Q12. But policy uncertainty could explain that.
I believe it was (on a seasonally adjusted advance estimate basis) a smaller increase in imports, not an actual decline. Or perhaps a ‘decline in the rate of increase’ of imports.
Growth in state and local government (1.5%) offset the remaining fiscal drag at the federal level (-1.7%).
I’m pretty sure the shutdown started Oct 1st and if anything would have increased 3rd quarter GDP as certain items which could be pulled forward (progress payments, etc) were.
benamery21: Thanks, correction noted.
If gasoline falls below $3, I would expect a notable bump up in the growth rate.
http://www.bls.gov/news.release/empsit.a.htm
http://research.stlouisfed.org/fredgraph.png?g=ofj
https://app.box.com/s/tgflwndqp3v6kzgrm24s
The labor force is contracting yoy and no higher than in ’08. All else equal, had the labor force continued to grow since ’08 at the current employment level, the U rate would be (is in terms of labor underutilization) ~11%.
http://research.stlouisfed.org/fredgraph.png?g=oft
The participation rate is now below 63% (Japan is 58%).
https://app.box.com/s/kaajuqk090dqqdc2if3v
https://app.box.com/s/v1rkhgj76aasawcsk9xd
Monthly Treasury withholding receipts are no higher than a year ago and in Jan. ’12, which is consistent with no growth of employment yoy. However, there were 1.5-2 million fewer people reported as employed in Jan. ’12 than today.
Employment remains where it was in early ’06 (real estate bubble peak and the onset of Peak Oil).
The yoy rate of employment is decelerating from a cyclical peak to 0% as occurs prior to recessions.
Despite the Fed expanding bank reserves by $3 trillion and the US gov’t borrowing and spending over $6 trillion, US real GDP per capita is no higher than in ’07-’08; the labor force has not grown in 5 years; employment has not grown in nearly 8 years; and there are at least 6 million fewer Americans in the paid labor force since ’06-’07.
http://research.stlouisfed.org/fredgraph.png?g=ofz
And now it appears that growth of real final sales per capita has stalled out in q1-q3 at the historical recession threshold of below 1% yoy for three consecutive quarters.
What will the Yellen Fed and TBTE banks do for an encore to QEternity now that the dubious “wealth effect” has proven only to be good at encouraging gross asset price and valuation distortions, misallocation, and runaway leveraged financial speculation, creating another massive global financial asset bubble that will burst as they all eventually do?
If printing $3 trillion and cumulative fiscal deficits of $6 trillion got us no employment growth and 6 million people leaving the labor force over 6-7 years, then perhaps $6 trillion more in bank reserves and $20 trillion in US public debt will encourage another 6 million people to leave the labor force and the U rate will fall to 4% or below.
That’s an equivalent of $500,000 in bank reserves and $1 million in deficit spending to reduce the labor force by 1 person in an attempt to “reduce the U rate”.
Brilliant.
This does support that spending/decreases government activity may contribute to growth in the medium and long run.
I doesn’t support that gov spending is preventing investment, but like I said, that’s probably just because policy uncertainty trumps that.
No one alarmed by the first chart? Seeing a general decline in the annual growth of the GNP, should it not raise some concerns about America’s future economic prospects?
Mr Kopits, I doubt a yearly saving of $730 in gasoline, will do much for the economy other than perhaps drive sales at your local Burger King or Paco’s Tacos…
In the meanwhile, dollar stores revenue growing by leaps and bounds…
Link for comment:
http://blogs.marketwatch.com/thetell/2013/11/08/marc-faber-china-could-spark-a-bigger-crisis-than-in-2008/
https://app.box.com/s/vrb89yt7hydt78tazd61
https://app.box.com/s/bw5tly5rp26s1043tvjp
It’s very late in the business and stock market cycles, if not early in a recession.
Contrary to the claim that the stock market is a “leading indicator”, the stock market has become at best a coincident indicator of the economy since the ’90s, if not a lagging indicator of recession by as much as 2-3 qtrs. since ’00-’01.
However, the stock market does provide a very good “leading indicator” of equity returns 5-10 to 20 years hence.
At current equity valuations and a dividend below 2%, the implied total return for the S&P 500 and Wilshire 5000 before fees, taxes, and inflation is ~0% to slightly negative for 10-20 years, with a 35-50% or larger cyclical drawdown risk along the way.
The S&P 500 has averaged a 4-year return of 4-6 times that of the average change of nominal GDP and wages, which also occurred ahead of each of the crashes in 1987, 2001-02, and 2008-09.
Yeah, I know, it’s different this time; it always is.
http://research.stlouisfed.org/fredgraph.png?g=ogI
Steven, above is real final sales per capita and the price of gasoline to average hourly earnings.
http://research.stlouisfed.org/fredgraph.png?g=ogK
And PCE to hourly earnings.
The US and world economy is at stall speed or contracting, but we’re being fooled again, as in ’01 and ’08, by the mass-media cheerleading for the stock and echo real estate bubbles. This time, however, the central banks and Wall St., The City, and Frankfurt are purposefully and overtly trying to create bubbles and thus fool us into thinking that increasing values of fiat digital book entry credits for equity and corporate bond securities means we’re wealthier as an economy and society.
But, in fact, the extreme wealth and income concentration to the top 0.1-1% to 10% of households hoarded at no velocity in the form of overvalued corporate equities is not indicative of wealth but of massive unsustainable financial claims by the top 0.1-1% to 10% on future production, wages, revenues, profits, investment, and gov’t receipts at the cost of the bottom 90% and to real GDP per capita hereafter.
It is certainly obvious in Figure 1 that the variation present in the 50s, 60s, and 70s has been damped down apparently starting in the mid 80s. Presumably an attempt at actively managing the economy by the federal reserve.
Too Much Debt:
http://ineteconomics.org/sites/inet.civicactions.net/files/2013%20FRB%20Chicago%20Nov%207%20-%20Reading%20Version.pdf
Too much debt to wages and GDP is synonymous with overvalued assets and extreme wealth and income concentration that occurs throughout capitalist history about once in a lifetime.
Austerity for the bottom 90% only emboldens the rentier top 0.1-1% to self-validate the values and further encourage the very behavior and expectations that resulted in the excessive debt and asset values in the first place.
The “wealth effect” is really hoarding surplus at no velocity resulting in a no-future-return and slow-or-no-real-GDP-per-capita effect.
At current levels of US private debt to GDP and wages, and at the trend rates of GDP and wages, it will take 25-30 years of little or no growth of debt to GDP and wages and of real GDP per capita for GDP and wages to catch up to a sustainable level of debt and the extractive aspect of debt service.
Gotta hand it to Bruce.
Not just confident 20 year forecasts for the stock market and GDP, but that great fresh insight into US social trends.
And villains too! Make a good HBO special. Damn them rentiers.
The more important blue line through figure 1 is the one not shown that slopes down at the rate of 4/10ths of a percentage point per decade. The forces behind it are now woven into the fabric of the nation. One can superimpose on the graph the proximate causes of why this is happening. The first is size of government. No one who has deeply thought about this, rather than regurgitate what they learned from their textbooks, can fail to understand this plague that has infected America. Closely following and directly linked is the unrelenting rise of regulation, which is sucking the lifeblood out of the private sector. Next is a more complicated cause. The calamity of fiat money which gave birth to the erosive stagflation of the 70s, and the credit-driven bubble that followed. This came a cropper when the bubble burst, and now is being doubled-down on by the Federal Reserve who by its current policies assures the downward slope will be augmented further. Along with the fact that sometime ago the optimal level of debt was passed. Driven by the cumulative deficits of the Leviathan, debt is now in the region where the coefficient on debt in the growth equation is negative and statistically significant.
This is not to say that the Hubbard oil peak and 1974 oil price shock ushering in a new energy era did not play a role in shaping the trajectory of the decline. Nor that the policies of Ronald Reagan did not provide respite from the decline. Nor that together the peace dividend from the dissolution of the Soviet empire, and the one-time technology burst of the 90s along with Y2K capital spending that ended abruptly when the clock struck the new millennium, caused a temporary false-promise bulge in growth. But it is to say that deeper causes are prevailing as has always been the case throughout history.
These deeper causes are rooted in the rise of a secular ideology that put statist intervention ahead of the freedom and liberty so essential to free markets and property rights, the subversion of natural morality that owes much to religious teaching but does not depend upon it, and ignorance of the voting public that grew abreast with the increasing complexity of the 20th century. The latter is fatal in a democracy when a certain threshold is reached. The ideology of the left played on this ignorance, and even more cultivated it in the public school system, the universities, and the media.
There is a slender chance that this decline can be turned. But the moral decay, corruption, and ignorance go so deep the chance is only slender. It will take both a grassroots awakening and a great man on the order of Marcus Aurelius, Elizabeth I, Washington, De Gaulle, or Eisenhower with principle, wisdom, and courage to face the people with what needs be done. That is unlikely barring a crisis. Zooming in closer, against the backdrop of global systemic risk only marginally below that at the time of Lehman, such a crisis does appear possible in 2015. The full brunt of the most odious piece of domestic legislation in the history of this nation – odious because against the wishes of the public at the time of passage and because it was completely opaque – will threaten the economy with recession. Some 50 million insurance holders will find their policies canceled, facing the shock of annual premium plus out-of-pocket cost hikes of 50% at a minimum. The effect will be uneven across states. Still, millions of eyes will be opened. The hit to disposable income will be on the order of 1.8%. This against the backdrop of the same impediments that have plagued growth the past 5 years, and 2 years ahead the full-blown impact of a new one.
JDH: Rather than a month later than usual, this GDP report came out about one week later than usual due to the shutdown.
The advance estimate usually comes out about 30 days after the end of the reference quarter. This one came out 39 days later.
It will be interesting to see revisions for the next two releases in light of the fact that this delayed estimate incorporates some source data not usually available for the advance estimate, including foreign trade data.
It’s hard to get excited by a big bump in inventory when final sales are in decline.
The trend in GDP growth this century is clearly down. This qtr’s number is well withing the trend channel.
I see nothing positive here.
c. thompson – brilliant. Nothing refutes actual facts and data like a bit of gratuitous snark. Really well done, sir!
JzB
@c thomson: I am pleased that you are amused. Perhaps you would like to put your money where your funny bone is and donate to a crowdfunding campaign to produce a comic video about the topic. John Cleese to narrate?
But we should be sure to focus the content to amuse and self-validate the rentier parasites on Wall St. and The City, as they are the only sods with sufficient bloody filthy lucre left to fund such an ambitious project for posterity.
Lead roles for Krugman, De Long, Bernanke, and Yellen are a must in order to demonstrate maximum irrelevance for comic effect. Sonders and Swonk for Boomer sex appeal?
So ring up your self-satisfied fellow Wall St. “winners” whilst I fantasise, but for a moment, about the flood of cash I expect to receive in due course. I trust you will not disappoint.
In the meantime, in between phone calls, if you really want a cheap laugh, take a look at real wages and salaries per capita, civilian employment per capita, and real final sales per capita:
http://research.stlouisfed.org/fredgraph.png?g=ois
Civilian employment per capita is where it was in 1979 and 1984, real wages and salaries per capita are at the level of 1999, and real final sales per capita are at the levels of 2007-08.
Now, after wiping the tears from your eyes in recovering from the hilarity of it all, I have no doubt that you will be hereafter doubly inspired to raise the sufficient funds to share this uniquely humorous situation with those who would find the current conditions particularly amusing.
Bruce,
Please expand on why you think the velocity is going down.
http://research.stlouisfed.org/fred2/series/M2V
Anonymous: “Please expand on why you think the velocity is going down.”
Here is the short list:
Extreme wealth and income concentration to, and hoarding of financial wealth by, the top 0.1-1% to 10%.
Consequently, the economy becomes disproportionately dependent upon the discretionary spending and gains from rent seeking of the top 1-10%, which increasingly flows to low-velocity imported luxury goods, foreign travel, tax, legal, and financial advisory services, personal services employing a vanishingly small share of the population, etc.
Debilitating levels of debt and debt service (synonymous with wealth and income concentration and overvalued assets) to wages and GDP capturing a disproportionately large and growing share of wages, profits, and gov’t receipts.
Rent seeking by the top 1-10% of 7-10%+ annualized returns when the productive economy’s capacity can produce no more than labor returns at 2-3%, and no growth of real GDP per capita after the decline in labor force participation, no real wage growth since the late ’90s, and no employment growth per capita in 30-35 years.
Regressive taxation of labor and production, including self-employment, in favor of rentier speculation and rent seeking, discouraging investment at labor returns and exacerbating the effects of rent seeking and financial wealth and income concentration to the top 0.1-1% to 10%.
Wealth and income concentration and central bank and tax policies that encourage and reward financial rent seeking increases the costs of energy, land, housing, health care, and the cost of labor such that the purchasing power of the bottom 90-99% is constrained by the costs of land, housing, health care, energy, and business formation as a share of household income, constraining growth of real GDP per capita.
The imputed cumulative compounding interest cost to total credit market debt outstanding is now an equivalent of 100% of GDP in perpetuity, resulting in a combined cost of net energy, gov’t, and “rentier taxes” in perpetuity.
The net cumulative cost of net energy per capita, health care, gov’t, and rentier taxes to wages and GDP preclude growth of real GDP per capita and an acceleration of velocity indefinitely.
The US economy will not grow after tax and price changes until returns to labor and production’s share of GDP accelerate and rentier returns to capital flatten out or decline comparatively.
Accelerating wage growth cannot occur, however, against regressive payroll taxes and the increasing automation of domestic goods-producing and services employment and the elimination of subsistence purchasing power, as well as the globalization of value-added labor and the resulting loss of potentially most paid employment, purchasing power, and payroll tax receipts over the course of the next generation.
We are in more serious trouble than anyone wants to admit.
It is no wonder our congress has the lowest approval rating in our nation’s history. Our congress and news media sound just like the French National Assembly and press in France in 1789. If you want to read some current history read the first four paragraphs of FIAT MONEY INFLATION IN FRANCE by Andrew Dickson White written in 1896.
Guess what (who) brought France out of their crisis? Napoleon!!
Ricardo, yes, QE is really just the TBTE banks printing themselves trillions in bank reserves to bail out their balance sheets while accumulating trillions in the form of cash assets on their balance sheets while still facing charge-offs and delinquencies of 5% of loans (very high), which is $380 billion, or equivalent to 2.2% of GDP.
In the meantime, despite $3 trillion in new bank reserves and deficit spending of more than $6 trillion, real GDP per capita has not grown since ’07-’08, 6 million people have left the labor force (the real reason the reported official U rate has fallen from 10% to 7%), the average price of oil has tripled since ’05, and real estate and stock prices are again in bubbles.
Real wages for the working-class bottom 90% are where they were in the late 1960s.
Moreover, there are bubbles in corporate bonds, student loans, bachelor’s and masters degress that aren’t required, subprime auto loans, farmland, trophy properties, collectibles art works, vintage cars, public and private debt to GDP, health care costs to GDP, college tuition costs, price of professional sports franchises, food stamps, real estate in Canada, Australia, China, Hong Kong, Singapore, UK, parts of Europe, and fixed-income, foreign exchange, and equity index futures derivatives.
In fact, by way of their private central banks and runaway fractional reserve lending and levering up, or monetizing, land and existing fixed-income assets, TBTE banks have created cumulatively the largest leveraged asset bubble in world history as a share of wages and GDP, and it is now global in scale.
The world is now facing financial asset and land price bubbles far in excess of before the debt-deflationary depressions in the 1830s-40s, 1880s-90s, 1930s-40s, and Japan since the late ’90s.
TBTE banks’ offshore shadow banking dark pools and their exchange-sponsored high frequency trading algobots are “managing” equity index futures by levering Treasuries and MBS 100:1 to capital and “unilaterally” netting derivatives and forward hedging of S&P 500 futures in a desperate and utterly fraudulent attempt to keep the equity indices rising. The risk to the global financial system is now at an order of ~3 times to capital that which preceded AIG and Lehman.
All it would take would be for a counterparty blow-up equivalent to just 1% or less of total global banking system and non-bank financial firms’ capital to bring the system down worldwide in a cascading meltdown on an unprecedented scale, complete with bail-ins and rehypothecating of deposits and assets levered to deposits.
The system has failed. Central banks are facilitators of TBTE banks’ license to steal via levering to an insanely impossible degree the world’s labor product, resources, business income, and gov’t receipts in perpetuity, or until a spark starts a conflagration that will consume the planet.
And, yes, we are in SERIOUS TROUBLE, such that no one in a position of authority or influence dare whisper the fact for fear that they might trigger a Baring Bank, Creditanstalt, Bear Stearns, AIG, or Lehman takedown from hopelessly leveraged assets and counterparties to couterparties’ counterparties netted twice- and thrice-removed claims against so-called assets no one knows what they are valued and the extent to which liability claims long ago netted negative for all eternity.
Reset. Redesign. Reboot. R-evolve.
https://app.box.com/s/lch4hswrcvjogkg1na9i
“Recovery”? Perhaps, but not “expansion”, at least not yet.
https://app.box.com/s/20a7wvsek6pc2f4dvfv1
The “new normal” is effectively a trend rate historically associated with recessions, which is the historical precedent for the weak Juglar cycle of the debt-deflationary Trough phase of the Long Wave Downwave.
https://app.box.com/s/b7atr90b08xulflw7yhw
http://www.youtube.com/watch?v=gEmJ-VWPDM4
To this point, we’ve been turning Japanese, I really think so, since ’00-’01.
https://app.box.com/files/0/f/888453170/1/f_11664033757
https://app.box.com/s/63apk9x7g83ls01m2kb9
https://app.box.com/s/acjof0mfytg9vy3aqiuf
And, like Japan in the early ’00s, our peak Boomer demographics are rolling over again and will continue down into the end of the decade to as late as the early to mid-’20s.
The US and European TBTE banks printing themselves trillions more dollars to liquefy their balance sheets and hoard cash assets to fund, in part, more trillions in US gov’t deficit spending will work no better in “stimulating the economy” than the same policies Japan has tried since ’00-’01 during the worst of their Boomer demographic drag effects.
Bruce: You have well captured the risk going into 2015 at which time 50% or more of employer-sponsored health insurance policies will be canceled shifting premium plus out-of-pocket expense hikes of between 50 and 100% onto the currently unsuspecting public. Against the backdrop you lay out, the shock to consumer sentiment and discretionary income may be enough to send the economy into a wholly new type of recession.
@JBH, yes, the longer-term objective (not publicly said) of the ACA, in order to reduce demand for medical services and thus reduce costs, is to shift most Americans to relatively affordable (?) monthly premia but high-deductible and annual maximum OOP plans, including premium subsidies for the bottom 50% of households.
This also implies that Boomers, and Xers and Millennials after them, will see Medicare merged with the ACA to include much larger deductibles, coinsurance, and OOP maximum costs for medical services via Medicare.
Peak Boomer spending is set to decline in any event hereafter as a result of a once-in-history shift in the composition of household spending from high-multiplier housing, autos, and child rearing to low-multiplier outlays for property taxes, house maintenance, utilities, insurance, and medical services and medications. The longer-term effects of high medical costs and the ACA will reduce Boomer and overall US spending marginally more as a consequence of the ACA.
Spending more for “education” and “health care” in an economy already experiencing onerous costs per capita and per household for these services has reached diminishing returns in terms of employment, after-tax earnings, and real GDP per capita. Moreover, increasing mass immigration will only exacerbate the diminishing returns and the ongoing effects of 40-45 years of no real after-tax wage, salary, and purchasing power gains for the bottom 90%.
A “wholly new type of recession” will be rather like that of Japan’s “lost two decades”, now into the third decade. But rather than a recession, one might refer to it as a permanent structural epoch of no growth of real GDP per capita, i.e., “end of growth”, if we’re lucky.
There is no apparent supply-side, Keynesian, neo-Keynesian, communist, socialist, corporate-statist solution to Peak Oil, peak debt, peak gov’t/GDP, peak “education” and “health care” costs, peak population and overshoot, and peak empire, i.e., “globalization”.
An entirely new form of financial, economic, social, and political system of organization, production of goods and services, governance and social contract, and distribution of income and purchasing power for the bottom 90%+ is required to avoid worsening structural decline, privation, and risk of systemic collapse.
Regrettably, the vast majority of establishment economists are so far behind the curve as to be largely irrelevant, or worse. Innovative thinking, risk taking, breakthrough experimentation, and solutions at appropriate scale by definition will not come from those in comfortable, self-satisfied positions of prestige and status among the establishment intelligentsia, nor from the self-reproduced next tier of the hierarchy of status, sorting, allocating, and power relations.
Bruce and JBH,
employer sponsored health insurance is a benefit-part of your earnings for work performed. if your employer cuts that benefit, he should move the equivalent compensation to increased salary. otherwise your employer is giving you a pay cut. employers only give pay cuts to people they do not want to keep on the payroll. if that happens to you, perhaps you should look into the mirror and understand why you are getting a pay cut? employers pay salary and benefit at levels to retain talent. losing your health insurance indicates you are not worth that value to the company. since labor turnover is costly, most employers will minimize this pay cut. sorry if you are on the wrong side of the equation.
https://app.box.com/s/m98htpmebgfwadb30s6y
@baffling: “Health care” spending (ACA or otherwise) as a share of GDP, wages, and household income is going to bankrupt the country. The insurers are profiting from the process in a zero-sum equation. They must profit first before any medical services are provisioned. The ACA is a gov’t-mandated, cartel-like subsidy for insurers’ revenues and profits. They profit, we go bankrupt, healthy or otherwise.
bruce,
what is your alternative. if you do not want to live in a health insurance world, then the healthy people will get by and never pay any medical bills. and unhealthy people will either pay away their life savings or constantly go bankrupt. at that point you basically write off any contribution to the world from unhealthy people, because they will never be able to save up the resources to do anything economically-the unhealthy will remain perpetually poor.
or you live in a world with health insurance, spread out the risk and cost, with the assumption that some of those “unhealthy” people will provide a greater good to offset their cost.
bruce, you live in a very moribund and depressing world. you need to get out and see the sunshine sometime!
@baffling: “Health care” has become a hyper-financialized industry, reflecting the same process that has occurred for the entire US economy since the onset of deindustrialization in the 1970s.
Do you know any medical professionals? If you do, then you will know that a growing majority of them are fed up with the medical insurance racket and would prefer to offer their services for cash or payment plans for more expensive services.
The vast majority of Americans are utterly unaware that 50-65% of health care is spent on the sickest 5-10%. 3-7% is spent on the healthiest 50-80%. Most health care costs are associated with the effects of smoking, unhealthy diets and lifestyles, lack of exercise, and poverty contributing to stress and the compulsion to engage in the aforementioned habits. 20% is spent on end-of-life care for people over age 60-65 suffering from self-induced chronic conditions resulting from the aforementioned habits, only to result in certain eventual death. It costs of bloody bleeping fortune to die in the US, and it is absolutely outrageous.
Health care spending in the US is 18% of GDP, $9,200 per capita, and an equivalent of $24,000 per household! This is absolutely insane! How can one not be moribund and depressed about this when confronted by the sheer madness and debilitating cost of the system?
I propose an alternative for a single-payer system eliminating for-profit insurers in which healthy people pay very low premia and have higher deductibles and coinsurance, as well as discounts for self-pay and good health outcomes. The 5-10% to 20% sickest who account for 50-65% to 80% of all spending should be covered by a system such as Medicare/Medicaid but with rationing of services. Healthy people who have low-risk lifestyles should not be paying for chemotherapy, radiation, surgery, hip replacements, physical therapy, thrice-weekly doctor visits for elders for socialization, and other costly end-of-life treatments for people in their 60s-90s. NO ONE CAN AFFORD THIS.
Moreover, those not of child-bearing age, especially single men with no children, should not pay premia associated with maternity coverage. Child birth should not be a medical condition from which insurers make a profit.
The current insurance system doesn’t spread risk as much as it concentrates profits to the insurers at the expense of the 90-95% healthiest people and their employers who are paying OBSCENE costs for insurance and medical services.
Now, some advice for you: Take off your self-satisfied, rose-colored sunglasses and take a look at what is happening to the bottom 90% of your fellow Americans. Then look in the mirror and smile and thank the Almighty that you are in such a self-satisfied position.
bruce
“Do you know any medical professionals? If you do, then you will know that a growing majority of them are fed up with the medical insurance racket and would prefer to offer their services for cash or payment plans for more expensive services.”
actually i do know many medical professionals, including my wife who is an MD. do some show distaste for the insurance goliaths? of course some do. but many simply do not like the financial business side of medicine, period. even if insurance did not exist, they would still have a gripe with the business side of their profession. it is not all the insurance company’s fault-ingrained attitudes do exist.
“The 5-10% to 20% sickest who account for 50-65% to 80% of all spending should be covered by a system such as Medicare/Medicaid but with rationing of services.”
Fine if you can convince Palin and the conservatives these are not death panels. and how do you fund this system?
“Moreover, those not of child-bearing age, especially single men with no children, should not pay premia associated with maternity coverage.”
gender is a random variable, you cannot choose this outcome. that is why you spread the risk to both sexes. and every male was born, so they had maternity coverage! or should short and tall people have different premiums? blue eyed and brown eyed? light skin and dark skin? i can understand some premium adjustment based on choice. but when it is based on random variables outside an individuals control, that is a bias trending toward discrimination. you can’t really have a selective risk pool and call it insurance.
Why does the opening paragraph still say a month later than scheduled? It came out 7-9 days later than scheduled.
This will most likely affect the revisions, as described above.
Bruce, why the hysterics? Since you have such a clear crystal ball into the coming debacle, I would imagine you have yourself positioned to profit handsomely. No need for you to worry at all, you’ll come out this in fine shape!