For the last 3 years, European Brent has mostly traded in a range of $100-$120 with West Texas intermediate selling at a $5 to $20 discount. But in September Brent started moving below $100 and now stands at $90 a barrel, and the spread over U.S. domestic crude has narrowed. Here I take a look at some of the factors behind these developments.
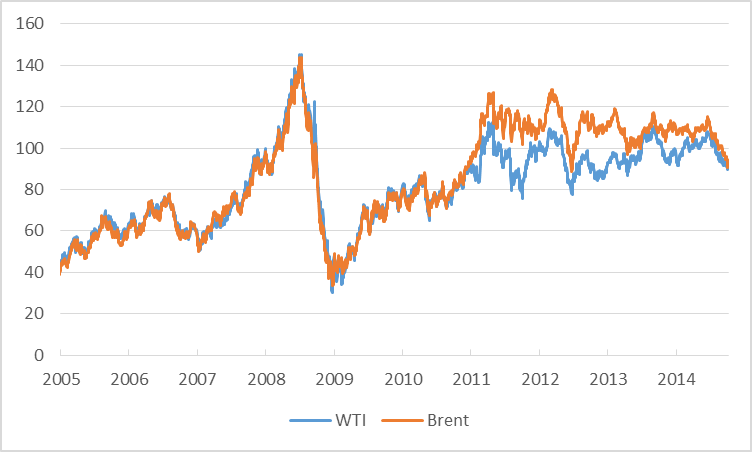
Price of crude oil in dollars per barrel, Jan 4 2005 to Oct 6 2014. Data source: EIA.
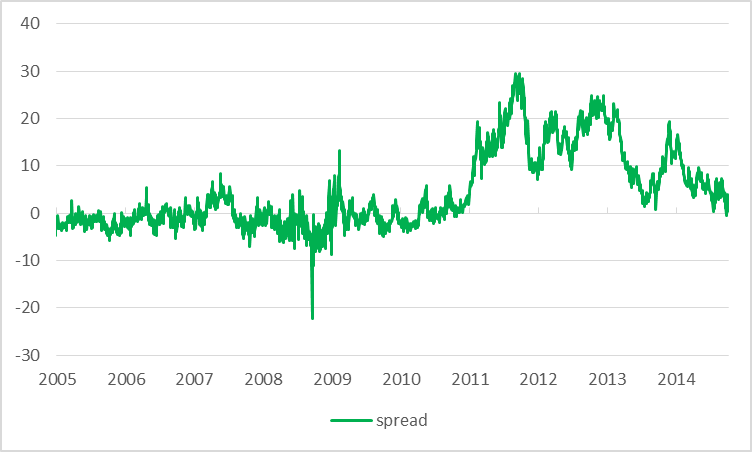
Price of Brent minus WTI, Jan 4 2005 to Oct 6 2014.
Prices of many other industrial commodities have also declined over the last year, silver and iron ore more than oil. One factor has been weakness in Europe and Japan, which means lower demand for commodities as well as a strengthening dollar. The decline over the last year in the price of oil when paid for with Japanese yen is only about half the size of the decline in the dollar price.
| Brent | -18.2 |
| WTI | -16.7 |
| gold | -3.4 |
| silver | -18.7 |
| platinum | -8.1 |
| palladium | 10.5 |
| antimony | -11.3 |
| copper | -7.1 |
| lead | -1.3 |
| iron ore | -40.0 |
| zinc | 21.2 |
| euro | -6.7 |
| yen | -8.5 |
In terms of factors specific to the oil market, one important development has been the recovery of oil production from Libya. The latest Monthly Oil Market Report from OPEC shows Libyan production up half a million barrels per day since this summer. Libya is hoping to add another 200,000 barrels/day this month and 200,000 more by early next year. This would be a significant addition to the market, though the situation in Libya remains quite unstable.
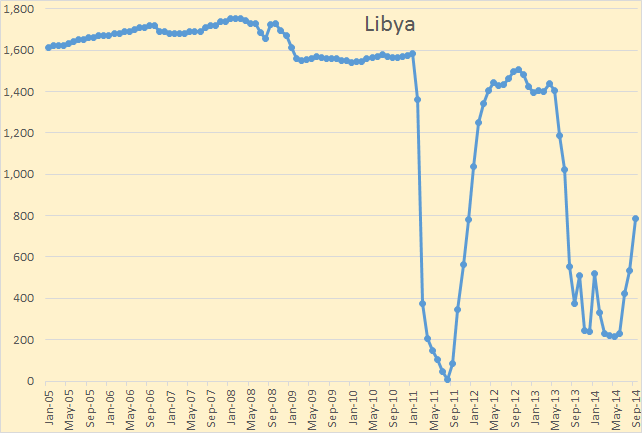
OPEC figures for Libyan oil production in thousands of barrels per day. Source: peakoilbarrel.
But the biggest story is still the United States. Thanks to horizontal drilling to get oil out of tight underground formations, U.S. field production of crude was 2 million barrels/day higher in 2013 than it had been in 2011. And the EIA’s new Short-Term Energy Outlook released this week expects we’ll add another 2 million b/d over the next two years. That’s unquestionably enough to start moving the world price.
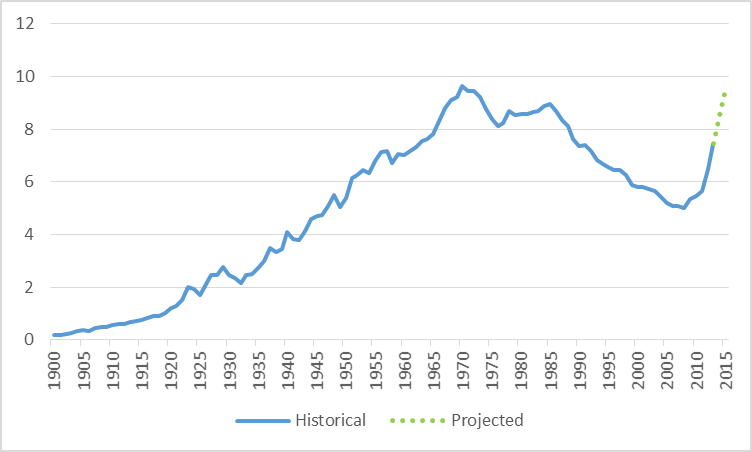
U.S. field production of crude oil. Blue: historical production, 1900-2013, from EIA Green: projected for 2014-2015, from Short-Term Energy Outlook.
As I’ve noted before there’s a basic limit on how much U.S. production is capable of lowering the world price. The methods that are responsible for the U.S. production boom are quite expensive. Just how low the price can go before some of the frackers start to drop out is subject to some debate. A report in the Wall Street Journal last Thursday provided assessments like these:
“There could be an immense amount of pain,” said energy economist Phil Verleger. “As prices fall, you will see companies slow down dramatically.”
Paul Sankey, an energy analyst with Wolfe Research LLC, said the first drillers to react to declining crude prices would be some in the least productive fringes of North Dakota’s Bakken Shale. “We’re not quite there yet,” he said, but a further drop of $4 or $5 a barrel will force companies to begin trimming their capital budgets”….
Some U.S. oil fields, including the Eagle Ford Shale and Permian Basin in Texas, would remain attractive for drillers even at much lower oil prices. An analysis by Robert W. Baird & Co. said prices could drop to $53 a barrel in certain parts of the Eagle Ford and still be profitable to drill.
And here are some of the estimates reported by Bloomberg:
Shale oil is expensive to extract by historical standards and only viable at high-enough prices, Ed Morse, Citigroup Inc.’s head of global commodities research in New York, said by phone Sept. 23. Oil from shale formations costs $50 to $100 a barrel to produce, compared with $10 to $25 a barrel for conventional supplies from the Middle East and North Africa, the Paris-based International Energy Agency estimates.
“There is probably something to the notion that if prices fell suddenly to $60 a barrel, the production growth would turn negative,” he said.
Brent crude could drop to $80 a barrel before triggering a slowdown in investment from U.S. shale-oil drillers, Fitch Ratings said in a report today.
If Europe’s woes worsen, U.S. tight oil production continues its phenomenal recent growth, and Libya can continue to increase production, we may soon find out who is right.
Arctic oil (Kara Sea) – From articles:
“Rosneft said it is currently exploring three areas in the Kara Sea that are believed to contain 87 billion barrels of oil. It said the Kara area’s total reserves could rival those of Saudi Arabia.”
“…a vast pool of crude was discovered in the Kara Sea region of the Arctic Ocean, showing the region has the potential to become one of the world’s most important crude-producing areas, arguably bigger than the Gulf Of Mexico.”
“It exceeded our expectations,” Sechin said in an interview. This discovery is of “exceptional significance in showing the presence of hydrocarbons in the Arctic.”
The development of Arctic oil reserves, an undertaking that will cost hundreds of billions of dollars and take decades, is one of Putin’s grandest ambitions. As Russia’s existing fields in Siberia run dry, the country needs to develop new reserves as it vies with the U.S. to be the world’s largest oil and gas producer.
Output from the Kara Sea field could begin within five to seven years, Sechin said, adding the field discovered today would be named “Victory.””
Interesting to see Verleger and Morse among the bulls.
The Saudis also matter, I’d add. The Saudis announced 400 kbpd of cuts in August. It’s not evident in the data. The EIA shows Saudi production at 9.8, 9.7, 9.6 mbpd for July, Aug and Sept, respectively. No big cuts there. The Libyans are up 350 kbpd, Sept over July. Add +1.75 mbpd from North America, and well, that’s a lot of supply if the Saudis don’t cut production.
I think low prices are convenient for the Saudis and the US, at present. It hurts Russia, Iran and ISIS.
Oil from shale formations costs $50 to $100 a barrel to produce
That seems like a pretty large estimate spread for a product that’s been around for awhile. If the Citigroup guy meant to say that there’s a lot of variability in the costs due to geological factors, the presumably the only estimate that’s relevant here is the high end of $100 because that represents the cost to frack the most difficult formations. How much of that oil comes from high cost formations and how much from the $50 formations? Of course, an alternative explanation for the wide range in cost estimates is that no one knows until they start drilling and find out after-the-fact.
If production from North Dakota is most at risk, what does this say about all of the economic activity supporting that region (viz., banking, home construction, entertainment, etc.)? Back to the days of King Wheat?
Finally, if Europe’s slump is prolonged and demand remains weak for a long time, what does this say about the economic viability of the northern leg of Keystone?
I think you’re touching on one of the interesting points, Slugs. Right now, it’s extraordinarily difficult to determine what marginal cost is and who has it.
The bullish case for shales reads like this: shales are subject to a wide range of marginal costs by producer and region, and within regions, to “sweet spots” and more marginal areas. As prices decline, marginal shale players will be pushed out but core shale players will be able to continue to expand production, essentially an intra-sector cannibalization. Thus, marginal cost will decline over time.
This is exactly what happened in shale gas, where the Marcellus cannibalized the Barnett, Fayetteville and most particularly, the Haynesville. Shale production expanded until price was brought down marginal cost. At this price, demand growth was limited to inherent demand growth, call it 1-2% per year in the US. The Marcellus was still able to grow much more quickly at lower prices, thereby displacing production from both conventional sources like the GoM, and from other unconventional sources, like the Haynesville.
There are some differences. Oil has to move the global needle, not just the national one, as oil is traded globally and US natural gas is not. Second, the gas resource seems comparatively bigger than the oil resource. But still, if you could continue to add 1.5+ mbpd / year from North American unconventional oil, well, that could have a material impact on oil prices globally. The dust has settled yet.
The dust has yet to settle.
I’ve seen reports suggesting Saudi Arabia has locked in deals for November that would boost Saudi market share. The cartel-logic is that this represents a threat to other OPEC members, who are currently ignoring production limits.
Add that to the Russia/ISIS et al motive and Saudi Arabia is pretty clearly OK with the price level for now. This also gets OPEC off the hook for the global slowdown. Saudi Arabia is probably not happy about the slowdown, but when you get lemons…
It may not have anything to do with the wide range of that estimate but doesn’t the marginal cost of production for a given well or field rise quickly for enhanced extraction? Couldn’t $50 be right this year and $100 be right in a few years’ time?
Excellent points, Bailts…Last week, Mr Morse, publicly stated in Barrons, that North Dakota E&Gs could still
produce oil profitably at $75 per barrel.
Professor Hamilton & Others
A few questions from the bleacher seats.
Any comments about the EIA’s Short Term Energy Outlook that shows supply and consumption fairly close out to 2015? How much of a spread is needed to keep prices “low” for an extended period of time? Has the EIA “correctly” estimated the supply due to the tight oil production? Is there a model that reasonably forecasts price based upon supply and consumption?
We’re Sitting on 10 Billion Barrels of Oil! OK, Two
http://www.bloomberg.com/news/2014-10-09/ceos-tout-reserves-of-oil-gas-revealed-to-be-less-to-sec.html
You are correct, Mr Brown, however, it is done so because these oilers (public) need
to file with the SEC and of course it is better to under report that over and face legal
and civil action from our overseers.
Or, in the alternative, speculative resource numbers could result in virtually zero proven reserves, e.g., the Monterey Shale Play.
I don’t know if companies ever claimed proven recoverable reserves in the Monterey Shale, but companies were clearly spending a lot of money attempting to convert resource estimates to proven reserves. I remember that one independent completed about 30 wells in the Monterey Shale Play, without ever reporting a successful completion (I suspect that they did not want to report the production rates, because they were so low).
What’s causing decline in crude oil: Dan Dicker
http://www.cnbc.com/id/102078540
Nonsense, from the CNBC Bureau…This route in collapsing prices is not due to specs
but rather an oversupply and declining demand, in part to a very large slowing of the
world economic machine..
This has been in the offing for several years…Higher prices begets higher production,
until the cycle repeats itself.
There is now a very greater likelihood of goo reaching the $75 p/b level and perhaps even
lower levels.
Globally, so far (through 2013) I think that this has been true for natural gas and associated liquids, condensate and natural gas liquids (NGL), but almost certainly not for actual crude oil production (45 and lower API gravity crude oil).
And as noted below, despite annual Brent prices doubling from $55 in 2005 to the $110 range for 2011 to 2013 inclusive, Global Net Exports of oil have been below the 2005 rate for eight straight years.
Peak (Crude) Oil in 2005?
In my opinion it is very likely that actual global crude oil production (45 or lower API gravity crude oil) peaked in 2005, while global natural gas production and associated liquids (condensates & natural gas liquids) have so far continued to increase.
I’ve always thought it odd that when we ask for the price of oil, we get the price of 45 or lower API gravity crude oil, but when we ask for the volume of oil, we get some combination of crude oil + condensate + NGL (Natural Gas Liquids) + biofuels + refinery gains.
This is analogous to asking a butcher for the price of beef, and he gives you the price of steak, but if you ask him how much beef he has on hand, he gives you total pounds of steak + roast + ground beef. Shouldn’t the price of an item directly relate to the quantity of the item being priced, and not to the quantity of the item plus the quantity of (partial) substitutes?
In any case, the closest measure of global crude oil production that we have is the EIA data base that tracts global Crude + Condensate (C+C). In regard to this data base, a key question is the ratio of global condensate to C+C production. Unfortunately, we don’t appear to have any global data on the Condensate/(C+C) Ratio. Note that when the EIA discusses “crude oil” they are talking about C+C.
Insofar as I know, the only complete Condensate/(C+C) data base, from one agency, is the Texas RRC data base for Texas, which showed that the Texas Condensate/(C+C) ratio increased from 11.1% in 2005 to 15.4% in 2012. The 2013 ratio (more subject to revision than the 2012 data) shows that the 2013 ratio fell slightly, down to about 15%, which probably reflects more focus on the crude oil prone areas in the Eagle Ford. The EIA shows that Texas marketed gas production increased at 5%/year from 2005 to 2012, versus a 13%/year rate of increase in Condensate production. So, Texas condensate production increased 2.6 times faster than Texas marketed gas production increased, from 2005 to 2012.
The EIA shows that global dry gas production increased at 2.8%/year from 2005 to 2012, a 22% increase in seven years. If the increase in global condensate production only matched the increase in global gas production, global condensate production would be up by 22% in seven years. If global condensate production matched the 2005 to 2012 Texas rates of change (relative to the global increase in gas production), global condensate production would be up by about 67% in seven years.
In any case, we don’t know by what percentage that global condensate production increased from 2005 to 2012. What we do know is that global C+C production increased at only 0.4%/year from 2005 to 2012. In my opinion, the only reasonable conclusion is that rising condensate production accounted for virtually all of the increase in global C+C production from 2005 to 2012, which implies that actual global crude oil production was flat to down from 2005 to 2012, as annual Brent crude oil prices doubled from $55 in 2005 to $112 in 2012.
The following chart shows normalized global gas, NGL and C+C production from 2002 to 2012 (2005 values = 100%).
http://i1095.photobucket.com/albums/i475/westexas/Slide1_zps45f11d98.jpg
The following chart shows estimated normalized global condensate and crude oil production from 2002 to 2012 (2005 values = 100%). I’m assuming that the global Condensate/(C+C) Ratio was about 10% for 2002 to 2005 (versus 11% for Texas in 2005), and then I (conservatively) assume that condensate increased at the same rate as global gas production from 2005 to 2012, which is a much lower rate of increase in condensate (relative to the increase in gas production) than what we saw in Texas from 2005 to 2012.
http://i1095.photobucket.com/albums/i475/westexas/Slide2_zpse294f080.jpg
Based on foregoing assumptions, I estimate that actual annual global crude oil production (45 or lower API gravity crude oil) increased from about 60 mbpd
(million barrels per day) in 2002 to about 67 mbpd in 2005, as annual Brent crude oil prices doubled from $25 in 2002 to $55 in 2005.
At the (estimated) 2002 to 2005 rate of increase in global crude oil production, global crude oil production would have been up to about 90 mbpd in 2013.
As annual Brent crude oil prices doubled again, from $55 in 2005 to an average of about $110 for 2011 to 2013 inclusive, I estimate that annual global crude
oil production did not materially exceed about 67 mbpd, and probably averaged about 66 mbpd for 2006 to 2013 inclusive.
Mr Brown said: “And as noted below, despite annual Brent prices doubling from $55 in 2005 to the $110 range for 2011 to 2013 inclusive, Global Net Exports of oil have been below the 2005 rate for eight straight years.”
This is indeed true and quite an extended period of time with little increase in crude production.
Why, I do not known perhaps a variety of events which effected production but certainly NOT Peak Oil.
One would need a much longer period of time, to suggest that crude oil growth was coming to an end.
It would also mean accelerated price increases as well and not declining oil prices.
If one back tracks some twenty years or so, both non and OPEC production has seen growth.
http://www.wtrg.com/oil_graphs/PAPRPOP90.gif
http://www.wtrg.com/oil_graphs/USSR90.gif
http://www.wtrg.com/oil_graphs/PAPRPNT.gif
I have said it before, as spare capacity declines crude oil prices will
rise.
http://www.wtrg.com/oil_graphs/lspare.gif
As significant as oil is in the economic well being of nations and
it’s complexities, it maybe rather difficult to find all cause and effects.
Also remember, that 70% of reserves and production are controlled by
government units, which is less than desirable for optimal market conditions
and performance..
Unfortunately, none of your links worked for me. In any case, some clarification is in order.
What the EIA calls Crude Oil is actually Crude + Condensate, and Condensate is a byproduct of natural gas production. Insofar as I know, there is no global data base for actual crude oil production (45 and lower API gravity crude). But as noted above, based on some very reasonable assumptions, it’s very likely that we have not seen a material increase in global crude oil production since 2005.
When we calculate net exports, we have to use total petroleum liquids (BP data base) or total petroleum liquids + other liquids (EIA data base).
Following is my 2002 to 2012 “Gap Chart” for Global Net Exports of oil (GNE*):
http://i1095.photobucket.com/albums/i475/westexas/Slide1_zps3161a25b.jpg
Note the very large increase in GNE as annual Brent crude oil prices doubled from $25 in 2002 to $55 in 2005. At the 2002 to 2005 rate of increase, GNE would be at about 70 mbpd in 2013, versus the actual value of 43 mbpd.
As annual Brent crude oil prices doubled from $55 in 2005 to the $110 range for 2011 to 2013 inclusive, GNE have been below the 2005 rate for eight straight years (at 43 mbpd in 2013).
And as China & India have (so far) increased their oil consumption as oil prices increased, Available Net Exports (ANE, or GNE less Chindia’s Net Imports, CNI) fell from 41 mbpd in 2005 to 34 mbpd in 2013.
Here’s the problem: Given an inevitable ongoing decline in GNE, unless China and India cut their net imports at the same rate as the rate of decline in GNE, or at a faster rate, the resulting rate of decline in ANE will exceed the GNE decline rate and the ANE decline rate will accelerate with time.
Here are the observed 2005 to 2013 rates of change in GNE and ANE (EIA data):
GNE: -0.8%year
ANE: -2.3%/year
*GNE = Combined net exports from top 33 net exporters in 2005
As a matter of simple logic, the fact the there is a trend in place reflecting medium-term supply and demand dynamics in no way excludes an effect in the short run from shifts in speculative positions. If your knowledge is limited to physical market factors, you really have no basis for commenting on the issue of short-term price moves. Are you claiming to know what specs were doing during the $4 move in question?
The chart makes it look like $80 might be a floor. In any case I’d be very surprised if it’s $60.
One factor that seems to be lost on many is the security premium may have declined as people became less worried about events in the Middle East region . I would ascribe a good part of the decline to this factor ( about 15-35 %) .The rest is due to slower economic slowness in China and else where ,Libyan production , and the belief among many that the Saudis will not play the swing producer role .
Fawaz Alfawaz
Riyadh based economic consultant .
The rapprochement between Iran and the USA as well as Saudi Arabia and Iran may have contributed to a lowering of the risk premium. Clearly IS wants to conquer and then sell oil as opposed to destroy oil infrastructure. Ironically enough IS has pushed a number of players to coalesce around a common cause.
I do not understand what the Saudis can cost effectively do here to support prices while US production surges.
(In passing, lower oil prices will not and I repeat will not materially punish IS or ISIL. I do not see any particular reason why the Saudis would want to punish the Russians. Some American pundits should stop projecting their own peculiar national interests.)
Is it time to discipline the quota busting members of OPEC again? Or is the Kingdom of Saudi Arabia resigned to the fact that the only way to discipline far too productive American oil producers is to allow the commodity price to collapse?
Perhaps the Saudis do not want to play the swing producer role in this case because they perceive withdrawing barrels in this case as ineffective.
Who are the discipline-busting members of OPEC?
You have returning Libyan production., but they are just returning to traditional levels, and still just over half of typical output.
In September, Iraq produced less than it did in Sept. 2012.
Iranian production is 1 mbpd below traditional levels.
Venezuela, Angola, Nigeria, Kuwait, Qatar, UAE and Ecuador are all flat to down.
Saudi Arabia is down only marginally.
That’s everyone in OPEC.
So who exactly are we trying to discipline?
You know, there are a lot of smoke-filled back rooms in Europe and the Middle East just now. A lot of deals are being made for political, rather than economic, reasons. That would seem to be a more reasonable place to look.
Precisely Steven.
The question about disciplining quota-busting OPEC members was meant as rhetorical given that most OPEC members are experiencing difficulties maintaining current production levels let alone increase them as you point out.
It is fun to discuss how the Saudis make decisions. But let us focus on what is the prime economic challenge from their perspective at this juncture: catering oil prices.
OPEC production could either be insufficient or too painful for some member states. The No. 1 challenge is growing US production and reduced US imports. The only mechanism the Saudis have for disciplining US production is to allow prices to fall well below the threshold of risk-adjusted profitability for US tight oil explorers and producers. It might also be helpful if a few more Canadian heavy oil projects were mothballed for the foreseeable future.
Rather than coming up with dramatic images of smoke-filled back rooms, perhaps it is more useful to wonder about what the experts that work for various Saudi and OPEC agencies think. What are they advising their ministers, their governments to do? I have in mind all those well-educated economists, financial experts and applied mathematicians that toil away in OPEC and member state governments.
Stepping aside and allowing oil prices to sharply decline is the only way to get the job done. OPEC has no other way to influence North American oil production growth rates going forward. High stable prices decrease the cost North American oil e&p capital. Low and volatile oil prices will increase the cost of capital.
Short-term pain for longer-term gain. Moreover, cratering oil prices provide a legitimate excuse for either saying no to increased public expenditures, or actually cutting some public expenditures.
I am assuming that rent-seeking and special-interest politics prevail in key OPEC member states just like they appear to do in North America.
Here’s a What If.
What if the Saudis have been unable to match or exceed their 2005 net export rate of 9.1 mbpd (total petroleum liquids + other liquids, EIA), as they have been watching increasing US tight/shale production with concern.
In 2013, their net exports were 8.7 mbpd, versus 9.1 mbpd in 2005, and their net exports have been below their 2005 rate for eight straight years, as annual Brent crude oil prices increased from $55 in 2005 to the $110 range for 2011 to 2013 inclusive. This is in marked contrast to their 2002 to 2005 pattern, as they increased net exports from 7.1 mbpd in 2002 to 9.1 mbpd in 2005, as annual Brent crude oil prices doubled from $25 in 2002 to $55 in 2005.
What if they have been quietly waiting for a decline in global demand, as an opportunity to punish the tight/shale producers price wise by simply maintaining production and net exports, in the face of declining demand? And of course, they have emerged from the high demand summer season in Saudi Arabia, which frees up more oil for export.
The Saudis probably do not care a whit about the Russians, but they are eager to punish Iran and its Alawite ally Assad in Syria. Iran is hit hard by a collapse in crude oil prices.
There are rumors around that the Saudis got fed up with the Obama Admin (promised to remove Assad and under-delivered, eager to negotiate nuclear terms in Iran’s favor, refusal to put ground troops in Iraq to defeat ISIS) and that there was some real or perceived slight from SecState Kerry that contributed to the Saudi oil war on high cost, marginal shale producers in the US. We will see . . . .
Some interesting data about China’s latest oil import data follow, which are particularly interesting in the context of the longer term data (discussed below).
China’s September crude oil imports rise 7% on year to 6.74 mil b/d, exports fall to nil
http://www.platts.com/latest-news/oil/singapore/chinas-september-crude-oil-imports-rise-7-on-27719307
Following is an essay I wrote on net oil exports, which I define as total petroleum liquids + other liquids proudction less liquids consumption (EIA data). Note that Saudi net oil exports rose from 7.1 mbpd (million barrels per day) in 2002 to 9.1 mbpd in 2005, as annual Brent crude oil prices rose from $25 in 2002 to $55 in 2005.
Saudi net oil exports have so far been below the 2005 rate of 9.1 mbpd for eight straight years, falling to 8.7 mbpd in 2013, as annual Brent crude oil prices rose from $55 in 2005 to the $110 range for 2011 to 2013 inclusive.
So Far, Global Net Exports of Oil Peaked in 2005
Because of the way that we define net exports, we have to deal in terms of total petroleum liquids (plus other liquids for the EIA data set).
Some definitions:
Global Net Exports (GNE) = Combined net exports from (2005) Top 33 net oil exporters, total petroleum liquids + other liquids (EIA), which accounted for about 99% of total global net exports of oil in 2005
Available Net Exports (ANE) = GNE less Chindia’s Net Imports (CNI)
CNE = Cumulative Net Exports (for a given time period)
ECI (Export Capacity Index) Ratio = Ratio of production to consumption
GNE/CNI Ratio is analogous to the ECI Ratio
Six Country Case History. The Six Country Case History consists of the major net oil exporters (net exports of 100,000 bpd or more) that hit or approached zero net exports from 1980 to 2010, excluding China. China, like the US, became a net importer prior to a production peak, because of a rapid rate of increase in consumption. Combined production from the Six Countries virtually stopped increasing in 1995, showing only a 2% increase from 1995 to 1999.
The following chart shows the normalized values for production, ECI Ratio, net exports and remaining post-1995 CNE (Cumulative Net Exports) by year (1995 values = 100%).
http://i1095.photobucket.com/albums/i475/westexas/Slide2_zps6c3a6280.jpg
Note that even as production increased slightly from 1995 to 1999 (by 2%), net exports fell, because of rising consumption, as illustrated by the decline in the ECI Ratio. And note that even as production increased from 1995 to 1999, remaining post-1995 CNE fell by 54%.
Estimated Six Country post-1995 CNE were about 9.0 Gb (billion barrels) based on the 1995 to 2002 rate of decline in their ECI ratio. Actual post-1995 CNE were 7.3 Gb.
The key point is that a declining ECI Ratio corresponded to a rapid rate of depletion in remaining CNE, and even as Six Country production rose from 1995 to 1999, the rate of depletion in remaining post-1995 CNE accelerated, from 15%/year in 1996 to 26%/year in 1999.
Global Net Exports of oil (GNE). GNE, the combined net exports from the top 33 net exporters in 2005, fell from about 46 mbpd (million barrels per day) in 2005 to about 44 mbpd in 2012. Preliminary 2013 data show that GNE in 2013 fell to 43 mbpd. Combined production from the top 33 net exporters in 2005 rose slightly from 2005 to 2013, but because consumption increased faster than production, net exports fell, as evidenced by the decline in the ECI Ratio.
The following chart shows the normalized values for production, ECI Ratio, net exports and estimated remaining post-2005CNE (Cumulative Net Exports) by year (2005 values = 100%).
http://i1095.photobucket.com/albums/i475/westexas/Slide14_zpsbd9a272e.jpg
Based on the 2005 to 2012 rate of decline in the Top 33 ECI Ratio, I estimate that remaining post-2005 Global CNE fell by about 21% by the end of 2012. As noted above, this methodology was too optimistic for the Six Country Case History, in regard to estimating post-1995 CNE.
Available Net Exports of oil (ANE). ANE are defined as Global Net Exports of oil (GNE) less the Chindia regions (China + India’s) net imports (CNI). ANE fell from 41 mbpd in 2005 to 35 mbpd in 2012. Based on the preliminary 2013 data, ANE fell to 34 mbpd in 2013.
The GNE/CNI Ratio is analogous to the ECI Ratio. The following chart shows 2002 to 2012 GNE/CNI data, with the extrapolation based on the 2005 to 2012 rate of decline in the ratio.
http://i1095.photobucket.com/albums/i475/westexas/Slide20_zps26112103.jpg
At a GNE/CNI Ratio of 1.0, China and India alone would theoretically consume 100% of Global Net Exports of oil, leaving no net oil exports available to about 155 net importing countries. Of course, the global economy can’t survive if only two countries are consuming anywhere close to 100% of Global Net Exports of oil, but that has been direction we have been headed in since 2002, up to and including 2013.
I’ve called what happens from 2012 to 2022, and in following years, to the GNE/CNI Ratio the “$64 Trillion Question.” The conundrum is that we continued to slide, at least through 2013, toward a point in time–a GNE/CNI Ratio of 1.0–that we cannot arrive at.
Jeffrey,
How do your calculations and charts relate to the price of petroleum? It seems from your charts that the price should not decline. Also, looking at world supply and consumption on the EIA website supply and consumption seem fairly balanced. I have a difficult time relating your charts to the simple presentation of annual world supply and consumption. Can you help clarify for a simple mind? Thanks!
Three statements that I would assume economists would agree with: (1) The price of oil is a function of global supply & demand; (2) A net oil exporting country can only (net) export what they don’t consume and (3) The global supply of net exports (what I call GNE*, Global Net Exports of oil) is the sum of oil production from net exporting countries, less their domestic consumption.
Fluctuations in production in net oil exporting countries, e.g., currently rising production in the US and currently declining production in the UK, certainly affect the demand for GNE, but by definition said fluctuations have no (direct) impact on the supply of GNE. Given their long term track record of increasing consumption as oil prices rose from 2002 to 2013, I do focus on net imports in two net oil importing countries, China & India, in order to calculate Available Net Exports, or GNE less Chindia’s Net Imports (CNI). In other words, based on 2002 to 2013 data, the volume of GNE available to importers other than China & India is a function of what is left over after China & India buy what they want .
Basically, the data show that the demand for GNE has had to accommodate a post-2005 decline in GNE, but because of falling global demand, we saw a substantial decline in annual Brent prices from $97 in 2008 to $62 in 2009.
What we have not seen is an increase in GNE, as annual Brent crude oil prices rose from $55 in 2005 to around $110 for 2011 to 2013 inclusive. I would also note that it’s a near certainty that actual global crude oil production (45 and lower API gravity crude) has not shown a material increase since 2005.
*Top 33 net oil exporters in 2005
In your 1st paragraph, you haven’t connected assumption # with assumption #3. You imply a logical connection, but you haven’t actually made the argument that what you call GNE influences pricing the way that overall supply & demand might.
That’s “you haven’t connected assumption #1 with assumption #3. “
Some more graphs follow. The GNE/CNI graph show that China & India have been consuming a steadily increasing share of Global Net Exports of oil (a pattern which continued in 2013). As noted above, in 2013 we continued to fall to a projected point in time, a GNE/CNI Ratio of 1.0 (when China & India would theoretically consume 100% of GNE) that we cannot arrive at.
GNE/CNI Ratio Vs. Global Annual Brent Crude Oil Prices (2002 to 2012):
http://i1095.photobucket.com/albums/i475/westexas/Slide1_zps5f00c6e5.jpg
Normalized Liquids Consumption (China, India, Top 33 Exporters, US) Vs. Annual Brent Crude Oil Prices (2002 to 2012):
http://i1095.photobucket.com/albums/i475/westexas/Slide14_zpsb2fe0f1a.jpg
CORRECTION:
Fluctuations in production in net oil IMPORTING countries, e.g., currently rising production in the US and currently declining production in the UK, certainly affect the demand for GNE, but by definition said fluctuations have no (direct) impact on the supply of GNE.
Jeffrey,
I appreciate the education.
Have you done a regression model with price of Brent as a function of net export amounts or as a function of the India and China consumption ratio to world supply?
Interesting chart relating the GNE/CNI Ratio Vs. Global Annual Brent Crude Oil Prices (2002 to 2012)
Seems like the price decline should not be happening.
As noted above, we clearly saw a demand related year over year oil price decline in 2009, and an additional question is to what extent QE by central banks has been propping up demand, especially in developed countries. GNE/CNI Vs. Total Global Public Debt (2002 to 2012):
http://i1095.photobucket.com/albums/i475/westexas/Slide23_zps62b6932a.jpg
I know I am the lone voice but commodity prices are down because the world is courting deflation. This is a different assessment from my monetarist Austrian Economic brothers who are still seeing inflation behind every tree but the indicator is there. The gold ratio to world currencies has been falling. Fear over the ineffective use of monetary easing has spooked world monetary authorities and they are pulling back.
To oil specifically, many believe that lower oil prices stimulate economic development. In healthy economies that could be true, but in struggling economies lower oil prices can also be an indicator anticipated future economic decline. The world economic environment is not looking good from Asia, to Europe, to the US economies are sluggish at best.
Just for the record I was short oil for a long period based on my understanding of monetary conditions versus the price of oil. My patience has paid off significantly. I am now slightly long oil and will increase my long positions as oil declines. When oil approaches the cost of production as it did in the late 1990s marginal producers will go out of business. An economic recovery will them make the demand for oil shoot up and the price will follow, just as it did in the late 1990s and early 2000s.
It is not all driven by supply.
If you believe oil is behind GDP, then low oil prices should be a significant boost to GDP. The US is on track to add the most jobs since 1998, and initial unemployment claims are at 2006 levels. The data do not speak to a weak economy. How long does Europe stay in recession? Forever? Probably not. It’s good time to be bullish on growth.
Mr Kopits, what happens to commods with America; Red China; and the rest of
Asia goes into either a recession or slower economic growth?
EuroLand, has many serious structural deficiencies…The global debt market is
at the highest point in human history.
I will not even mention the effect and cost in fighting the vast world terrorists
organizations, which are growing by leaps and bounds.
Hans –
China ordinarily represents half of demand growth, with the other half coming from emerging markets whose growth is tied to the growth of China. China matters, and it can matter a lot.
Now, it looks like the Saudis are going to see what it takes to depress US oil production–so they could leave prices low for a while. In a supply-constrained model, we would expect to see some pent-up demand come in off the sidelines. I estimate that at 3.4 mbpd, with most of it arising from the US and Europe. So if I take an oil view of the world, then I am bullish on growth in the advanced economies, and expect to see some take-up there.
But, yes, to your question: China is central to demand growth, both directly and indirectly.
In 2011 and 2012 oil bottomed when WTI fell below $80.
I’ve been looking at that as a fairly solid floor when you start to see a significant fall in output of fracked oil.
The best leading indicator of oil prices has been the CRB:index of industrial raw material — it does not contain energy.
It is now at 507 after falling -1.55%, -0.43%, -0.42 and -1.73 over the last four months, respectively. That is the lowest level since the 2010-2011 surge in commodity prices.
The change in the CRB: raw material index has a very strong correlation with world industrial production growth. Over the last six months world industrial production growth has been essentially zero– in July it was still below its January reading. Oil prices also have a strong correlation with world industrial production growth.
Good to see you back on the screen. Where you been?
$2.72/gallon regular this morning. Offsets some of the much higher food prices we’ve been experiencing. The pendulum will swing the other way… on both… unless some government tries to “fix” the marketplace.
Hi
Why has no one brought up the fact that the U S is dropping the price of oil in order to destabilize the russian economy?
The U S, Saudi, and UAE are all colaborating to punish Russia for its intrusion in Ukraine and support of Assad in syria
And here is something to support you @Dan m http://fuelfix.com/blog/2014/04/13/russia-and-the-ukraine-the-energy-angle-part-2/
Dan,
Look way up toward the top of the stack for Steve Kopits. He started a brief exchange about Russia, ISIS and Saudi Arabia.
As I understand it, Russia has budgeted for $100/bbl Brent next year, with 40% of government revenue coming from oil. Loss of access to foreign investment, falling oil and non-oil revenue and a substantial drain on reserves is a bad combination. At a quess, Europe has no reason to fear a gas cut-off from Russia this winter. Russia may be in the perverse situation of facing higher inflation due to falling energy prices, through the ruble exchange rate.
Jeffrey,
Do I read the EIA website correctly that as of the end of 2013, if North America can produce about 5.2 million additional barrels per day North America would be self-sufficient, leaving Europe and non-China and non-India Asian and Oceana to compete with China and India for the remaining world production?
Can north America reasonably produce another 5.2 million barrels per day?
In 2013, the US + Canada + Mexico produced 18.2 mbpd of total petroleum liquids + other liquids. Combined consumption was 23.3 mbpd.
It’s possible that these three countries might close the gap, but it’s worthwhile to remember that combined net exports from Mexico + Canada were flat from 2004 to 2013 (at 2.5 mbpd), as rising net exports from Canada offset declining net exports from Mexico. Of course, it’s possible that Mexico’s production might rebound as they allow foreign oil companies into Mexico. However, I have not heard what kind of effective royalty that foreign companies are looking at in Mexico (companies would have to evaluate the effective royalty in Mexico versus the US & Canada) and in addition if they nationalized once, they could nationalize again.
But the key problem facing the US is high, and rising, decline rates as an increasing percentage of total production comes from high decline rate tight/shale plays.
Note that a few years ago, circa 2005 or so if memory serves, ExxonMobil put the global decline rate from existing oil wells at about 4% to 6% per year.
The EIA’s numbers for the decline rate from existing Bakken and Eagle Ford Shale Play oil wells are at about 6% and 8% respectively, except that they are talking about per month, rather than per year, decline rates.
If we combine the December, 2013 EIA numbers for Bakken + Eagle Ford, they produced 2.2 mbpd of Crude + Condensate (C+C) in December, 2013.
If we extrapolate the EIA’s estimates for month over month declines in legacy production*, the oil wells completed in these two plays in 2013 and in prior years would be down to a combined production rate of about 0.9 mbpd in December, 2014, about a 60% decline in one year.
Or, in other words, based on EIA data, the industry would have to add 1.3 mbpd of new production from 12/13 to 12/14, just to offset declines from existing Bakken and Eagle Ford wells (completed in 2013 and prior years).
It’s when, not if, that companies can no longer offset the declines from existing production, i.e., Peaks Happen.
*If we are looking an projecting multi-year declines, one would need a hyperbolic or two-step exponential decline estimate for wells producing at the end of 2013, but for just 12 months, I think it’s reasonable to extrapolate the current EIA monthly estimates.
Or, let me put it this way.
Combined North American Crude + Condensate (C+C) production in 2013 was 13.3 mbpd. If we assume a (conservative) annual decline rate from existing production of about 10%/year for North American production (and as noted above, the EIA estimates that existing Bakken + Eagle Ford wells will decline by about 60% from 12/13 to 12/14), in order to just maintain about 13 mbpd of C+C production, we would need to replace 100% of current North American C+C production over the next 10 years, i.e., in 10 years we would have to replace the productive equivalent of every source of Crude + Condensate in North America.
Jeffrey,
Thanks, as always I appreciate the education. I notice that if one normalizes to 2006 the production of Crude Oil, NGPL, and Other Liquids as shown on the EIA website, production is up 6.7 million barrels per day from 2006, which is about a 92% increase. If I understand what you are saying, these increase statistics partly mask the production of oil due to the combination reporting of other products; and as more oil is produced by the USA from tight oil, we must contend with the depletion of “old” wells, thus it is unlikely that the USA or North America can become self-sufficient in oil production.
I think that Professor Hamilton has demonstrated the new production and old depleting production on charts. Maybe he could show us those charts again.
Mr Brown, I applaud your effort to inform that a great deal of production
are not crude oil based…This is indeed very import but we should not forget
that Condensate also play a very important energy role.
Perhaps, if you wish, you could coin a new word – Crudensates!
Here is a chart showing the yields for various products, by API Gravity:
http://i1095.photobucket.com/albums/i475/westexas/Refineryyields_zps4ad928eb.png
Note that they call 42 API gravity crude oil “Condensate.”
In any case, the distillate yield (diesel, jet fuel, heating oil) just going from 39 API gravity to 42 API gravity drops by about half, from about 24% to about 12%, with a very large increase in gasoline yield. You can imagine how little distillate that refiners get from 45 and higher API gravity condensate.
Take any numbers regarding cost of shale production with grain of salt. Citi likely right with big range. Impacted by productivity of shale play (Permian better than Bakken), royalty interest to landowner (can range from 12.5% to 25%), location within play, and operating efficiencies of operator within play (some companies have bigger discount from service providers or use own rigs, which can lower costs) among other factors. US production going up, so even with lower prices may just go up less.
Another big factor is when Russia or Iran or another country whose economy is driven by oil produce more and sell the oil at a higher price their economy goes into high gear and they use more oil. US shale production does not meaningful increase US oil usage. Thus a barrel of US shale oil reduces the call on OPEC oil by more than 1 barrel (i., e., the barrel it replaces plus another portion of a barrel which is not used because the oil producing countries economy is not as robust because of lower prices for its oil).
ISIS continues to advance in Iraq:
http://www.cbsnews.com/news/isis-captures-iraq-army-camp-as-bombs-hit-baghdad/
Have the odds on the survival of Venezuela’s government changed in the past few weeks?
Spencer,
You and I have had our differences but I have always admired your logic. Recently you have appeared almost conservative compared to some posting here. Good job!
Historically, WTI has traded at a small premium to Brent.
For the last few years Brent has traded at a significant premium to WTI. that was because transportation bottlenecks limited the supply of WTI reaching world markets.
As the bottlenecks are removed — new pipelines, etc., — I would expect the historic norm of WTI trading at a small premium to Brent to reemerge.
Why wouldn’t it.
Ricardo, thanks. My oil analysis is just what I’ve been telling my paying clients for the past several months.
Often, I use blogs as an outlet for more extreme views that I do not normally let my portfolio manager clients see.
I think Light Louisiana Sweet is the defacto benchmark for tight oil from Eagle Ford and Bakken and it trades closer to Brent than WTI. There have been a number of pipeline reversals, expansions and new builds happening over the past year and which will continue into next year. US will probably need to amend the Jones Act to allow oil exports.