The world is awash in oil, I’m hearing. The problem is, it’s fairly expensive oil.
Take for example Canada. The country has managed to increase its production of oil by a million barrels a day over the last decade. But almost all of that increase has come from oil sands. If you consider only conventional crude oil, Canadian production today would be a third of a million barrels a day lower than at its peak in 1973.
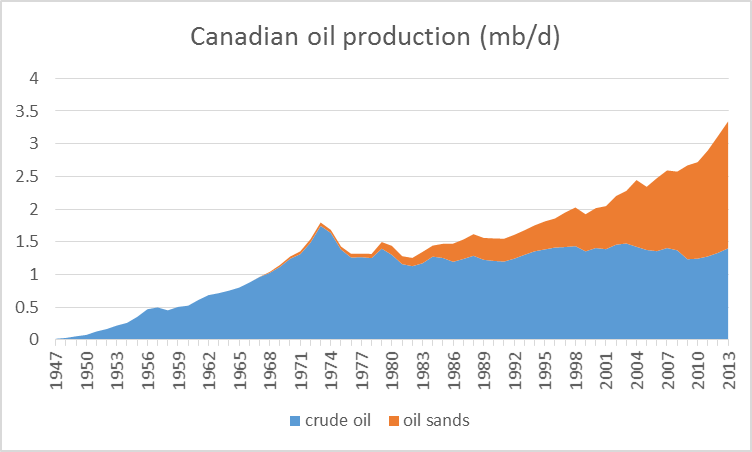
Canadian production of crude oil, 1947-2013, in mb/d. Blue: Conventional crude plus lease condensate. Orange: oil sands. Data source: Canadian Association of Petroleum Producers.
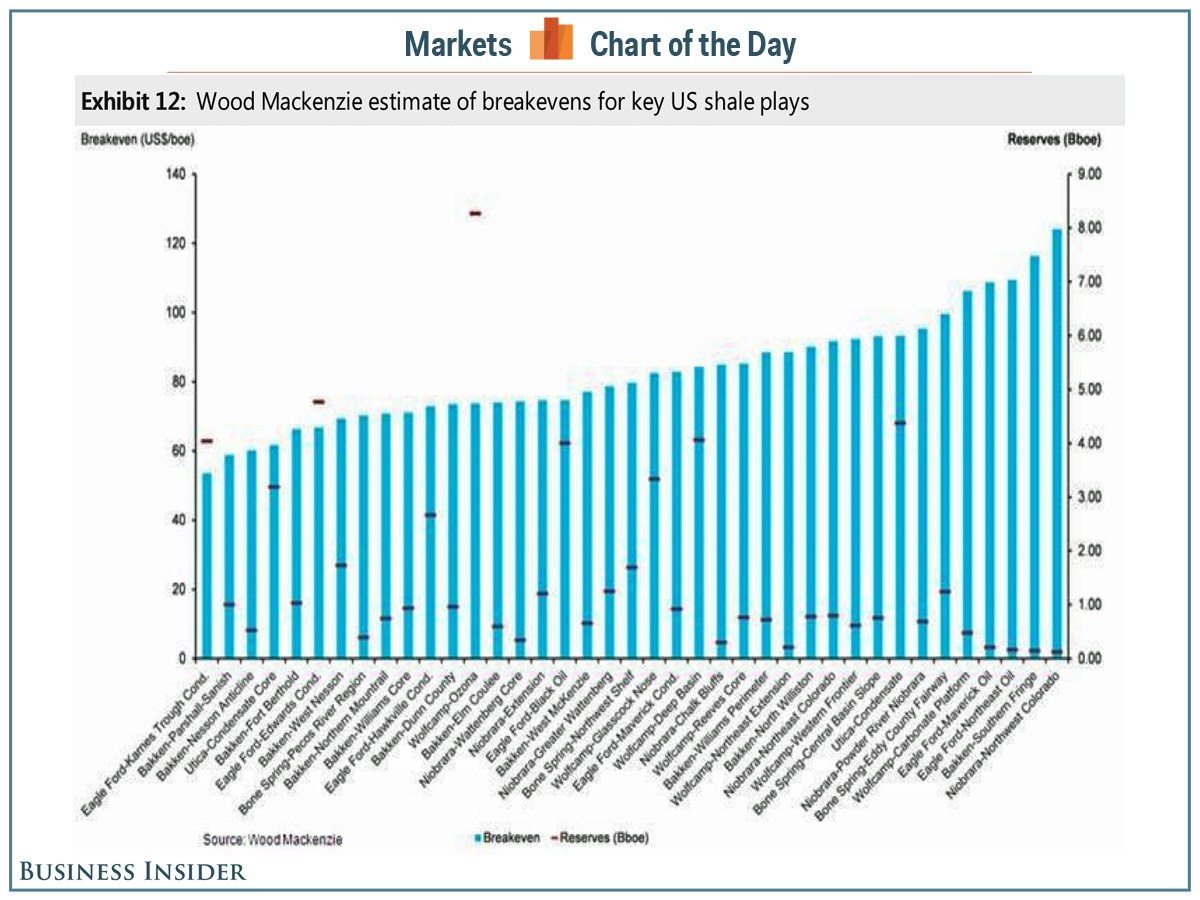
Even without counting environmental costs, that stuff’s not cheap. It was profitable when West Texas Intermediate was over $90. But last week WTI closed at $66. Here are some of the estimates from the Wall Street Journal:
The break-even price for new oil-sands surface mines is among the most expensive in the world, at around $85 a barrel, according to Bank of Nova Scotia . Operating costs at existing mines are less than half that amount. But the break-even point for so-called in situ projects, in which bitumen is heated and pumped up to the surface, range between $40 a barrel and $80 a barrel. Such projects represent the majority of future growth.
Or consider the United States, where production has grown 2 mb/d since 2004. More than 3 mb/d of that growth has come from fracking of oil trapped in tight geologic formations. Without tight oil, U.S. production would be down more than a million barrels a day over the last ten years and down 5-1/2 mb/d from its peak in 1970.
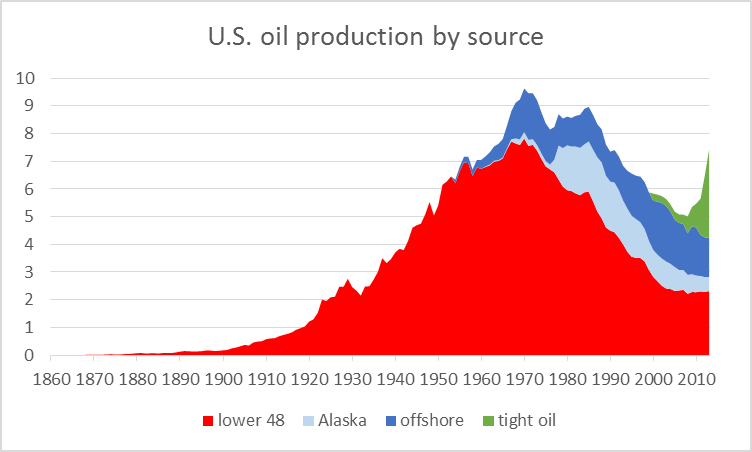
U.S. field production of crude oil, by source, 1860-2013, in millions of barrels per day. Source: Hamilton (2014).
Estimates again vary, but prices this low have to severely inhibit new investment in U.S. tight oil. Without continuing new drilling, U.S, tight oil production would quickly fall. And the economics of deep ocean drilling, which has also been important in supporting production in the U.S. and around the world, have become even more difficult at today’s low prices.
Source: Business Insider.
Why am I talking about the costs for Canadian and U.S. oil producers? Because if it had not been for the success of Canada and the United States, world production of crude oil would be down overall over the last decade.
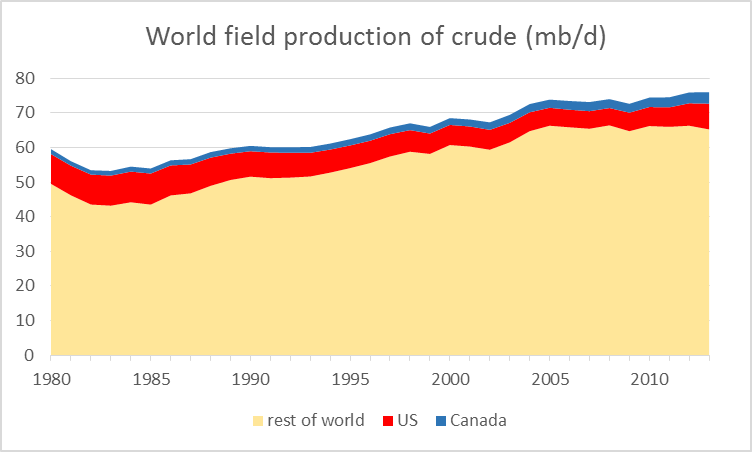
World field production of crude oil and lease condensate, 1980-2013, in millions of barrels per day. Data source: EIA.
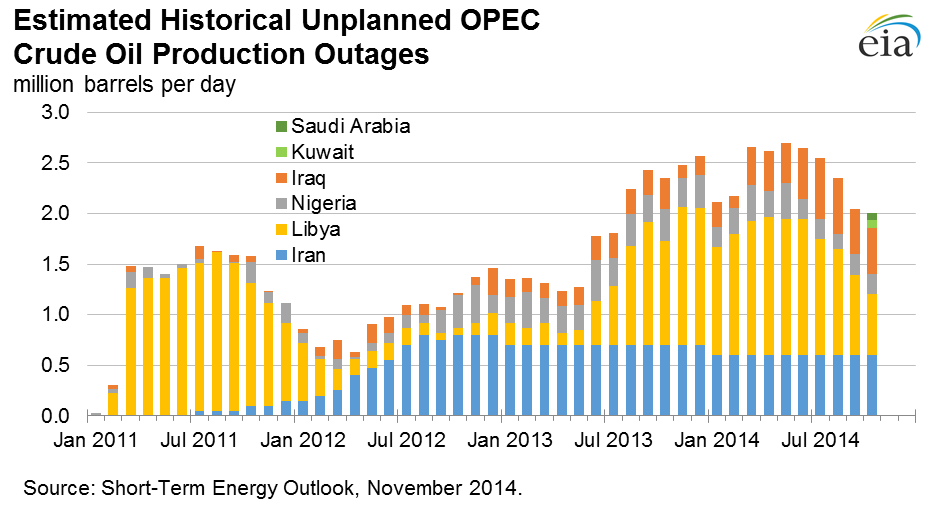
Granted, some of the stagnation in global output has been due to geopolitical disruptions, Libya being the most important example. And Libyan production rebounded significantly this fall, contributing to the current excess supply.
Source: EIA.
But Libya remains a very unstable place. It does not take much imagination to see the recent gains there being reversed again over the next few months. Nor does one have to be an excessive worrier to be concerned about the possibility of geopolitical turbulence in places like Nigeria and Iraq taking out more of their production, which between them accounted for 5.4 mb/d of last year’s world oil supply.
So here’s the basic picture. The current surplus of oil was brought about primarily by the success of unconventional oil production in North America, most new investments in which are not sustainable at current prices. Without that production, the price of oil could not remain at current levels. It’s just a matter of how long it takes for the high-cost North American producers to cut back in response to current incentives. And when they do, the price has to go back up.
Here’s my advice to anybody who’s contemplating selling $85 oil at $66 a barrel– don’t do it. If you can wait a few years, that $85 oil will be worth more than it costs to produce. But selling it at a loss in the current market is a fool’s game.
Lower oil prices will boost world economic growth and higher world economic growth will boost oil prices.
“So here’s the basic picture. The current surplus of oil was brought about primarily by the success of unconventional oil production in North America, most new investments in which are not sustainable at current prices. Without that production, the price of oil could not remain at current levels. It’s just a matter of how long it takes for the high-cost North American producers to cut back in response to current incentives. And when they do, the price has to go back up.”
Well, yeah. The one thing we can rely on is that the price of oil will fluctuate and that supply will adjust to demand. http://www.macrotrends.net/1369/crude-oil-price-history-chart
JDH Here’s my advice to anybody who’s contemplating selling $85 oil at $66 a barrel– don’t do it.
Understand, but that sort of begs the question why are people selling at $66/barrel when they know they shouldn’t? Are they myopic? I’m guessing they are selling at distress prices because they have no choice. I just wish I knew what those constraints were. And of course the flip side is to ask why people aren’t buying as much as they can at $66/barrel. It sounds like you are saying that the market is having a hard time settling into an equilibrium price; i.e., prices oscillate between overshooting and undershooting, but always seem to blow past what might seem to be an equilibrium price. Perhaps better advice for anyone who is contemplating getting into the oil business – don’t do it.
It seems like we have one (more or less) fungible commodity that has two or three different production cost thresholds, but a very inelastic supply range within each threshold range. In other words, oil production costs are best seen as step functions and it just so happens that we’re always stuck on the edge of the step. Perhaps our resident oil production experts could elaborate on the production functions for oil.
I assume one of the oil experts can say this better, but I’ve seen many examples where people sell at a loss on purpose. Why? Because they have loans outstanding that need to be paid, because they have already sunk $x in costs and recovering something makes the loss manageable, because there’s a cost to not selling (like storage or transport arrangements already made or, in some cases, spoilage).
Shut down and start up costs.
The last two sentences of your second to last paragraph (“So here’s the basic picture”), read as follows: “It’s just a matter of how long it takes for the high-cost North American producers to cut back in response to current incentives. And when they do, the price has to go back up.”
You forget to mention that when prices go back up, those high prices will invite the same producers who dropped out of the market when prices fell lower. This is a classic prisoner’s dilemma that plagues commodity producers who have invested meaningful sums of cash (aka, debt) into production capacity during periods of high prices only to be displaced out of the market by low spot prices, but are ready at the helm to ramp production once prices rebound so they can at least cover the carry of their debt obligations and avoid default. Paying off said obligations and even (gasp!) returning equity to investors is a secondary or even tertiary matter at this point.
Your advise to not sell oil at $66 a barrel thus assumes a sustainable rebound in spot prices. This is akin to advising a prisoner not to rat out their accomplice because their (rational?) accomplice will surely not rat them out. The problem is, this is an unknown assumption that could prove to be very, very costly. Thus selling at a loss may in fact not be a fool’s game, but may be a rational hedge to even lower prices or dealing with pressing financial demands.
The true fool’s game is to focus on spot prices alone. The game optimal approach is to look at supply and demand dynamics. With marginal increases in supply having outpaced marginal increases in demand, it is now a buyer’s market and a seller’s nightmare in financial hell. Or worse, margin call hell.
Economic theory clearly states that in an industry with high fixed cost that it minimizes loses to continue production as long as your revenues exceed your variable costs.
The fixed cost of drilling and pipelines will have to be met regardless of what your revenues are.
As long as you have some revenues to apply to the fixed cost you are better off than if you had zero revenues.
2slugbaits,
One reason to sell when distressed prices are all that is available is to maintain cash flow–you have to keep the lights on. $66 dollars a barrel is better than no dollars a barrel. Cash flow is king in the oil patch.
For all: does anyone have any numbers on Libyan exports of crude? All I’ve seen are production figures; lots on Libya bringing production up but nothing on how much of it is sold. I’m wondering if any of it reaches the world market.
Thanks.
Slugs –
Libya consumes about 250 kbpd.
It’s production has risen from 240 kbpd in June to 980 kbpd in October. We can assume the vast majority of the increase was exported.
http://www.eia.gov/countries/country-data.cfm?fips=LY
Sorry, should have addressed Synapsid.
Thanks Steven.
I dunno, if I read the link you provided correctly, the data were last updated on May 30, 2013. My concern is that we’re being provided now with data from what amounts to a failed state, and with no corresponding supporting data (especially from outside sources) on exports I wonder if we should believe the production data.
Gold at $1175
Oil at $66
Gold is indicating a significant fall in the purchasing power of the dollar. The FED has sterilized much of the QE that Bernanke dumped into the economy. Bonds are no longer paying banks interest because they are now owned by the FED. The economy is not growing but tax receipts are remaining high. The Treasury will need less to balance the budget. There will be no budget battles until the new year and with the Republicans controlling congress spending will decline. President Obama cannot create spending so if congress does not appropriate spending all he can do is veto spending.
2015 will be a very difficult year. Obamacare is going to drain huge resources from businesses and government spending will continue to decline. If the FED stabilizes the currency oil stabilize between $85 and $90, but if President Obama prevents any recovery efforts declines could continue.
“One reason to sell when distressed prices are all that is available is to maintain cash flow–you have to keep the lights on.”
It’s more than just keeping the lights on. The fracking frenzy is just the sub-prime racket all over again for Wall Street. These wells are financed by Wall Street debt and drillers have to keep pumping to make payments or else default.
85$ oil will be a long wait. Petroleum demand peaked in the US in 2005, three years even before the financial crisis (check the figures for US demand here: http://www.bp.com/en/global/corporate/about-bp/energy-economics/statistical-review-of-world-energy.html ). The reasons: much higher production of ethanol, which directly displaces gasoline demand, and remember, the corn harvest this year is a record, and the fact that the first casualty of higher output from renewables in electricity appears to have been oil, where its use in electricity generation, which was never important but did absorb quite a few barrels of oil, has basically disappeared. Check the EIA’s Monthly Energy Review’s electricity section for this; look for the table that gives you fuel consumption.
The US is the biggest consumer of oil, and our demand is down for reasons that aren’t going away. So waiting for $85 barrel oil is not a real good strategy.
It’s another cyclical downturn in oil prices. So far, we have seen a pattern of higher annual highs and higher annual lows, e.g., the annual price of Brent fell from $97 in 2008 to $62 in 2009 (monthly prices fell from $132 in June, 2008 to $43 in February, 2009).
While we have recently seen some signs of softening demand in China, the developing countries, led by China, have (so far) been consuming an increasing share of a post-2005 declining volume of Global Net Exports of oil (GNE*). The volume of GNE available to importers other than China & India fell from 41 mbpd in 2005 to 34 mbpd in 2013.
Here is a chart showing normalized liquids consumption for China, India, the (2005) Top 33 net oil exporters and the US, with 2002 consumption = 100%, for 2002 to 2012 (same trends continued in 2013, al though the US has been showing an increase in consumption recently):
http://i1095.photobucket.com/albums/i475/westexas/Slide14_zpsb2fe0f1a.jpg
*Combined net exports from top 33 net exporters in 2005, EIA data, total petroleum liquids + other liquids
It looks like the annual price of Brent through November was about $102 for 2014. With the current decline, for all of 2014 the annual price will probably be slightly less than $100, versus $111 in 2011, $112 in 2012 and $109 in 2013:
http://www.eia.gov/dnav/pet/hist/LeafHandler.ashx?n=pet&s=rbrte&f=a
By my calculations, VMT will be rising at a 4%+ rate by this time next year at current oil prices.
I wouldn’t expect to see that. People still don’t have jobs, still have too much debt, and are stuck paying high rents due to housing shortage. Land lords, banks, and healthcare providers will end up with most of the extra-money.
People have had insufficient savings for too long, this just reduces the burden.
Amusing Tweet:
modest proposal @modestproposal1 17h17 hours ago
Office of Financial Research created by Dodd-Frank says financial system at risk from shocks due to reduced liquidity. Because of Dodd-Frank
i am a 30 plus year driller and producer of oil and gas having drilled my first horizontal well, myself living in the rigs in 1990. we participate in horizontal wells all over the us and have since the barnett shale play kicked this off. we also drilled some 100 wells in that play selling out at the peak.
every horizontal well in the country typically declines 50-80% the first year. these wells now cost from $8-12 million to drill in oklahoma , baken and eagleford. the new mexico play averages $6-8 million per well. companies are already slashing their drilling budgets 50% or more. this glut on the supply side will be gone in a year and you will see $90 to $100 oil. this is a fantastic opportunity to buy both oil properties and solid oil stocks.
anybody that believes the glut is here to stay is mistaken. i invest millions of my personal money monthly in these wells, and like the rest of the industry am pulling in my horns. there are some plays with high condensate gas ratios that still make sense. such as the woodford shale. most don’t.
buy oil stocks now.
Hey Bill,
Being a driller what do you think about the drillers like SDRL and RIG. Heavily leveraged but SDRL has many modern deep water rigs
The run up to $140 was the continuation of a speculative bubble underway before the start of the recession. The recession was not severe at the beginning; it really hit the economy by Q4 of 2008 when monthly job losses were 600 – 800 thousand. By the trough of the recession, oil was about $60 – $70.
Thank you. I have been waiting for someone In the industry to step up and tell it like it is. I recently dropped 25k (which is a lot to me) in a small oil and gas company. I am praying that you are right.
http://www.macrotrends.net/1369/crude-oil-price-history-chart
shows definitely that oil at 140 was during a great recession. That is to say, we just need another recession and lower demand, to get higher oil prices- great logic James. And you say that US tight oil of 3 mb/d vs. 75 mb/d oil worldwide makes a difference ? I am afraid the futures trader in London will not believe that supply-demand nonsense too.
Any surprise the 80’s recession ended when Oil prices collapsed back 1986 and then started to struggle when Oil jumped in the mid-00’s? Such a oil based economy………….
except that the 1980s recession ended in November 1982, four years before you claim of 1986.
I am thinking that Saudi’s aren’t smart because this is just going to make stronger us players pick off weaker ones and eventually the stronger ones will become more stronger as a result of this drop in oil prices. Those that are requiring high issuance debt to fuel their growth will certainly suffer in the near term. IMO. $50-60 dollar WTI won’t last long. Some more leveraged players will go bk. others who are smart will merge entirely to create more Exxon size companies. Maybe not that big, but more majors will come out from it.
Saudi logic is here: http://www.prienga.com/blog/2014/11/11/understanding-saudi-oil-policy-the-lessons-of-79
It astonishes me how ignorant Americans are about the Middle East.
The Saudis enemy is Iran. Iran is in negotiations over the future of its nuclear program. Lower oil prices squeeze the Iranians and make them more likely to agree to nuclear restrictions.
This is not difficult to figure out.
I realize ISIL oil may be a drop in the bucket, but on the margins it may be having and effect: ” At such a cheap price, a reported $10-22 per barrel, it…” Another estimate has them getting ~$1M/day by selling oil , or ~50,000 to ~100,000 barrels/day. http://www.todayszaman.com/columnist/amanda-paul/isil-and-oil-stopping-the-flow_365083.html
Another estimate has it at twice that above: ” WO News Center
World Oil News Center
ISIL oil production worth an estimated $800 million per year, IHS says
WASHINGTON, D.C. – Current oil production by the Islamic State in the Levant (ISIL) is estimated to be worth $800 million per year, equivalent to more than $2 million per day, according to new estimates by IHS….” http://www.worldoil.com/ISIL-oil-production-worth-an-estimated-800-million-per-year-IHS-says.html
ISIL oil sales may be partially off setting the higher prices caused by instability in several of the producing nations. Dunno, just a thought.
Good analysis
Oil storage is very costly, which is why producers continue to sell despite low spot rates. If you think oil prices will go back up soon, sell futures.
The bigger question is about reigning in production. Oil production is not that elastic (there are costs imposed by stopping and starting production) as well as the game theory strategy of who has bigger pockets and can outlast their opponents — Saudi/OPEC or US/Canada.
Today’s low prices mean that new projects to extract expensive oil sands and tight oil reserves will not be approved — at today’s oil prices, they have negative NPV. So expect a contraction in supply in the next few years, with oil shortages (and soaring prices) in 5 years. Just in time for the next business cycle recession!
I wonder if a 6 month shut in period may not help a Bakken well’s fracture system repressure sufficiently to justify the move? When we couple this with the probability that oil prices may indeed go back up this may be worth trying in some hand picked wells. I’m a petroleum engineer, but I don’t work in the USA, so I don’t have a good handle on detailed Bakken well performance.
Business Insider should have noted that the break even prices shown by the Wood Mackenzie data are “half-cycle” breakeven prices, ie., not including other costs such as interest, corporate overhead and the like, nor any after the fact environmental remediation; a Barclays analysis of the same notes that producers would need a 25% to 30% return at those “breakeven prices” to earn 10% on a given project if full cycle accounting were applied…
JDH Given the long investment lead times and prices that frequently overshoot and undershoot their equilibrium value, is it fair to characterize today’s oil market in terms of that old textbook favorite, the “cobweb” model?
Off the topic, but you posted this analysis on 11/30 – a day after your birthday (peeked at your C.V.;) and your 60th anniversary!?!…No hangover and no celebration?;-)…
A few comments:
– Note on the WoodMac chart that the breakevens are almost all under $60 / barrel. But I never know what this means. Does it mean there is an infinite supply at that price? Or is that the current full cycle cost for the marginal barrel? Or is it marginal cost? Or contribution margin? I never know with these things. Productivity continues to rise in the shale sector; costs may continue to fall increasing the size of the resource substantially.
– On the graph entitled “US oil production by source”: Note the leveling of US lower 48 onshore conventional production (the red area). That red area should continue to decline according to the long term trend, and it’s not. This suggests that conventional onshore production is being sustained essentially by price effects. On trend, US conventional production should be 1 mbpd lower than it is. If apply this standard across non-OPEC conventional production, we have about 8 mbpd of conventional production being sustained by price effects globally. Thus, the price effect on conventional production is substantially greater than the technology effect on unconventional production. Let’s if how that rolls off with lower oil prices. My more detailed analysis is here. http://www.prienga.com/blog/2014/10/26/what-do-low-oil-prices-mean-for-conventional-production
– International access will improve dramatically in the next few months. My heart bleeds when I see Shell selling its Nigerian assets. I wouldn’t do that.
– OPEC will start cheating in the next few months. to the extent they are able. (I’ll publish an article on this.)
– At present, supply is estimated to be running ahead of demand by anything from 0.8-2.0 mbpd. If that’s the case, then the surfeit will have to be squeezed out, and that can lead to spot prices below marginal cost until supply is appropriately suppressed. I have more on this in my article from last Thursday, published in the UAE, text here: http://www.prienga.com/blog/2014/11/26/opec-decision-on-production-cuts-in-the-balance
Finally, I’m posting pretty frequently now, generally on topics of interest to readership here: http://www.prienga.com/blog/
@ Steven Koptis
A few months ago I came across the video of your presentation in the Colombia SIPA forum. I found the implications of the demand constrained vs supply constrained forecasting to be very thought provoking. I thought you brought the nuances very well. Thank you.
I just wanted to humbly offer my admiration for what it is worth and wish you the best in what I presume is a new venture.
Vijay
Thanks. Let me assure you, doing a presentation is easier than writing a book.
Opec is fully prepared with a 2.5 trillion dollar war chest to hold North American oil industry’s head underwater for a very long time. They aren’t out to make tight oil and tar sand projects go to sleep, they want them to atrophy and die. Its a last one out turn off the lights kimd of situation for anybody in the oil business in this part of the world. Run.
This analysis is incorrect.
Steve – Which analysis is incorrect?
Took weed ?
Not long ago I kept reading here that the Saudis were running our of oil, they had peaked. Yet, now I am hearing that the Saudis can sell oil in sufficient quantities at 1/3 of the price to put the US oil producers out of business. This does seem a little fickle.
Regarding Saudi Arabia, I suspect that they have been waiting for a downturn in global demand that would allow them to maintain their production and net exports (especially during their low domestic demand winter season), as a way to drive down oil prices, which would hurt the high cost tight/shale producers.
But an important point to remember is that the Saudis have so far been unable, or unwilling (take your pick), to exceed their 2005 annual net export rate of 9.1 mbpd (total petroleum liquids + other liquids, EIA). This post-2005 decline in net exports is in marked contrast to the large increase that they showed from 2002 to 2005, as their net exports increased from 7.1 mbpd in 2002 to 9.1 mbpd in 2005, as annual Brent crude oil prices rose from $25 in 2002 to $55 in 2005. Based on EIA data, their 2013 net exports were 8.7 mbpd (total petroleum liquids + other liquids).
As annual Brent crude oil prices rose from $55 in 2005 to the $110 range for 2011 to 2013 inclusive, Saudi net oil exports have been below their 2005 annual rate for eight straight years.
A second, and almost totally ignored, point is that CNE (Cumulative Net Exports) depletion marches on. By definition, it’s not whether Saudi Arabia has depleted their remaining volume of post-2005 CNE. It’s a question of by what percentage. The following chart shows normalized values for Saudi production, net exports, ECI Ratio (ratio of production to consumption) and remaining estimated post-2005 CNE by year (with 2005 values = 100%). The estimate for post-2005 CNE is based on the rate of decline in the Saudi ECI Ratio (at an ECI Ratio of 1.0, net exports = zero). I estimate that in only seven years, through 2012, Saudi Arabia shipped roughly one-third of their post-2005 CNE.
http://i1095.photobucket.com/albums/i475/westexas/Slide21_zps74c9ebac.jpg
Incidentally, we know what happened from 1995 to 1999 for the Six Country Case History*, as their production rose slightly and as their ECI Ratio fell, they shipped more than half of post-1995 CNE from just 1996 to 1999 inclusive:
http://i1095.photobucket.com/albums/i475/westexas/Slide2_zps55d9efa7.jpg
One other interesting point is that the Six Country Case History showed an accelerating, year by year, rate of depletion in their post-1995 CNE, and I estimate that Saudi Arabia (and the 2005 Top 33 net exporters in general) are showing similar accelerating rates of depletion in post-2005 CNE.
The Six Country Case History, from 1995 to 1999, illustrates the profound difference between production and CNE depletion. As their production increased slightly from 1995 to 1999, and as their net exports and as their ECI Ratio both declined, they showed an accelerating rate of decline in their remaining post-1995 CNE.
Saudi Arabia, and the (2005) Top 33 net oil exporters overall, have shown an increase in production relative to 2005, with post-2005 declining net exports and declining ECI Ratios. As noted above, these mathematical characteristics correlated to an accelerating rate of decline in their remaining post-1995 CNE for the Six Country Case History.
*The major net oil exporters, excluding China, that hit or approached zero net oil exports from 1980 to 2010
Most people here know a lot more about oil than me.
So, I have a question.
When folks are estimating how long and how far oil prices can be away from some “long term equilibrium” after some well closures or … whatever,
how is the explanation for “how and why” of the WTI – Brent price divergence, starting end of 2010, reaching 26$ (per barrel) in August 2011, and coming back below 4$ only recently. It should have been easy to redirect the mid east oil tankers from the US to Europe.
I believe a good answer to that also helps estimating what will happen from now on.
genauer
” It should have been easy to redirect the mid east oil tankers from the US to Europe.”
i don’t think we acquire as much middle east oil as you think. the us produces alot of the oil it consumes, and much of the remaining imports come from canada, mexico and latin america. what does come from the middle east is probably a smaller amount than those sources, and it probably comes from saudi arabia and kuwait, two countries not interested in rocking the boat with the us government i would imagine. so you probably cannot realistically redirect as much oil as you think.
Jaffrey,
That sounds like what I know. Essentially, the Saudis are no threat to US oil production and have little impact on world oil prices. The decline in oil prices are independent of Saudi production.
I usually like Jim’s writing on oil, but this one is mostly silly and glaringly lacking market savvy. Businesses that have invested in projects that produce oil for $85 a barrel can’t just close up shop and wait for prices to rebound. They would be liquidated meantime.
Also the closing claim that “most new investments” in North American unconventional oil would be “unsustainable” is unclearly worded and unsubstantiated. Markets are trying to guess how much supply vs demand there will be and the answer people came up with was $66 spot and some futures curve.
Certainly there is an argument that markets are overshooting. Markets could be underestimating the coming drop in investment, and/or the coming rise in demand. But if that were obvious the price and curve wouldn’t be what they are. The data points cited here are too thin to be persuasive.
On another note, unrelated to Jim’s argument, many of the commenters here are painting the Saudis as aggressor. Huh? The biggest member of an oligopoly-cartel is behaving aggressively when it … declines to cut production? The simple explanation here is that the Saudis don’t like to cut to compensate for others’ production increases. The last time they did, in the 1980s, it backfired bigtime. Their recent behavior was not only passive, it was predictable.
This analysis is mostly correct. And do not forget the US military bases in Saudi Arabia.
The over production of shale oil may be another result of a long stretch of too low interest rates. Easy money results in over supply. And lower prices. The “supply siders” dilemma. Could low interest rates actually cause deflation over the long run?
My brother has been suggesting this for a while. Here’s a recent post: http://jeffcnyc.tumblr.com/post/99326925067/crisis-2-0
Jeff added on Facebook
Someone noted on Twitter: “Energy bonds make up 15.7% of the $1.3tn junk bond market, according to Barclays data – compared with 4.3% a decade ago.”
https://twitter.com/PlanMaestro/status/538160579014574080
And there’s a recent bloomberg article, Singapore Wealthy Stung as Crude Rout Sinks Bonds: Asean Credit.
http://www.bloomberg.com/news/2014-11-27/singapore-wealthy-stung-as-crude-rout-sinks-bonds-asean-credit.html
Terrific post JDH.
A welcome break from the juvenile, narcissistic analysis on oil markets coming out of several American corners. Donald Coxe to name but one. [Message to some of the American friends: the rest of the world does not exist to serve you. Sincerely.]
As for oil-levered junk bond markets, they are a terrific opportunity right now for the discriminating, well-informed investor.
As for the billion dollars in capital that are about to be written in North America….. thank our lucky stars that private individuals are bearing the risk, not taxpayers through state-owned oil companies.
US producers are not oil countries. Because of the fundamentals of SO/SG, they can’t afford to wait. What is at stake is not balanced/unbalanced budgets but life/death of companies.
If companies cut production, they will at once be short of the cash they desperately need to keep alive the whole thing. Don’t forget they all have been negative free cash flow for years (he exception is EOG, which has been positive since this year only). If they cut, “blind investors” (as most have been since 2009) won’t back them anymore and the companies won’t be able to reduce debts, not even to pay debt service. They will fail.
If there are massive bankruptcies, the survivors will ajust production to stick to the breakeven, which is much higher than we are said (the main reason why they have been negative free cash flow for years !). So, theses survivors won’t produce a lot as they need to keep WTI/Brent high.
That means you are right to predict barrel will go up. But the golden age of impressive ouput in the US will be over.
I guess one question is whether the Saudis will keep the spigot open long enough to drive the high-cost leveraged US fracking / tar sands companies into bankruptcy.
One thing is sure: they intend to do so. The Saudi Oil Minister *said so*.
Steven Kopits: Just read your latest post, “Will we see $100 oil again”, on your Princeton Advisors site and you seem undecided about the future price of oil. In your Columbia University presentation you posted a slide suggested an addition 60 m bpd of demand coming in 20 years from a modernizing China and rest of world, yet your most recent post leaves that question in doubt. Have you changed your core opinion on future oil demand and related price responses? Your penultimate sentence, “either choice is possible” does cast some obvious doubt on the assumptions within your Columbia presentation.
Note that the annual price of Brent fell from $97 in 2008 to $62 in 2009. The monthly price of Brent fell from $134 in July, 2008 to $43 in February, 2009.
And then from 2011 to 2013, Brent averaged about $110.
Long-term, the oil demand will be there, assuming China develops as expected.
So, if I interpret things correctly now is the time to start a gas tax at something like 10 to 30 dollars per barrel to expire when prices spiral again and invest the proceeds in long term capital expenditures that reduce our future need for oil like transit rail and cars.
An interesting article in the WSJ (12/5/14) http://online.wsj.com/articles/peak-oil-debunked-again-1417739810
Following are three comments I posted in regard to the WSJ OpEd, among the flood of comments by residents of Fantasy Island. Note that in my opinion, they are taking a counterfactual position, in that the data strongly suggest that actual global crude oil production (45 and lower API gravity crude oil) virtually stopped increasing in 2005, while global natural gas production, and associated liquids (condensate & NGL), have so far continued to increase.
Two relevant charts:
http://i1095.photobucket.com/albums/i475/westexas/Slide1_zps45f11d98.jpg
http://i1095.photobucket.com/albums/i475/westexas/Slide2_zpse294f080.jpg
WSJ Comments:
#1:
From (Debunked) article: “The world relearns that supply responds to necessity and price”
If the Peak Oil “Theory” is that the finite sum of discrete sources of oil that peak and decline will also peak and decline, and if this has been “debunked,” what’s the alternative theory? Is it that the finite sum of discrete sources of oil that peak and decline will show a virtually continuous rate of increase in production?
In any case, North Sea Crude + Condensate (C+C) production peaked at 6 mbpd in 1999, when the annual Brent crude oil price was $18. North Sea C+C production was down to 2.5 mbpd in 2013 (when Brent averaged $109), a 6%/year rate of decline in production versus a 13%/year rate of increase in Brent crude prices.
If discrete regions peak and decline, despite higher oil prices, doesn’t that mean that it’s when, not if, that the sum of the output from discrete regions shows the same pattern? As noted below, it’s likely that actual global crude oil production effectively peaked in 2005.
#2:
When we ask for the price of oil, we get the price of 45 or lower API gravity crude oil, but when we ask for volumes, we get some combination of crude oil + condensate + NGL (natural gas liquids) + biofuels. What the EIA calls “Crude oil” is actually crude oil + condensate (C+C), and condensate, like NGL, is a byproduct of natural gas production.
As annual Brent oil prices rose from $25 in 2002 to $55 in 2005, global C+C production rose from 67 mbpd (million barrels per day) in 2002 to 74 mbpd in 2005. As Brent rose from $55 in 2005 to the $110 range for 2011 to 2013 inclusive, global C+C production only rose by only 3%, up to 76 mbpd in 2013. Note that global dry gas production rose by 22% from 2005 to 2012.
If we subtract out plausible estimates for global condensate production (from global C+C numbers), it’s very likely that actual global crude oil production effectively peaked in 2005, while global natural gas production and associated liquids, condensate and NGL, have (so far) continued to increase.
#3:
In late 2004, Yergin asserted that oil prices would be back down to a long term oil price ceiling of $38 per barrel by late 2005. This caused me to suggests that we price oil in “Yergins,” with One Yergin = $38 per barrel.
As noted elsewhere, it’s very likely that actual global crude oil production (45 and lower API gravity crude oil) has not materially exceeded the 2005 annual production rate for eight straight years, while global natural gas production and associated liquids, condensate and natural gas liquids, have (so far) continued to increase.
And note that Global Net Exports of oil (GNE*) have been below the 2005 annual rate for eight straight years, while developing countries, led by China, have so far consumed an increasing share of a post-2005 declining volume of GNE. The supply of GNE available to importers other than China & India fell from 41 mbpd in 2005 to 34 mbpd in 2013.
*Top 33 net exporters in 2005, total petroleum liquids + other liquids, EIA
Here are some interesting numbers to contemplate, along the lines of what can’t continue, won’t continue (but so far, through 2013, it has continued). Note that Drudge had a recent headline to the effect that China has now surpassed the US as the world’s largest economy.
Based on latest EIA data, the Ratio of GNE to CNI* fell from 9.5 in 2005 to 5.0 in 2013 (at a GNE/CNI Ratio of 1.0, Chindia would theoretically consume 100% of GNE).
Available Net Exports (ANE) = GNE less CNI, and ANE fell from 41 mbpd in 2005 to 34 mbpd in 2013.
Estimated Available post-2005 CNE (estimated cumulative volume of GNE available to importers other than China & India) were 195 Gb (billion barrels) at the end of 2005, with 108 Gb have been consumed from 2006 to 2013 inclusive, leaving remaining estimated remaining Available CNE at about 87b Gb at the end of 2013.
The estimated Available CNE/ANE Ratio would be 6.4 years at the end of 2013 (87 Gb/13.5 Gb per year).
*GNE = Combined net exports from Top 33 net exporters in 2005 (EIA data, total petroleum liquids + other liquids)
CNI = Chindia’s Net Imports
Bill
Is LINE a good buy?
Steve