Many people are finally coming to a realization that should have been evident long ago: Greece’s debts are not going to be repaid. And as discussion turns to who might be next, it seems a good time to revisit the question of whether the United States could some day find itself in similar trouble. I am substantially more optimistic about this than I was a couple of years ago, and here is why.
Let me begin by clarifying that the difference is not, as many other observers have often asserted, the fact that the U.S. debt is denominated in our own currency and therefore could always be repaid just by printing a sufficient quantity of dollars. Reinhart and Rogoff (2009, pages 111-116) documented more than 70 separate historical instances of overt default on domestic public debt. Jesse Schreger, a promising Ph.D. candidate from Harvard, has nicely laid out the theory for why that is. Overt defaults on government debt are costly, but so can inflation be if the government takes the alternative route of trying to monetize the debt. Which course a government takes– outright default or big inflation– will depend on the relative costs of those two options. Schreger does a nice job of demonstrating that a rational assessment of these alternative risks gets priced into the market valuations of sovereign debt around the world.
Instead the core issue comes down to one of sustainability, which is a function of the debt-to-GDP ratio, the interest rate on government debt, the GDP growth rate, and the value of the primary surplus (government revenues less expenses on items other than interest rates) that the public is willing to maintain indefinitely in order to continue to make interest payments to creditors. The math behind this is straightforward and uncontroversial. The only question is what are the values for the relevant magnitudes. An unsustainable path will necessarily eventually lead to some combination of high inflation, overt default, or financial repression.
Two years ago it was unclear to me what would change to put the United States on a long-run path of fiscal sustainability. The graph below plots the interest rate on 10-year U.S. government bonds that the Congressional Budget Office projected in their February 2013 Budget and Economic Outlook. Although the 10-year rate was under 2% of the time, CBO was expecting it to return to more normal historical levels relatively quickly. When those anticipated higher rates began to apply to a U.S. net debt burden that had doubled as a percent of GDP since 2007, the result was a tripling in the government’s anticipated interest expense. This, in combination with the huge fiscal challenges associated with an aging population, created some reasons for concern.
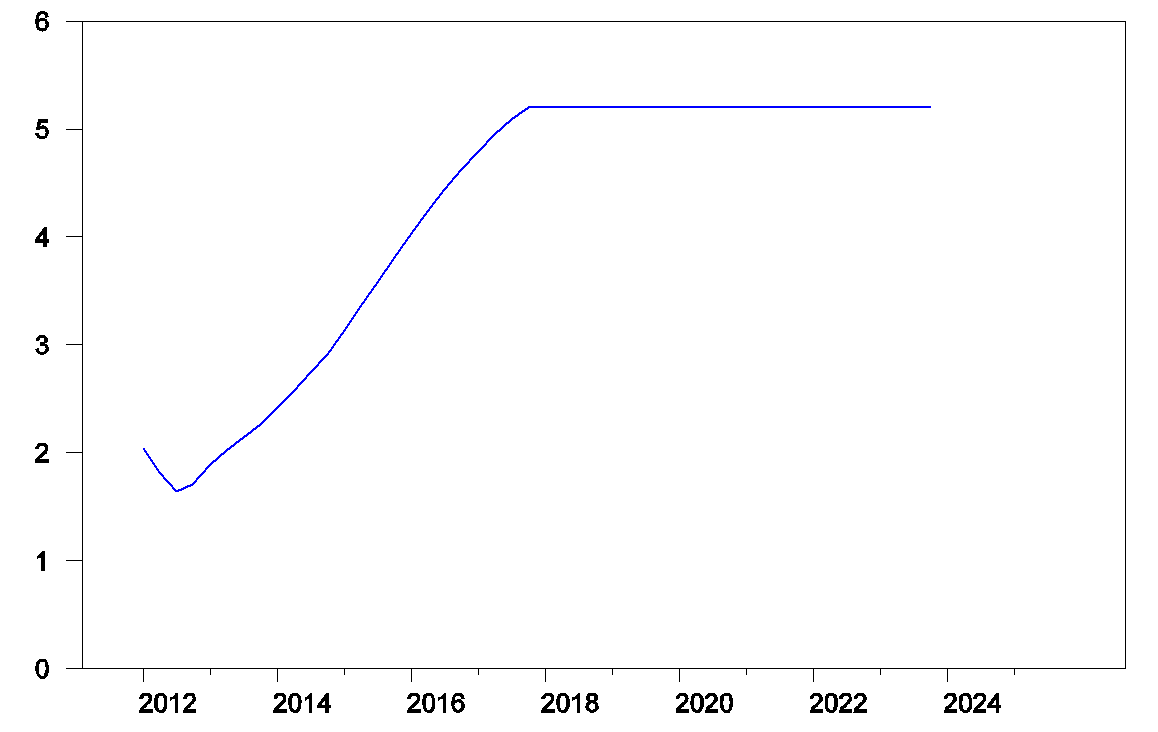
Historical and projected future interest rate on 10-year U.S. government debt as predicted by the CBO in Feb 2013.
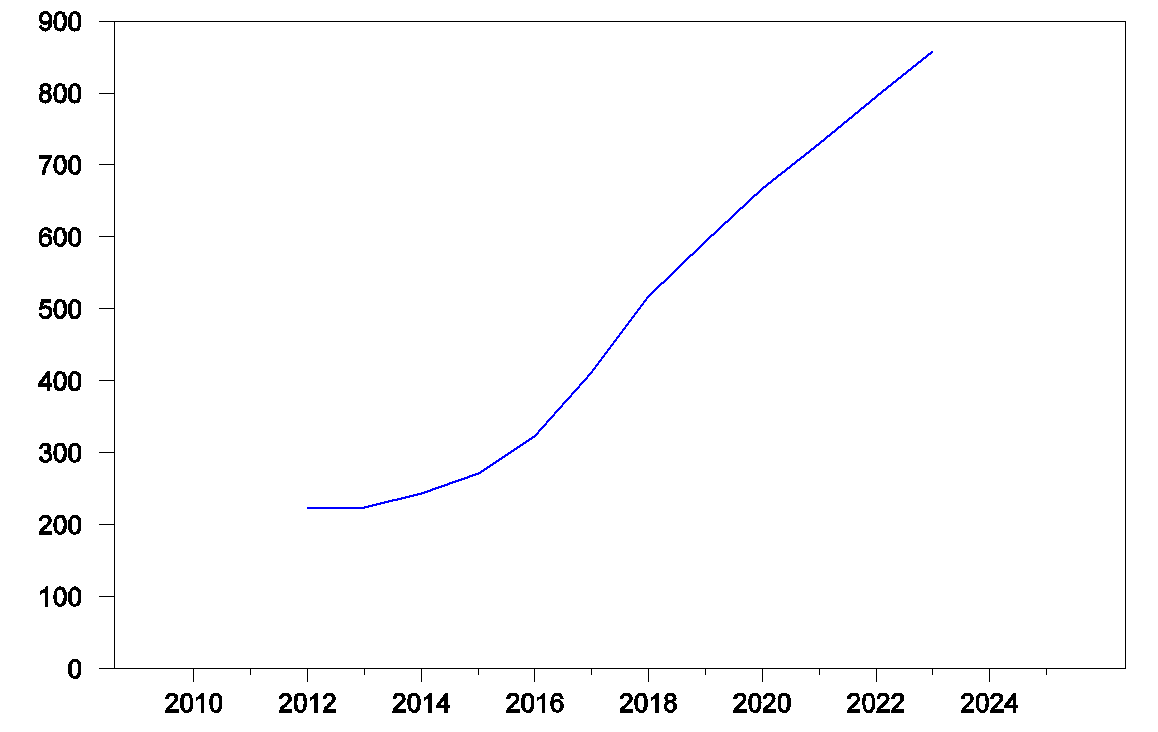
Historical and projected future U.S. federal government net interest expense in billions of dollars as predicted by the CBO in Feb 2013.
Ten-year yields ended up rising in the spring of 2013 much faster than the CBO had anticipated, but just as quickly they came back down, and today are lower than they were two years ago. This development is factored into the latest CBO projections released two weeks ago, which now call for a slower rise in yields than anticipated in 2013 and ending at a lower plateau. That will end up saving the U.S. Treasury over a hundred billion dollars annually by 2018.
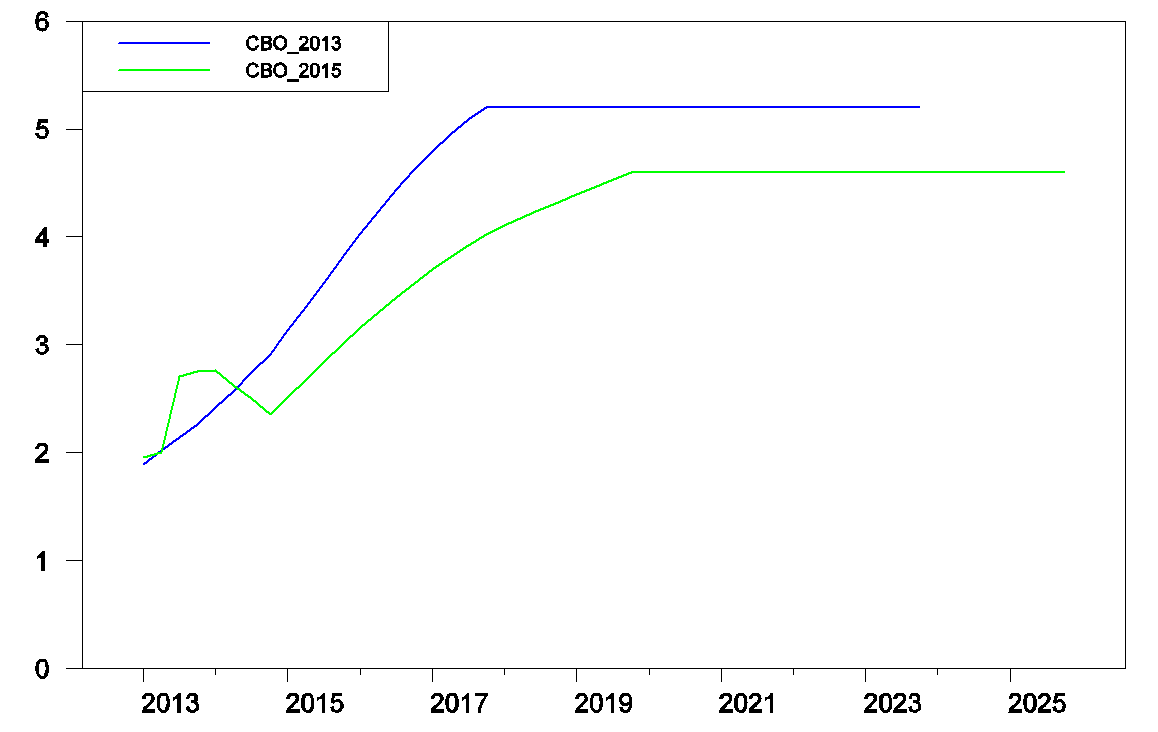
Historical and projected future interest rate on 10-year U.S. government debt as predicted by the CBO in Feb 2013 and Jan 2015.
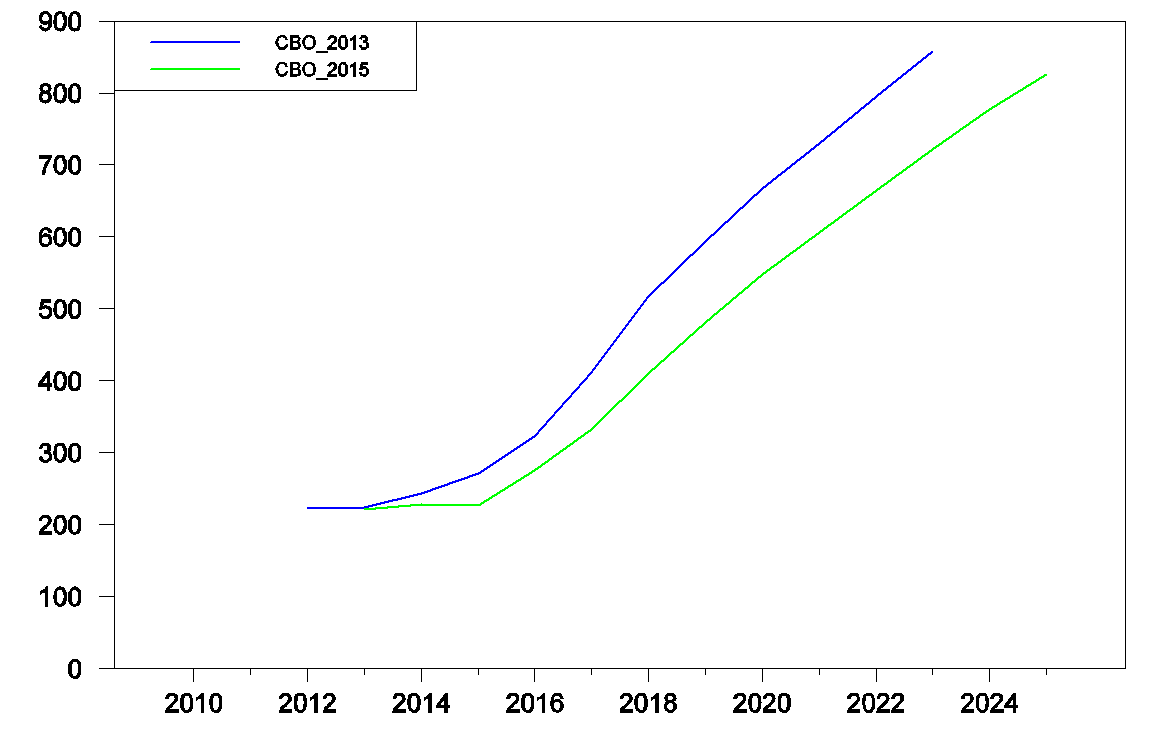
Historical and projected future U.S. federal government net interest expense in billions of dollars as predicted by the CBO in Feb 2013 and Jan 2015.
But things right now look even more favorable than that. The CBO report was released on Jan 29 and was assuming a value for the 10-year yield of 2.5% for 2015:Q1. But last week it fell all the way down to 1.83%.
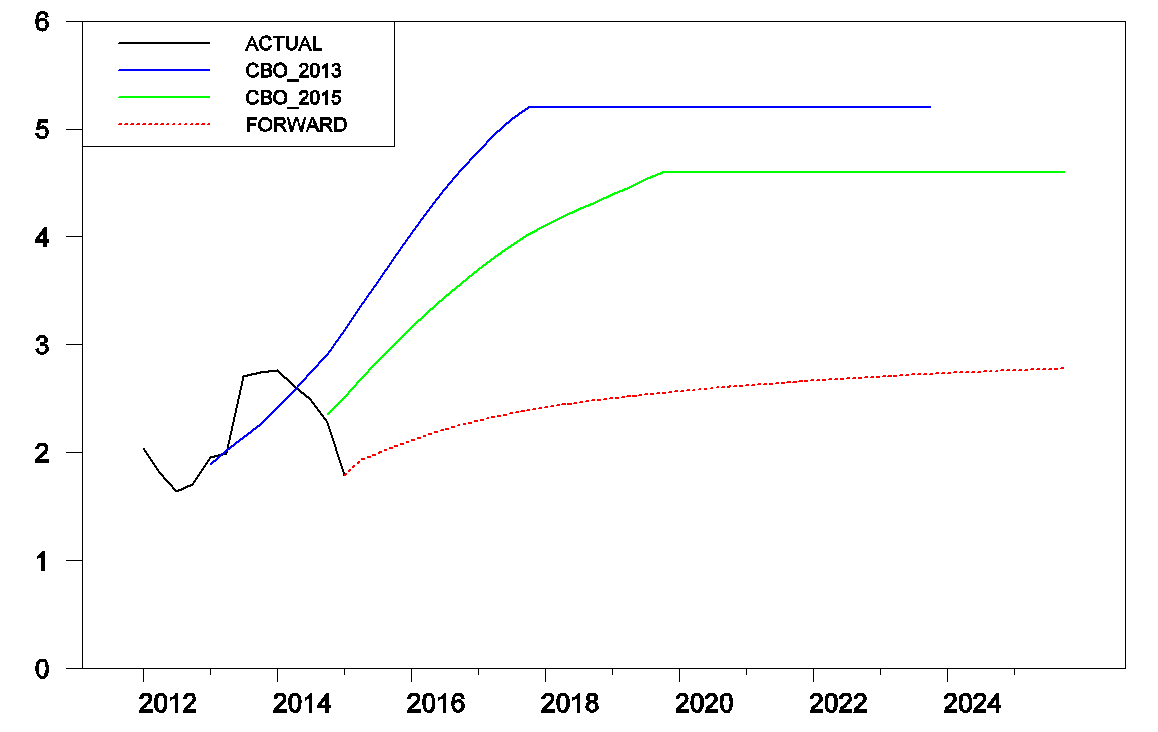
Black: actual 10-year yield. Blue: CBO Feb 2013 projections. Green: CBO Jan 2015 projections. Dotted red: 10-year forward rates calculated from the Feb 4, 2015 yield curve.
And an expectation that we’re headed significantly up from here doesn’t appear to be priced into longer term bonds. If you simultaneously sold a 1-year bond and bought an 11-year bond you could lock in a rate that you could earn on the combined holding that in effect amounts to a 10-year bond that you don’t pay for until a year from now, known as a forward interest rate. If ynt denotes the yield on an n-year bond purchased at time t, you can use formula (2.4) in Svensson (1994) to calculate the forward rate on a 10-year bond that you will purchase at date t + h from
The red dotted lines in the figure above plot those 10-year forward rates implied by the current yield curve using the estimates developed by Gurkaynak, Sack, and Wright. These show a much more modest rise in rates than is built into the CBO projections. Note that these forward rates do not make any adjustments for risk premia. But this usually works in the direction that a rational forecast of the future 10-year rate would be lower than the 10-year forward rates plotted above; see for example Kim and Orphanides (2007). Perhaps there is an unusual negative term premium at the moment arising from current and planned large-scale asset purchases by central banks around the world or from the flight to dollars as a safe haven from some of the turmoil outside the U.S.
Or perhaps markets simply have it wrong, and current holders of 20-year bonds will suffer the kind of capital loss that the CBO’s Jan 2015 projections imply. Personally I think that’s fairly likely. But in any case, there is no missing the fact that the accumulation of U.S. debt since 2007 has not put any of the pressure on the federal budget so far that some of us had been anticipating. Moreover, with control of the White House and Congress now separated between the two parties, it is less likely that we’ll see significant changes in either spending or taxes that increase the deficit over the near term. My expectation of solid U.S. growth for 2015 will be another factor increasing near-term revenues and decreasing some spending items.
Hence my conclusion: Greece has a big problem right now with its current debt load. The U.S. does not.
I would be interested to learn about Mr. Scheger’s reasoning and historical case studies. I have become very skeptical about concerns over deficits. After World War II, the US had a high debt to GDP ratio. Japan has a high ratio now. To me fears over deficits just seem like a rhetorical club used to cut social spending in wealthy, advanced nations. We’ve been warned about them ever since Ross Perot made an issue of it 20 or so years ago and yet the crises have been in other areas.
Clinton exchanged government spending and investment for deficit cutting at the behest of Greenspan and Rubin and look at the results: stagnating wages and financial instability as a tech stock bubble morphed into an epic housing bubble. After the latter popped we’re going on a decade of output gaps which only worsens the long and short term budget pictures.
Peter: It is a long row you have to hoe to come to a proper understanding about deficits. You, by the way, are far from alone in this regard. Deficits add to debt. Debt to GDP is the overwhelmingly crucial variable in today’s global economy. Reinhart Rogoff did seminal work. They found that debt beyond a certain point stifles economic growth. You had to go entirely off the range of mainstream economics to find any mention of this prior to RR.
In 1950, US debt to GDP was 142%. The government was coming down from record war debt just as households were climbing up from record low debt due to forced war savings. The overall debt burden was not much different 30 years later in 1980. Good years, those!
It is tautological that there is some optimal level of debt. Something over 0% will put new entrepreneurial firms in business. Something in the neighborhood of 200 to 300% or more will lead to default for sovereigns and bankruptcy for households and corporations. My carefully thought out optimal level of overall debt is something on the order of 180% of GDP. All of US economics before 1985 was pre-optimal; all since is post-optimal. Empirical work that blends these two periods cannot help but come up with erroneous conclusions as the regression coefficients are nothing other than a homogenization of the entire sequence of time series observations. Unless debt is explicitly taken into account. Studies that estimate the fiscal multiplier, for example, are worth very little and mostly misleading if a debt variable was not included. In my informal survey, less than 10% of such studies meet that criterion.
Debt beyond optimal suppresses growth, including the inflation component. Look at US inflation pre-1985 vs. post-1985 and this will be clearer. Turning next to Japan. Japan came into 1990 with debt around optimal – government debt to GDP was 69%. Japan did not, however, clean its stables of zombie banks, that in Japan are closely interlocked with industrial corporations. These sucked up economic energy like a tapeworm. Five years later deficit-spending-engendered debt had moved into the danger region. Look at it now, sovereign debt 240% of GDP. Not just a lost decade, but two (or more)! Reinhart Rogoff could have predicted it. Just as RR did predict the subpar recovery that’s plagued the US and surprised the consensus nearly every year of this recovery. Real growth this year may reach 3% due to the oil boost to discretionary income, though I’ll take the under on that. Moreover, such growth will not and cannot be sustained.
Deficit spending soothes the immediate short-run but has devastating consequences in the longer-run. In the beyond-optimal debt region the globe now finds itself in, the devastation is compounded by a number of things. Most prominent is the greater frequency of financial crises. Such crises are preceded by booms, all of which are credit driven. In general, debt is already elevated by the time the bubble bursts. The ratio rises more as the numerator goes up due to Keynesian deficit spending while the denominator falls due to the bust that was preordained by the boom. This happens time and again across all countries. The malinvestment that built up as the boom rose to its crescendo tends to not get cleared away during the bust because inappropriate Keynesian policy precludes healthy cleansing. But relatively speaking this is only a small matter. The greater matter is the setup for the next financial crisis. There is no asset class on the planet that is not now in a bubble. Six short years after the most recent crisis, and already an historic number and size of bubbles! Time is accordioned now. Crises will strike more often and be deeper. Keynesian policy is helpless as all it does is create money out of thin air to buy the bonds the Treasury must offer the market to gather the funds for its mostly wasteful fiscal spending. The spending is wasteful as it does not go toward investment projects that have future payoff. Future payoff is vital as it is the only source from which the debt can be repaid. And the pernicious thing is, Keynesian deficit spending raises the all-important debt ratio that much more, bleakening the future just that much more.
What Clinton did or didn’t do is of less relevance than the Greenspan put during those years. Suppressing rates until March 1994 set in motion a train of events that pushed household and corporate debt higher on the back of a short technological spurt in the physical economy and Y2K spending that stole from the future. Spreading the analysis across 1994 to the housing bubble peak in 2006, Clinton bears great responsibility due to his badly conceptualized Homeowners Act of 1994 which lit the fuse on subprime.
I believe JBH meant 80% in his third paragraph, not 180%.
I think, the U.S. needs strong real growth over the next 15 years with small budget deficits and surpluses to reduce federal debt to GDP before the last of the Baby-Boomers reach 65 in 2029, which will likely cause another long-wave bust.
Otherwise, a relatively small workforce will have to pay more in taxes to support a relatively large retired population, along with providing the goods & services, and fiscal policy will be more constrained to deal with the long-wave bust cycle.
Monetary and fiscal policies will prevent the long-wave bust from becoming a deep depression similar to the Great Depression of the 1930s or the Long Depression of the 1870s. Instead, we may have stagflation, similar to the 1970s.
Average annual per capita real GDP growth:
2008-13: 0.39% (recession/depression)
1982-07: 2.30% (long boom)
1973-82: 0.98% (long-wave bust)
1946-72: 2.21% (long boom)
1929-38: -0.49% (depression)
It should be noted, in the 1946-72 boom, Europe and Japan were rebuilding. In the 1982-07 boom, current account deficits also boomed, which subtracted from GDP.
“The United States can pay any debt it has because we can always print money to do that. So there is zero probability of default” said Greenspan on NBC’s Meet the Press, August 2011.
So Hamilton has been dead wrong about the debt for 6 years running and only now realizes it? The U.S. has been deeply in debt for over 80 years ever since FDR took us off the gold standard and we have never had any problem managing our debt which has never caused us any harm at all. Fear mongering about the debt should be left to politicians in DC who obviously have much to gain from it as H.L. Mencken said:
“The whole aim of practical politics is to keep the populace alarmed (and hence clamorous to be led to safety) by menacing it with an endless series of hobgoblins, all of them imaginary.”
Using FRED or the Fed’s Z1 Flow of funds report, construct overall credit outstanding to GDP. Observe that it was relatively tame until the second half of the 80s, and did not soar until the housing boom and all that followed. In the late 80s and 90s, debt was not yet large enough to slow the economy very much. This past 6 years, however, it manifestly has been. It is so that the Fed can print unlimited “money.” But to grab hold and gain traction, the increase in the monetary base must flow all the way through to spendable money. To avoid outright default, the Fed must generate enough inflation to sufficiently shrink the value of the future dollars ultimately used to repay the debt. If default is to be a problem, that inflation will be too. Inflation is vastly corrosive to a society’s saving rate. And that’s a catastrophe for productivity. There is no free lunch. J. Hamilton has been quite correct for the most part about debt now being a problem. See my post immediately above for more on this.
“Fed must generate enough inflation to sufficiently shrink the value of the future dollars ultimately used to repay the debt.”
The federal debt has not been repaid and there is no plan to do so. Paying off the debt is just another straw man that debt phobics use to fear monger voters. The federal debt does not need to be repaid because it can be rolled over indefinitely. We are not on the gold standard!
” If default is to be a problem, that inflation will be too.”
Default is not a problem at all as Greenspan said. Again, we are not on the gold standard!
” J. Hamilton has been quite correct for the most part about debt now being a problem.”
The federal debt has NEVER caused us any problem at all ever since we went off the gold standard.
My challenge to you: Name the time our debt harmed us or admit you are wrong.
My response posted moments ago at the bottom.
Professor Hamilton,
Would you mind showing a numerical example using Svensson’s equation 2.4?
Thanks
AS: For example, for h = 1 we have from the Gurkaynak, Sack and Wright estimates that on Feb. 4 the 1-year yield y1t (maturing 2016:Q1) was 0.21 and the 11-year yield y(10+1)t (maturing 2026:Q1) was 1.96, giving a forward rate for h = 1 of [(11)(1.96) – (1)(0.21)]/10 = 2.135. This is the value plotted for 2016:Q1 in the graph above and corresponds to the rate you could lock in today for a 10-year bond maturing 2026:Q1 that you do not buy until 2016:Q1.
I see that eq. 2.4 is easier to use than I thought. The equation was not clear on my screen.
It’s not the public debt that will drag the economy into the abyss (not first, anyway) but the private household and non-financial corporate debt and its imputed debt service costs in perpetuity as a share of after-tax wages, profits, gov’t receipts, and GDP overall.
In addition to the drag from “dis-ease care” and “education” costs, the associated private “rentier taxes” from the hyper-financialization of the economy will preclude an acceleration of real GDP indefinitely hereafter.
The increase in the public debt to wages and GDP is a result of the drag effects of WAAAAAAAAYYYY too much private debt to wages, profits, and gov’t receipts, the associated record low for labor’s share of GDP, and the obscene wealth and income concentration to the top 0.001-1% from outsized gains in rentier flows.
The Fed via ZIRP and QEternity enabling the TBTE banks to lever up equity index futures to unprecedented levels via TBTE banks’ shadow banking system’s offshore dark pools and pass-through entities with the assistance of exchange-sponsored HFT is only exacerbating the effects of inequality, low labor share of GDP, and non-productive rentier speculation and resulting disproportionate rentier flows to the top 1%.
Greek debt isn’t a big problem for very many people outside of Greece. There just isn’t enough of it. It all adds up to maybe $50B. (GDP=$22b x 175% + some fudge to get a round number.) That is a teapot in the ocean of available capital. The real crisis is the failure of the European economic union on numerous scores. The original Common Market was based on perfectly reasonable and generally realized expectations, but its legal and monetary structures were repeatedly extended past their point of effectiveness. The floor is starting to go, so bankers are getting anxious.
BC does make a valid point about private debt. Bankers aren’t anxious about that because they know that no matter how deep they get or how much fraud they perpetrate to get that deep, the government can be relied on to provide a suitable credit line. Last time it was $800B. Next time it might be $1.2T. Since the debt is in US dollars, the US government can provide whatever credit is necessary to calm the markets. As before, not all of the credit will be accessed, but it will be there when needed. Obviously the government can do this for public debt as well, but the worry is that some of the money so created might wind up in the wrong hands.
Wow, I’m stupid. I followed the first link. I was off by an order of magnitude. The total debt is more like $450B. That’s a fair bit more water. I still don’t see a Greek default as world changing. We’ve dealt with bigger collapses than that, and not all that long ago either. Granted, it might be nice if we let some banks go under. Aren’t those big salaries justified by all that skin in the game.
BC: Quite right and insightful as always. Let me add a further insight. The Kalecki equation. It is an accounting identity, first pointed out by the brilliant Michal Kalecki, that the corporate profits share is directly related to the size of the federal government’s deficit. To simplify slightly, a trillion dollar deficit will shave a trillion dollars off labor’s share. Of course the profit share, in turn, enhances the income and wealth of the top .01% as you point out. I repeat, this is not theory. It is an ironclad accounting identity. The deficits before Obama and the trillion dollar deficits since did exactly this. Railing against inequality and the vastly greater share of national income going to the wealthy in recent years, while simultaneously cheering for ever-greater deficit spending to close the output gap, is sad, humorous, and a testament to how much the profession either does not know or chooses to not teach today’s students. Can you imagine if Americans understood this?
On a further note, do not for a moment imagine the global elite are ignorant of this. They were cheering Bush and Obama on every bit of the way. Quantitative easing simultaneously enables deficit spending without higher interest rates getting in the way. The monetary base injection of QE flows first into financial markets, namely stocks and bonds. Boy, do Wall Street banks and other privileged get to front run the markets. The public gets fleeced in more ways than one. Especially by suppressed wages and labor share. The ever-growing disconnect of the money economy from the real physical economy is an immoral, criminal exercise of power the public is clueless about. Let us give them bread (beer) and circuses (pro football) to keep them dumbed down. While from cycle to cycle due to VIP access to money-created-out-of-nothing we strip away more and more of the legal ownership of physical wealth that they the public produce by the sweat of their brow.
LOW OIL AND GAS PRICES FOREVERMORE? MAYBE NOT
The Supply Side
Global Crude Oil Production Probably Peaked in 2005. Based on plausible estimates for global condensate production, it’s quite likely that actual global crude oil production (45 and lower API gravity crude oil) has not materially exceeded the 2005 annual rate, even as annual Brent crude oil prices averaged $110 for 2011 to 2013 (and averaged about $100 for 2014). In other words, global crude oil production probably peaked in 2005, while global natural gas production and associated liquids–condensate and natural gas liquids–have so far continued to increase.
High Decline Rate in Existing Global Oil Production. The IEA puts the underlying gross decline rate in existing oil wells worldwide at about 9%/year. At a 9%/year gross decline rate, to just maintain existing oil production for 11 years, the global industry would have to put on line the productive equivalent of every currently producing oil well in the world, over the next 11 years.
High Decline Rate in Existing US Natural Gas Production. Citi Research puts the underlying gross decline rate in existing gas production in the US at about 24%/year. At a 24%/year gross decline rate, in order to just maintain existing US gas production for four years, the US would have to put on line the productive equivalent of about 100% of current gas production over the next four years. As an example of why this is a reasonable estimate, the observed year over year decline in Louisiana’s dry natural gas production from 2012 to 2013 was 21%/year; this was the net decline, after new wells were added. The gross decline rate from existing wells in 2012 would be even higher.
High Decline Rate in Existing US Crude + Condensate (C+C) Production. Given the high and rising percentage of US oil production coming from high decline rate tight/shale plays, a plausible estimate is that the underlying gross decline rate from existing US oil wells may be on the order of about 20%/year, which would be consistent with the Citi Research gas estimate. In any case, at a 20%/year gross decline rate, in order to just maintain existing US oil production for five years, the US would have to put on line the productive equivalent of about 100% of current C+C production over the next five years.
Global Net Exports of Oil (GNE) Probably Peaked in 2005. GNE, defined as combined net exports from the (2005) Top 33 net oil exporters, have been below the 2005 annual rate of 46 mbpd (million barrels per day, total petroleum liquids + other liquids, EIA data) for eight straight years. GNE fell to
43 mbpd in 2013.
The Demand Side
China & India (Chindia) Consuming an Increasing Share of GNE. The volume of GNE available to importers other than China & India fell from 41 mbpd in 2005 to 34 mbpd in 2013.
Surge in Chinese Oil Imports. Credit Suisse reports that Chinese oil imports were up 10% overall for 2014, with late 2014 oil imports surging to a 13% year over year increase, from December, 2013 to December, 2014.
Possibly Temporary Decline in US Net Oil Imports Contributed to Oil Price Decline. Based on the four week running average EIA data, US overall net oil imports fell from 6.2 mbpd in the week ending 6/13 to 4.7 mbpd in the week ending 11/07, a decline of 1.5 mbpd in the US demand for net imports of oil over a five month period, primarily due to a strong increase in US oil production, which put considerable downward pressure on oil prices. However, US net imports have recently rebounded, hitting 5.9 mbpd in early January, and most recently US net oil imports were at 5.6 mbpd in the week ending 1/30 (all four week running average data).
Record Global & US Car Sales in 2014. US and global light vehicles sales hit record levels in 2014, and a plausible estimate is that the net increase in global light vehicles may be running at about one million new vehicles per week (net being new vehicle sales less vehicles scrapped). In contrast, during the 2008 to 2009 oil price decline, global vehicle sales fell from 2007 to 2009, before rebounding in 2010.
Some interesting EIA annual Louisiana natural gas data, through 2013
2012 to 2013 annual rates of change:
Overall Dry Gas Production: -21.0%/year
Gross Withdrawals From Three Sources of Gas:
Gas Well Production: +6.5%year
Associated Gas Production: +4.9%/year
Shale Gas Production: -32.8%/year
Data: http://www.eia.gov/dnav/ng/ng_prod_sum_dcu_sla_a.htm
It seems to me that this is an interesting case history of a reduction in overall drilling in a shale play, the Haynesville Shale Play in this case, while they presumably focused on the “sweet spots.” Note that these rates of change are all net changes, after new wells were added. The gross underlying decline rate from existing shale wells in 2012 would of course be higher.
Incidentally, note that Louisiana shale gas production was increasing at 55%/year from 2009 to 2012.
And at the 2009 to 2012 rate of increase in Louisiana’s shale gas production, it would have met 100% of US natural gas demand by the year 2017.
At the 2009 to 2012 rate of increase, Louisiana’s shale gas production would have met 100% of global demand by the year 2020.
As long as the Congress understands tax elasticity during a long period of mild deflation. That is the remaining unknown.
And an article with a different point of view, by Chris Martenson (who has a constrained oil supply outlook for the future):
Greece Exposes the Global Economy’s Achilles Heel
http://www.resilience.org/stories/2015-02-06/greece-exposes-the-global-economy-s-achilles-heel
It is all well and good that JDH has recognized his mistake, but it sure would have been nice if he had shown a little more courage back in 2009 and 2010 when we desperately needed more voices calling for expanded stimulus spending. Instead we had a misplaced obsession with debt and austerity that has ruined the lives of millions of Americans and foregone production due to idleness which can never be recovered.
This is in addition to a lost decade of infrastructure investment that could have been financed essentially at zero interest. Instead, we will be forced to handle the backlog of infrastructure spending in an era of rising interest rates.
The debt obsession has been very costly indeed.
Paul Mathis : H.L. Mencken said:
“The whole aim of practical politics is to keep the populace alarmed (and hence clamorous to be led to safety) by menacing it with an endless series of hobgoblins, all of them imaginary.”
Amen. And do not forget : a populace in fear is easy to manipulate. Oh yeah, terrorism and weapons of mass destruction, everywhere.
To James : Greece and the US are two different pair of shoes, does a comparison make sense ? I think a greek default is inevitable, the financial contagion effecting the US will make you redraw your 10-year yield curves soon.
This writer’s astrological predictions about global economy of May 2014 were published on 2 June 2014 in article – Stressful times ahead for world economy in 2015 and 2016 – at http://www.astrologyweekly.com. It was identified by this writer that after about October 2014, global economy would pass through a mild downward trend due to, among other specified factors, oil and gas. Going by reports of fourth quarter 2014 economic growth brought out by many economies of world including US and UK, one salient feature is common – that there is mild downward trend due to oil and gas, proving this writer’s prophesy accurate. These predictions also deal with the current year 2015. Having said that, it is emphasized here that these predictions of trends are indicative and not deterministic meaning that, in view of natural scheme of happenings in human life, there is always room for reform and improvement through sufficient and appropriate strategy.
With Greece or the US, the question isn’t whether debt will be repaid. It’s whether the government can keep current and grow at least as fast as the debt over the long run.
I don’t think there was ever a serious threat to the US ability to repay its debts. It’s certainly true that countries that sell debt in their own currency do default. I remember Russia 1998. But that’s a very extreme scenario that the US is not heading towards. The US is probably the most trusted sovereign in the world. It could probably sustain debt of at least 200% of GDP if it had to. It has a clause in its constitution forbidding default. I think interest rate projections should roughly track real growth and inflation projections: if interest rates were to bounce back, then so should growth and/or inflation. That all said, I do think there’s a strong argument that as the world’s leading economy the US should set a fiscally conservative example. The austerity of 2011-2013 wasn’t really necessary and certainly wasn’t urgent, but US voters just aren’t comfortable with large deficits. Democrats I think would be better able to pursue their overall agenda if they accepted that. Since it doesn’t seem to have hurt the US much, I think it’s good that it’s done and in the past.
Despite how it looks, Greece’s prospects for keeping current were until recently good for the near term. Most of its debts are due 10 years out or longer. Most interest is either at very low rates, deferred or fully refunded. Interest payments are less than 2% of GDP and last year’s primary surplus was 1%. There is still a tough schedule of debt falling due this year, mostly repayments of early IMF and ECB support from 2010-2012. But if the Samaras government had stayed in power, it almost certainly could have got a deal to roll all that over into more very low-interest, very long-term debt. But Greece exasperation with having their economic policy dictated to them came to a boil at precisely the moment when things were about to get better, or at least stop getting worse. Unfortunately they expressed their frustration in a completely self-defeating way. It’s not just the new Greek government that’s quickly running out of cash, it’s also Greek banks.
http://www.globalizedblog.com/2015/02/europe-girds-for-greek-default.html
Prof. Hamilton,
As you say, the US government can always pay any obligation it wishes because it issues the currency and undertakes obligations in that currency.
The main risk of a US default these days is the Tea Party wing of the Republican Party, who advocate to not increase the debt limit. This, of course, has been the method of tyrants and absolute monarchs, to borrow money and then refuse to pay it back. These Republicans have already managed to “shut down” the government, and are willing to risk a US default as they try to force President Obama, the Democrats, and the majority of the American people to accept policies they would otherwise oppose.
As for printing money to pay federal debts, could assess how much money printing it would take to cause the inflation that might result. Would $1 do it? A billion? A trillion? What are the factors that determine if issuing currency to pay the government’s obligations would lead to unacceptable inflation, or acceptable inflation, or precisely zero inflation? Why didn’t the tremendous increase in excess reserves produced from Fed printed money lead to ruinous inflation? As I understand the matter, those reserves form a major part of economists’ definition of the money supply.
Strictly speaking the Fed did not “print” money to pay federal debts. The Fed created electronic blips that could be withdrawn, which made the higher money supply something less than permanent. Had the Fed literally printed hundreds of billions of $5 and $10 bills and just randomly dropped them along the nation’s sidewalks and promised to never contract the money supply, then I’m pretty sure we would have seen some inflation.
I half agree with your point about the Tea Party being a major contributor of risk for default. I say “half agree” because the other half of the problem belongs to the more rational (less irrational?) wing of the GOP; the one that represents the top 0.01%. The top 0.01% is in something of a quandary. On the one hand they stand to lose a lot if the Treasury defaults, and that’s why they’ve (so far) always won out in these periodic debt ceiling fights. But on the other hand the top 0.01% are dead set against raising taxes (or at least their taxes), which ultimately undercuts a country’s ability to pay its debts. I never bought the Rogoff & Reinhart 90% debt threshold, but that doesn’t mean I don’t think there are limits to how much a country can borrow. As a practical matter that limit is really determined by a country’s willingness to tax itself. For a country that won’t tax itself the debt threshold might as well be 9% as 90%.
Normally, with the economy starting to show solid signs of recovery, I would be changing my tune and saying it’s time to think about a little austerity. Lots of government spending during a recession, austerity during a boom. Of course, we’ve already had a fair amount of austerity, but it’s been mostly against the cyclical part of the deficit. And that’s a bit odd. The structural deficit in the out years is a bit worrying if Congress won’t raise taxes. But I’m especially worried about Europe. If Europe doesn’t get its act together pretty soon, the contagion from a Grexit could hit the US economy. So Germany, this means you. Get with the program. We need to create some debt-to-GDP breathing room in case we have to fight Son-of-the-Great-Recession.
JDH ought to be commended for stepping up and offering an honest and thoughtful reassessment of the risks for default. That’s both good and bad. It’s good because integrity is a personal virtue. It’s bad because honest people are prone to thinking that politicians are equally willing to reassess their views on issues…and that ain’t gonna happen.
The US will never need to default (and hopefully the R’s in Congress have given up the idea of doing so voluntarily). To see the actual concerns, you have to look at flows (more important than stocks), aggregate demand, inflationary pressures and the Fed response. And realize that the budget deficit/surplus and interest rates are not independent. The potential concern is that high interest payments are a flow of money to the private sector, increasing aggregate demand, adding inflationary pressure, leading the Fed to raise rates, resulting in higher interest payments, etc. Vicious cycle. But it also works in reverse. Reducing the deficit or running a surplus drains spending power from the private sector, reducing inflationary pressure, causing the Fed to lower rates, reducing interest payments further. So the debt is quite easy to get under control via fiscal policy when desired, because the Fed’s response function amplifies the fiscal action. Except at ZIRP or course, when they’re unable to offset austerity by pushing rates down, which makes it exactly the wrong time to try to reduce deficits.
Overall, the correct size of the deficit is to match the private/foreign sectors’ desire to net save in our currency. Doing so will allow the Fed to maintain a low (but positive) interest rate, good for investment and employment. Too much deficit and the Fed will raise rates, crowding out private investment. Too little and the economy stalls for lack of aggregate demand. Clearly, the deficit has been too small for several years running.
lilnev, I don’t disagree with your statement, although I wonder how much of the interest income is spent in the current period.
Yet, I disagree with your conclusion.
In the first four years of this depression, we managed to add $5 trillion of federal debt.
Why would more of the same over the last two years be any different (we still added $1 trillion more debt, even with record low interest rates).
Household net worth dropped over $16 trillion. You think $5 trillion should have been enough to fill that hole? That’s not counting any increase in foreigners’ desire to hold our currency, or in corporations sitting on profits rather than reinvesting them
Far more people want to save, to spend less than they earn, to try to repair those balance sheets. And, greater income insecurity makes people want to save more. And, many of those who still might have sought credit are being turned down because standards have tightened. And, business investment dropped because they see the huge drop in demand. The private sectors’ desire to net save has been enormous, but we can’t all do that at the same time, someone has to dis-save. When zero interest rates aren’t low enough to make borrowing attractive, and the fiscal authorities didn’t step up, that accounting identity was met the only way it could be: forcing millions of households into dis-saving by destroying their income through involuntary unemployment.
You wanted the federal government to give Americans who own assets $16 trillion or more “to fill that hole?”
Households should pay-down or pay-off debt (e.g. balances on a car or credit cards), or catch-up on bills, when debt levels are high, to raise discretionary income and strengthen the banking system.
That’s one reason large tax cuts were important, instead of the small and slow tax cuts we got.
And, people will use tax cuts most efficiently – the best way they see fit – rather than squander it.
When there’s excess private goods, the solution isn’t to create public goods.
The solution is to clear the market of private goods, to increase production.
Another reason why large tax cuts were needed is Americans bought foreign goods and foreigners bought U.S. Treasury bonds. Not enough of those dollars were “refunded” to consumers to allow the spending to go on.
We need more spending & saving and less squandering.
We can also praise the Fed. Lower interest rates and higher asset prices induce people to spend and borrow, and reduce saving, a lower cost of capital spurs production, refinancing at lower rates increases discretionary income, lower mortgage rates makes buying a home more affordable, 401(k)s and IRAs increase in value, etc. There are massive multiplier effects throughout the economy.
Monetary policy continues to do its job (for example, my parents refinanced their house last November, which was finalized last month, resulting in lowering their monthly payments by over $500 a month, through lower mortgage payments, the bank paying-off an almost new car, a credit card, along with a disputed charge with Citibank, and they have a lot of cash left over).
Fiscal policy and economic policies by Washington politicians were less effective and more counterproductive. Basically, they cultivated pro-growth and anti-growth policies simultaneously. With one foot on the accelerator and the other foot on the brake, it’s no wonder the result would be what it has been – an expensive depression.
The $16T figure is just to put the $5T added to the debt into perspective. I don’t think $16T should have been given directly to households (though that almost certainly would have ended the recession). $5T seems like a scary big number, but I think it was still inadequate to the scale of the problem. (And that’s just the balance sheet damage to households; income insecurity, foreign and corporate sectors all made their own contributions to the desire to save more).
I think we actually agree on a lot. Monetary policy has been good, it has just been limited by the zero bound, and that made it inadequate to the scale of the problem. Rates should have fallen substantially negative if we wanted desired savings and investment to clear within the private/foreign sector. (I think unconventional policy has been marginally helpful at bringing down longer-term rates, but not particularly powerful). The fact that unemployment stayed high and inflation below target, for years, tells me that it wasn’t enough, the aggregate desire to save was too great.
How much additional spending was needed? I don’t have a model-based answer, but I’d guess an additional (beyond ARRA and the automatic stabilizers) $1 to 2T per year for 2 or 3 years would have done wonders, depending on composition. Regarding composition, infrastructure spending produces long-lasting public goods in addition to providing private sector income; but it can be slow to bring online, and you get diminishing returns as you scale it up and it gets pork-barreled into bridges to nowhere. State budgets should definitely have been supported so they didn’t have to slash spending, lay off large numbers of public employees, etc. Tax cuts can be fast and large, and effective if they’re directed towards the bulk of the population with a high propensity to spend e.g. payroll tax cuts, not capital gains tax cuts. You could add some targeted programs — adding some money to encourage banks to write down and refinance underwater mortgages, energy efficiency retrofits to help employment in the hard-hit construction sector, grants for adults going back to school, etc — but the big three components should have been infrastructure, state aid and broad-based tax cuts.
“Let me begin by clarifying that the difference is not, as many other observers have often asserted, the fact that the U.S. debt is denominated in our own currency and therefore could always be repaid just by printing a sufficient quantity of dollars.”
I also want to hear more about these R&R case studies, don’t have my copy of the book with me. These were all cases where money-printing central governments reneged on debts? Not cases where, for example, a government refused to pay contractors for political reasons, or a congress and a president couldn’t agree on a budget and so temporarily halted payments? These are all cases where a government said: I declare all my debts null and void?
Second, “original sin” is at the heart of the Schreger paper, so it wouldn’t apply to the US. It’s also not clear to me the empirical part of the Schreger paper is measuring what he thinks it is measuring…
Thorstein Veblen: The technical definition of default is failure to make payment at the promised times and terms. The Reinhart-Rogoff survey includes some outright repudiations of domestic debt such as Russia in 1957, but a more common practice is to force creditors to accept new bonds at considerably less favorable terms for the lender as payment for sums owed.
As for original sin, do not forget that the U.S. Treasury issued some debt denominated in German marks in 1978 (e.g. Allan Meltzer, History of the Federal Reserve, vol. 2, chapter 7) and there have been more recent calls for the U.S. Treasury to issue yen-denominated debt. Schreger is also currently conducting ongoing research related to the paper I cite that looks at developed country debt and has some interesting preliminary findings regarding Japan.
So, I wanted to hear about other cases of defaults on domestic currency because I imagined that they probably involved crazy scenarios, or else were actually marginal default cases. Citing communist Russia’s default in 1957 only heightens my fears that these other examples are likely of limited relevance to the US case.
Second point, despite those interesting examples, the vast majority of public and private debt is in dollars, so I just don’t see how the Shreger paper, which is about original sin, is evidence that the lack of original sin in the US implies that the US doesn’t need to worry about default.
This is in reply to a string started 3 days ago, placed here for the convenience of readers who in the interest of time come only to the bottom of the stack for what might be new.
Debt is what brought the house down in 2008. Bear Stearns and Lehman were wiped out by debt, and the greatest financial panic of our lifetime shook the globe that fall. A massive credit bubble in the 1920s precipitated the Great Depression. Read Hyman Minsky’s work. Read Kindleberger’s Mania’s, Panics, and Crashes. Debt was the critical causal variable in each and every Panic in this nation’s 238-year history. These panics always tipped the economy into to recession or depression. Sometimes with slight delay. No exceptions. The Great Depression being the most notable calamity. These episodes are more than adequate proof of the proposition.
But you are looking for something more. Since you revere government as your god, it is inconceivable to you that the US government could ever default on its sovereign debt … or harm its citizens in any way. Perhaps the tinhorn government of some other country like Argentina or Greece, but never that of the great and omnipotent USA. Besides, the US has never defaulted on its debt. Wrong of course, but you do not know history. And if you did, you would say that was back in the time of gold. The US is no longer tied by that relic you’d say. Things are different now. And in any case, citing the authority of the great maestro we can always print sufficient money. Never mind that his statement is nested in a number of unspoken assumptions. Any one of which would put the lie to the whole thing if laid out on the tabletop so everyone could see the fuller argument in the light of day.
Your fundamental error is in believing there is a free lunch. US dollars can be created by the Fed out of thin air and redeem any Treasury paper at any distant point in time effortlessly. No default, no harm done. The truth of the matter is far different. But it would take a short essay to lay it all out for you. As there are scores of channels from where the Fed pushes the printing button to the endpoint of harm. Along the way you would have to understand the banking system, how banks create money, leverage, contagion, bubbles, self-feeding downward spirals, the private sector securitization that government paper and money printing give rise to, the interaction of the money economy and the real physical economy, and so on for many pages.
Briefly, here is but one channel. An admixture that at best feebly captures but a part of a far richer more complex thing. During Greenspan’s tenure, the Fed printed an excess of money over the natural economy’s real needs. This supported the deficit spending that occurred nearly every year during that period. Interest rates were suppressed, naturally so, as low rates and excessive printing are but different sides of the same coin. What government paper this enabled added to the stock of sovereign debt which at some future date – far away from present eyes – would require either taxes to be raised to redeem it, or of course an equivalent amount of newly minted government paper (including all along the way the annual interest payments due) to be issued. The causality ran like this. We want to spend. We don’t want to tax. So we will borrow. The Fed will print enough to make all this palatable. Unspoken but nonetheless so, this will suppress interest rates. And suppress risk premiums on private paper. As we see only slender inflation in the present moment, there must be no harm. Continuing with the causal chain, the low interest rate regime was an ongoing dynamic that thickened the narrow slab at the inverted pyramid base of a much larger and more amorphous edifice – total credit growth which instantly became a congeries of debt contracts that would blossom their own ill fruit of interest and debt repayment (and default) down the road. This narrow base was the fodder for repos, which were leveraged to the hilt to support each successively larger layer of credit stacked higher one atop the next. Hypothecated and re-hypothecated in extremus. The entire structure supported activity in the real sector such as home building (though not limited to that), and generated more than one complex, multiparted boom during Greenspan’s tenure. All of which went bust and caused great harm. None of these booms could or would ever have happened in the absence of the artificially bloated narrow base, which traces itself back to the first cause of deficit spending and debt. But since the initial cause is ongoing and dynamic (that is, it takes place over time), and far more importantly is far removed in time and place from the endpoints of interest repayment and final principal repayment, not even Nobelists let alone men on the street make the connection with harm done. The 2008 crisis wreaked massive harm. And still far more harm is encased as potential that as of this date is still not yet visible. By this latter I mean malinvestment as yet covered over, the entire regime of ZIRP and QE which will have their own ill consequences at some yet future date, all the bad US paper that stuffed Europe to the gills and enabled the train wreck the eurozone is today, the trillions of additional debt entailed to bail out from the crisis that is now on the books, and more. And note, this is only one combination of the scores of channels aforementioned. There is much more to the story which space does not permit. It is because of this that I’ve given the suggested readings.
To continue … US government debt in the wake of the Civil War never got above 33% as a percent of GDP. This country had many great, financially prudent presidents in first half of its life. Since JFK, none financially prudent. Government debt to GDP was a mere 33% when the Japanese struck Pearl Harbor. Not until the final month of the war did the government’s debt ratio exceed 90%. This above-90% episode ran from 1944 to 1950, as debt climbed to an apogee and then rapidly got paid down. By the end of the war, private debt had fallen to the lowest ratio of the century. The vast pool of private savings built up during the war enabled the postwar acceleration of private credit which boosted growth while the federal debt was being paid down.
Private debt to GDP did not get back to the 128% Depression high until the year 2000. A recession got underway the next year. By the cycle peak preceding the Great Recession, private debt had smashed all records rising to 168%. Other than for a brief 24-month period in 1944-45, the government debt ratio has never been higher than it is today. Every single month since 2000, the private sector ratio has been higher than any other time in US history. Total debt hit its all-time high in 2009. Total debt today is not far off that and is once again rising. Government debt is far up in the danger zone. Read Reinhart and Rogoff. One does not have to have cancer to observe it in others (other countries), learn what causes it, and take appropriate precautions. Japan has experienced not one but two lost decades since its sovereign debt climbed into the danger zone where it is still mired. Greece is bankrupt, and will unravel the eurozone.
Yet as I understand you, you believe US sovereign debt cannot be a problem. You believe the US can print its way out of any such problem in this post-gold fiat era. You cite the all-time master printer as authority on this. The gross federal debt has been above 90% only twice: post WWII and today. These are the only two observations in US history. And the second one isn’t complete yet. I addressed the idiosyncratic nature of the first. We did not print our way out then. We paid the debt down. The private sector was on solid ground able to pull the government out of the swamp. That is not the case today. Nor will it be for a long, long time. Already during this current yet-to-be-completed episode we’ve experienced the poorest recovery in US history. That has not been a problem? And going into 2008 the sovereign debt ratio was only 63%!
Your solution entails inflation plain and simple. Comprenez-vous the destructive nature of inflation? At a minimum, double-digit inflation for an extended period of time is what your proposed solution amounts to. Of course the US won’t default in the conventional sense. But the economy would be ground to dust by the medicine you prescribe. Have you even considered the step-function loss of reserve currency status that would crush the US dollar? Or the risk premium global investors would demand to buy US bonds that have lost their investment grade rating? The venerable archetypal metaphor for what you propose is out of the frying pan into the fire. You of course are not alone. But after reading this and doing your due diligence by reading the references cited, you unlike others will no longer have the excuse of ignorance. That ignorance, by the way, being perhaps not your fault but that of your professors.
Where is the Hyper-Inflation You Conservatives Promised Us 4 Years Ago?
“Your solution entails inflation plain and simple. Comprenez-vous the destructive nature of inflation? At a minimum, double-digit inflation for an extended period of time.”
You are still crying wolf about “double-digit” inflation? Seriously? Look out the window dude; there is no inflation after the Fed quadrupled the money supply. There was no “double-digit” inflation after Reagan tripled the federal debt either. We haven’t had any serious inflation for more than 20 years and yet you are still fear mongering about it.
Nobody believes your nonsense theories about money and the economy any more. Give it up and get a clue.
JDH: Re the first paragraph of your post.
The question to turn to is not so much that of the US someday finding itself in the same boat as Greece. The question to turn to is the far more pertinent one of how an imminent Greek exit from the eurozone will play out. Greece’s exit is immanent because it is bankrupt. And newly elected Syriza, with not only a talented Prime Minister but blessed with the most economically sophisticated Finance Minister on the globe, has little to lose and much to gain by pulling the plug. Which for the sake of the Greek people, should have been done at the time of the first bailout in 2010 rather than acquiescing to the troika’s debilitating austerity conditions. Those bailout funds flowed straight back out of Greece to European banks, with only 10% or so reaching the Greek public. How incredibly sad for the Greeks! This new government, however, is not beholding to Brussels. Fool me once, shame on you. It will not happen again.
The situation for Greeks only deteriorated after the first bailout. Greece is now on the hook for a doubled down debt incurred by taking the second round of bailout money. As well as for all the interest payments. Greek exit is the starting point of a high probability cluster of possible paths, any one of which threaten 2008-type damage to the US economy via the financial contagion that will ensue when some coming event (perhaps as far off as China or Japan) finally triggers the giant ball of systemic risk the globe is enveloped in. The causal path of disruption is along the line of a Greek exit, another periphery country following, at which point the eurozone dissolves or reconfigures. Along the way, the top-heavy European banking structure will come under tremendous stress. Top-heavy in that in some European nations the book value of the assets of that nation’s single largest bank exceeds the nation’s entire GDP. (Compare to all 8,000 US banks together only 80%.)
The troika has cleverly taken 78% of Greek sovereign debt out of circulation onto its own books to tamp down bank risk. But that kind of legerdemain will not be possible with Spain or Italy’s sovereign debt. The amount of their less-than-investment-grade paper is far too large. Moreover, gorging on Greek debt as it machinated the largest bailout in world history, the troika is now leveraged to the hilt. What is not being discussed, except behind closed doors out of sight of the public’s eye, is the potential insolvency of the ECB itself. How might a central bank the size of the ECB be dismantled if the eurozone splinters? The world has never known such a thing before, though far smaller central banks have become insolvent. At the same time, Syriza’s victory is bringing the European public out of its long slumber and into awareness. The Ponzi game of debt musical chairs will go on for a while longer because ECB quantitative easing keeps the music playing. But Podemos is now neck to neck in the polls with Partido Popular to win the Spanish general election later this year. As events unfold in Greece, perceptions of Spain leaving the euro will rise, and bank runs will threaten in Spain and elsewhere on the continent. Perceptions count, and have consequences.
This topic deserves a post in its own right. As does the separate but related question of what exactly are the unintended consequences of the Fed’s ZIRP and QE. A question I’ve asked a number of times to nothing but resounding silence. What otherwise does “Analysis of current economic conditions and policy” on your masthead imply?
Re: Rates of Depletion in CNE (Cumulative Net Exports of oil)
Export Land Model
I constructed a simple little mathematical model, to help me understand “Net Export Math,” that I called the Export Land Model (ELM). I stipulated that domestic oil consumption increased at 2.5%/year from 1990 to 2010. Production increased at 5.0%/year from 1990 to 2000, and then fell at 5.0%/year from 2000 to 2010. The ECI Ratio (ratio of production to consumption) was 2.0 in the year 2000.
The 2000 to 2007 rate of decline in the ECI Ratio for the ELM was 8.0%/year. This corresponded to a 43%/year rate of depletion in post-2000 CNE. In other words, from 2000 to 2007, the remaining volume of post-2000 CNE fell at a rate of 43%/year.
Key observation, based on ELM: Given a declining ECI Ratio, the rate of depletion in post-export peak CNE tends to exceed the rate of decline in the ECI Ratio.
Following is a chart showing normalized values for production, ECI Ratio, net exports and remaining post-2000 CNE, by year for the ELM:
http://i1095.photobucket.com/albums/i475/westexas/Slide1_zps53b4428b.jpg
Six Country Case History
The Six Country Case History consists of the major net oil exporters, excluding China, that hit or approached zero net oil exports from 1980 to 2010. Their combined net exports peaked in 1995.
The 1995 to 2002 rate of decline in the ECI Ratio for the Six Country Case History was 2.7%/year. This corresponded to a 26%/year rate of depletion in post-1995 CNE.
In other words, the Six Country Case History supports what the ELM predicted that we would see, to-wit, that the rate of depletion in post-export peak CNE exceeded the rate of decline in the ECI Ratio.
Following is a chart showing normalized values for production, ECI Ratio, net exports and remaining post-1995 CNE, by year for the Six Country Case History:
http://i1095.photobucket.com/albums/i475/westexas/Slide2_zps55d9efa7.jpg
Saudi Arabia
The 2005 to 2012 rate of decline in the ECI Ratio for the Saudi Arabia was 5.0%/year. This corresponded to a 6.6%/year rate of depletion in estimated post-2005 CNE (CNE estimate based on 2005 to 20012 rate of decline in the ECI Ratio).
Following is a chart showing normalized values for production, ECI Ratio, net exports and estimated remaining post-2005 CNE, by year for the Saudi Arabia:
Top 33 Net Oil Exporters in 2005 (What I define as GNE, Global Net Exports of oil)
The 2005 to 2012 rate of decline in the ECI Ratio for the Top 33 was 2.0%/year. This corresponded to a 3.4%/year rate of depletion in estimated post-2005 CNE (CNE estimate based on 2005 to 20012 rate of decline in the ECI Ratio).
Following is a chart showing normalized values for production, ECI Ratio, net exports and estimated remaining post-2005 CNE, by year for the (2005) Top 33 net oil exporters:
http://i1095.photobucket.com/albums/i475/westexas/Slide3_zpse00789d2.jpg
Available Net Exports of oil (ANE)
ANE are defined as Global Net Exports of oil (GNE) less the Chindia region’s (China + India’s) net imports (CNI). ANE, the volume of GNE available to importers other than China and India, fell from 41 mbpd in 2005 to 35 mbpd in 2012. (ANE fell to 34 mbpd in 2013.)
The GNE/CNI Ratio is analogous to the ECI Ratio. The following chart shows 2002 to 2012 GNE/CNI data, with the extrapolation based on the 2005 to 2012 rate of decline in the ratio.
http://i1095.photobucket.com/albums/i475/westexas/Slide20_zps26112103.jpg
The 2005 to 2012 rate of decline in the GNE/CNI Ratio was 9.2%/year. This corresponded to a 11%/year rate of depletion in estimated post-2005 Available CNE (Available CNE estimate based on 2005 to 20012 rate of decline in the GNE/CNI Ratio).
In other words, my data suggest that from 2005 to 2012 we burned through the remaining cumulative volume of Global Net Exports of oil available to importers other than China & India at the rate of about 11%/year.
What is “Interesting” is the steady increase in global public debt, versus the observed rate of decline in the GNE/CNI Ratio and the rate of depletion in remaining estimated post-2005 Available CNE.
Following is a chart showing the GNE/CNI Ratio versus global public debt, from 2002 to 2012:
http://i1095.photobucket.com/albums/i475/westexas/Slide23_zps62b6932a.jpg
A couple of corrections:
Saudi Arabia
The 2005 to 2012 rate of decline in the ECI Ratio for the Saudi Arabia was 5.0%/year. This corresponded to a 6.6%/year rate of depletion in estimated post-2005 CNE (CNE estimate based on 2005 to 20012 rate of decline in the ECI Ratio).
Following is a chart showing normalized values for production, ECI Ratio, net exports and estimated remaining post-2005 CNE, by year for the Saudi Arabia:
http://i1095.photobucket.com/albums/i475/westexas/Slide21_zps74c9ebac.jpg
Top 33 Net Oil Exporters in 2005 (What I define as GNE, Global Net Exports of oil)
The 2005 to 2012 rate of decline in the ECI Ratio for the Top 33 was 2.0%/year. This corresponded to a 3.4%/year rate of depletion in estimated post-2005 CNE (CNE estimate based on 2005 to 20012 rate of decline in the ECI Ratio).
Following is a chart showing normalized values for production, ECI Ratio, net exports and estimated remaining post-2005 CNE, by year for the (2005) Top 33 net oil exporters:
http://i1095.photobucket.com/albums/i475/westexas/Slide3_zpse00789d2.jpg