The yield on a 10-year Treasury inflation protected security was negative through much of 2012 and 2013, and remains today below 0.25%. Have we entered a new era in which a real rate near zero is the new normal? That’s the subject of a new paper that I just completed with Ethan Harris, head of global economics research at Bank of America Merrill Lynch, Jan Hatzius chief economist of Goldman Sachs, and Kenneth West professor of economics at the University of Wisconsin, which we presented at the U.S. Monetary Policy Forum annual conference in New York on Friday.
For the project we assembled annual data on the interest rate set by the central bank (or close substitute) along with inflation estimates for 20 different countries going back in some cases to 1800, along with more detailed quarterly data since 1970. We constructed a proxy for expected inflation using autoregressions estimated over rolling windows. The figure below plots the resulting annual series for the ex-ante real interest rates for eight of the countries we looked at.

Ex-ante real interest rates for Australia, Denmark, France, Netherlands, Norway, Spain, Great Britain, and the United States, 1858-2014. Source: Hamilton, Harris, Hatzius, and West (2015).
We found little support in these data for two of the popular conceptions many people have about real interest rates. First, although it is often assumed in theoretical models that there is some long-run constant value toward which the real interest rate eventually returns, our long-run data lead us to reject that hypothesis, consistent with other studies of postwar data by Caporale and Grier (2000), Bai and Perron (2003), and Rapach and Wohar (2005). For most countries, real rates were significantly higher before World War I than they have been since. The world wars were associated with big negative real rates, spectacularly so for countries like Germany, Japan, Italy, and Finland (not shown in the figure above).
We also found little support for the popular assumption that the long-run economic growth rate is the primary factor driving changes in the equilibrium real interest rate over time. The graph below summarizes the U.S. experience over the last 7 economic expansions. The figure plots the average annual real GDP growth rate from business cycle peak to peak on the vertical axis and the average real interest rate on the horizontal axis. The correlation is actually negative, contrary to the popular assumption that a higher long-run GDP growth rate would be associated with a higher long-run equilibrium real rate, though we could get a modestly positive correlation if we threw out the brief expansion ending in 1981:Q3.
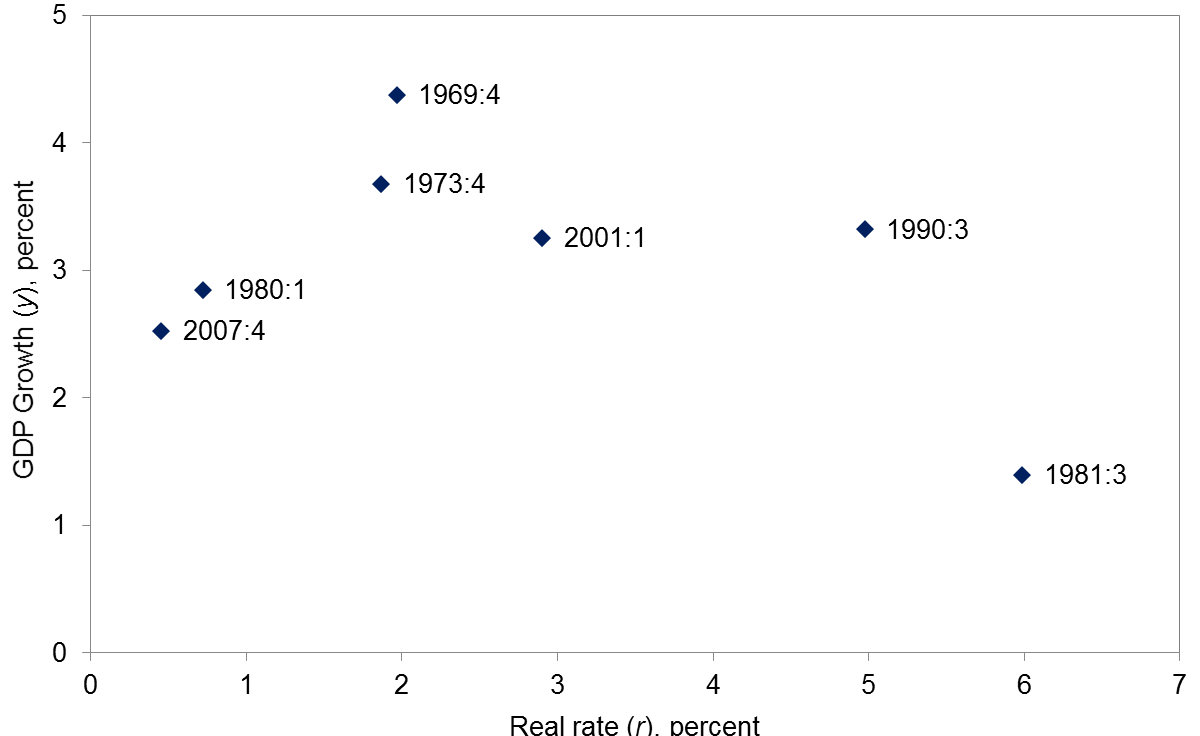
Peak-to-peak average U.S. real GDP growth versus average ex-ante real interest rate, quarterly data 1969:Q4-2007:Q4.
Source: Hamilton, Harris, Hatzius, and West (2015).
Using the longer annual data set, we found a positive correlation between the growth rate and real interest rate across business cycles, (correlation of +0.23 and R2 of 0.05). But this correlation would become -0.23 if we dropped the cycles ending in 1920 and 1948.
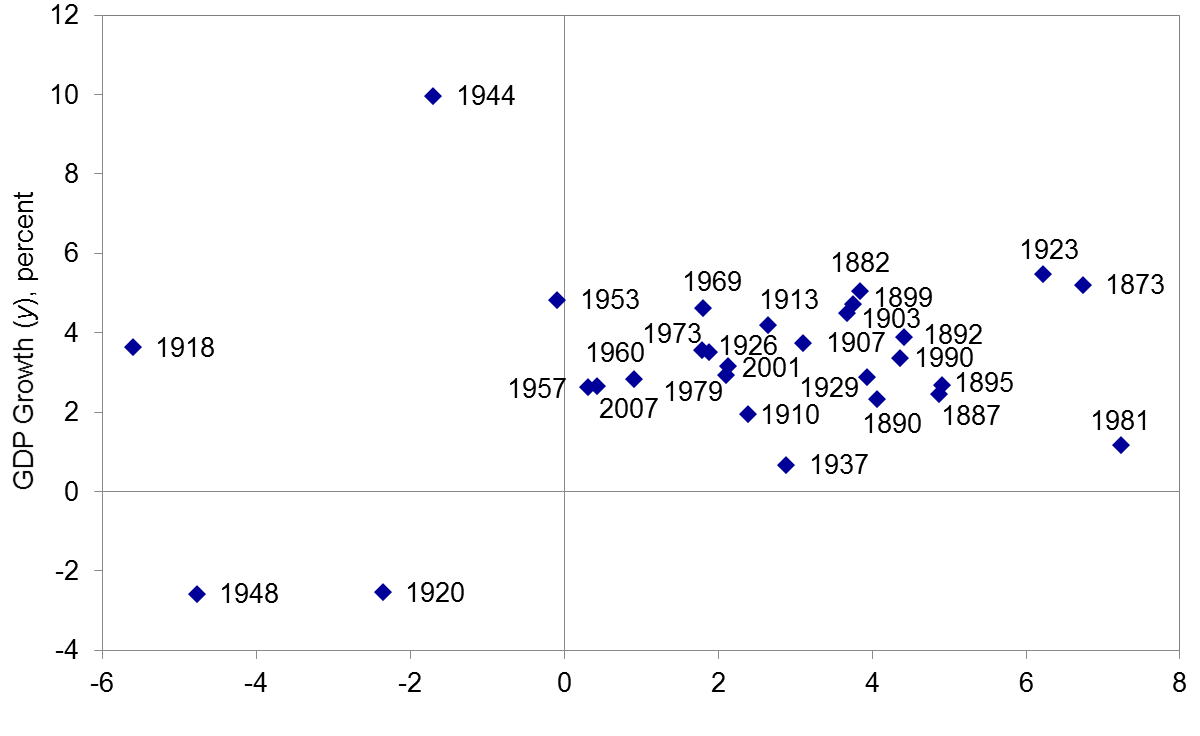
Peak-to-peak average U.S. real GDP growth versus average ex-ante real interest rate, annual data, 1873-2007.
Source: Hamilton, Harris, Hatzius, and West (2015).
If we look at cross-sectional evidence of 30-year averages of growth rates and real rates across countries, we find a correlation of 0.42 (R2 = 0.18). But this correlation would become negative if Australia had not been included. We come away from our investigation quite skeptical of any analysis that puts growth of actual or potential output at the center of long-run real interest rate determination.
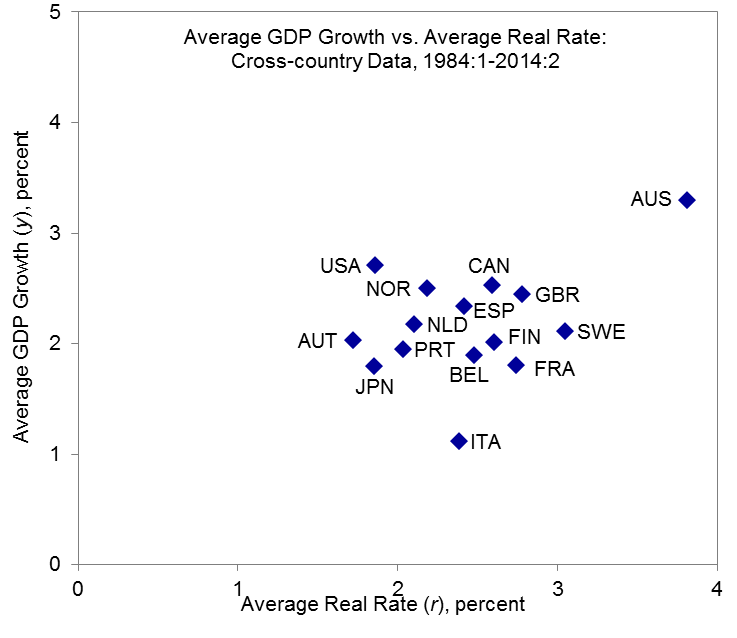
Cross-country scatterplot of average real GDP growth rate over 1984:Q1 to 2014:Q2 (vertical axis) and ex ante real rate.
Source: Hamilton, Harris, Hatzius, and West (2015).
Our paper provides a detailed narrative discussion of what seems to explain changes in long-term averages of the real interest rate over time. We conclude that changes in personal discount rates, financial regulation, trends in inflation, bubbles and cyclical headwinds have had important effects on the average real rate observed over any given decade. We examine the secular stagnation hypothesis in detail. On balance, we find it unpersuasive, concluding that it confuses a delayed recovery with chronically weak aggregate demand.
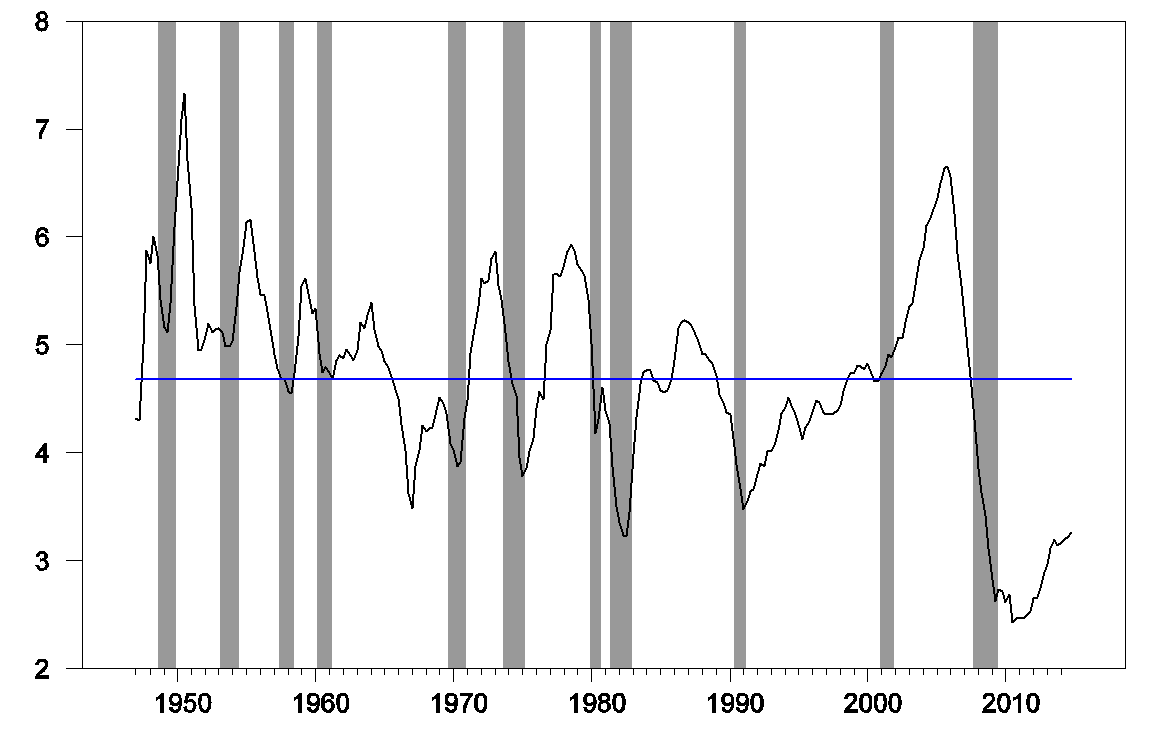
One point that is often lost in discussions of these issues is the role of the monetary tightening cycle. As seen in the figure below, the gap between the nominal fed funds rate and the trailing one-year core inflation rate became quite high at the peak of each of the previous 5 monetary tightening cycles.
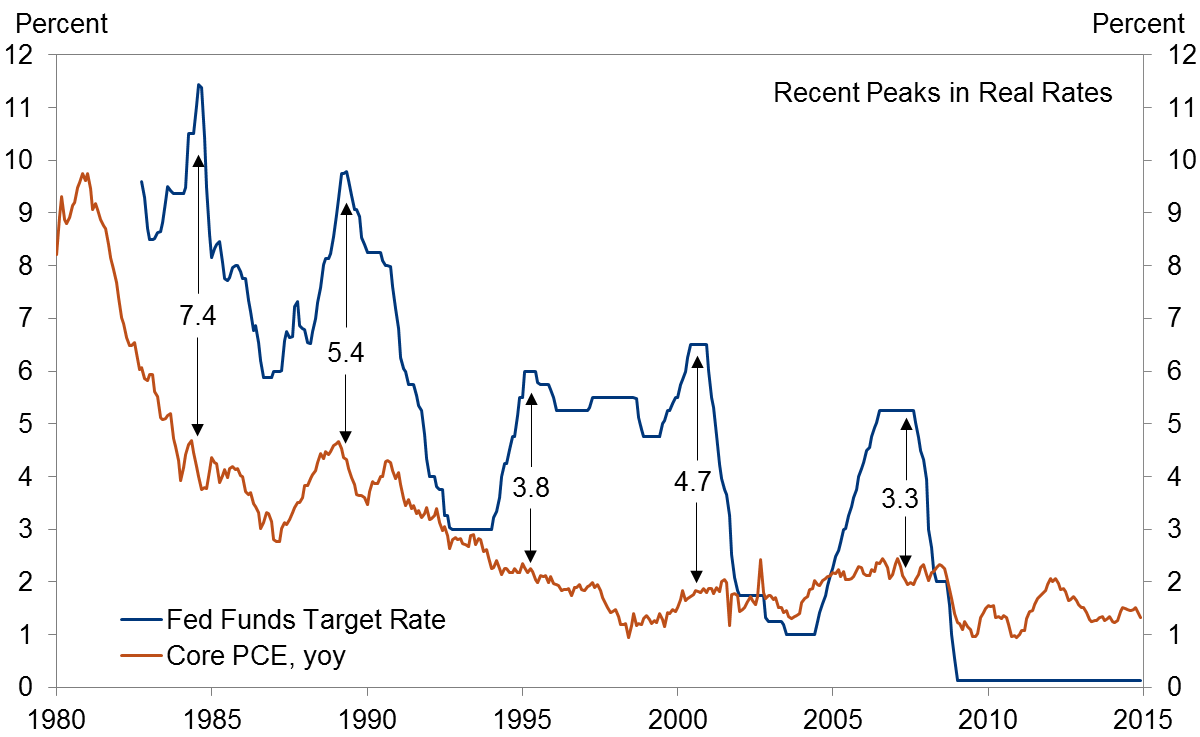
Nominal fed funds target (blue) and year-over-year change in core PCE deflator (red), 1980:M1-2014:M12. Source: Hamilton, Harris, Hatzius, and West (2015).
Nevertheless, if one were to look at the size of that gap at the point when output equaled potential GDP– a point we have yet to reach in the current cycle— the real interest rate at that point would have still appeared to be quite low in several of those episodes.
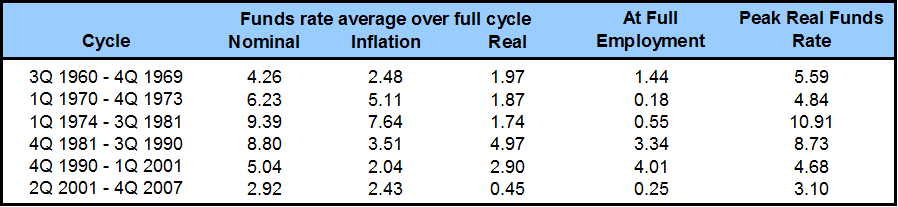
Nominal rates, inflation rates, and ex-ante real rates over postwar business expansions. Source: Hamilton, Harris, Hatzius, and West (2015).
It’s worth remembering that recoveries from financial crises often take many years. Based on indicators such as housing investment as a percent of GDP, there is still significant potential for cyclical expansion in the U.S. Our paper reviews a great deal of evidence that leads us to conclude that those who see the current situation as a long-term condition for the United States are simply over-weighting the most recent data from an economic recovery that is still far from complete.
Black: path for fed funds rate implied by median forecast of FOMC members; blue: path for fed funds rate that would be optimal if Fed officials may have overestimated or underestimated r* by 150 basis points. Source: Hamilton, Harris, Hatzius, and West (2015).
We found what appears to be a stable statistical relation in our long-run data set in the form of a cointegrating relation between the U.S. ex-ante real interest rate (plotted in black in the figure below) and a measure that is similar to the median of 30-year-moving average real rates across the world (shown in blue). When the U.S. is below the long-run world rate, as it is now, we’d expect the U.S. rate to rise.
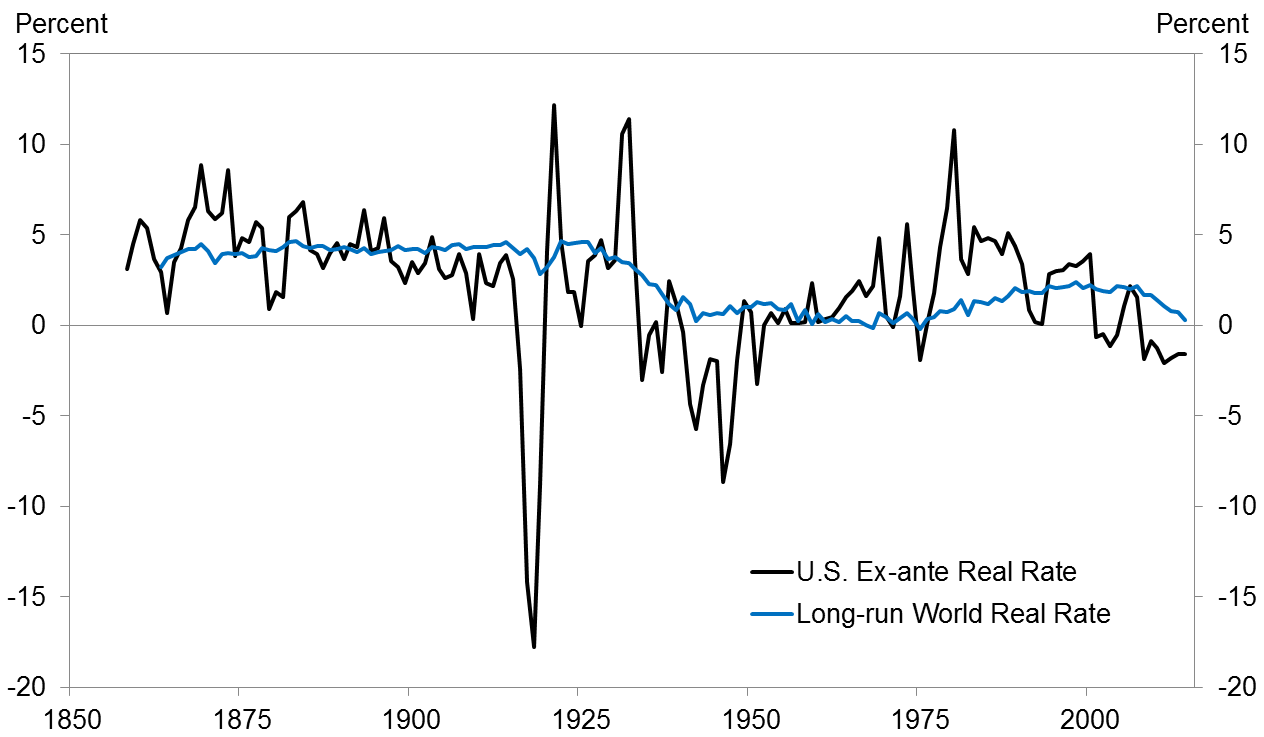
U.S. real rate and long-run world rate, 1858-2014. Source: Hamilton, Harris, Hatzius, and West (2015).
We also calculated the current forecast implied by that cointegrating relation, which is shown in the figure below. We can have confidence that the U.S. and world rates will eventually converge to each other, but the exact value to which they will converge is subject to growing uncertainty the farther into the future we try to project, as a necessary consequence of the permanent and sometimes dramatic shocks to world equilibrium real rates that characterize the historical data.
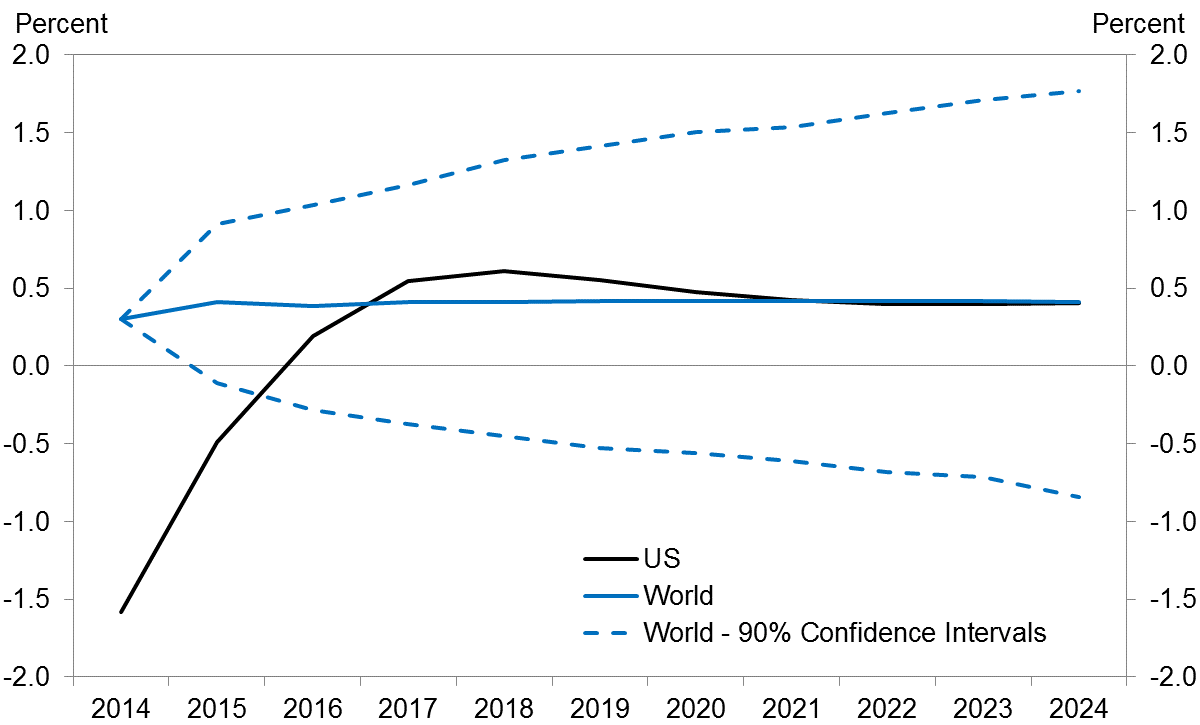
Current and projected values for the short-run U.S. ex-ante real rate (in black) and long-run world rate (in blue) along with 90% confidence intervals for the latter. Source: Hamilton, Harris, Hatzius, and West (2015).
Finally, our paper discusses the implications of these findings for monetary policy. Orphanides and Williams have noted that if the central bank does not know the true value of long-run equilibrium magnitudes like the real interest rate, it pays to incorporate more inertia in the conduct of monetary policy. We perform some simulations using the FRB/US model to gauge the relevance of this concern in the current setting. We conclude that, given that we do not know the equilibrium real rate, there may be benefits to waiting to raise the nominal rate until we actually see some evidence of labor market pressure and increases in inflation. Relative to the “shallow glide path” for the funds rate that has featured prominently in recent Fed communications, our findings suggest that the funds rate should start to rise later but– provided the recovery does gather pace and inflation picks up– somewhat more steeply.
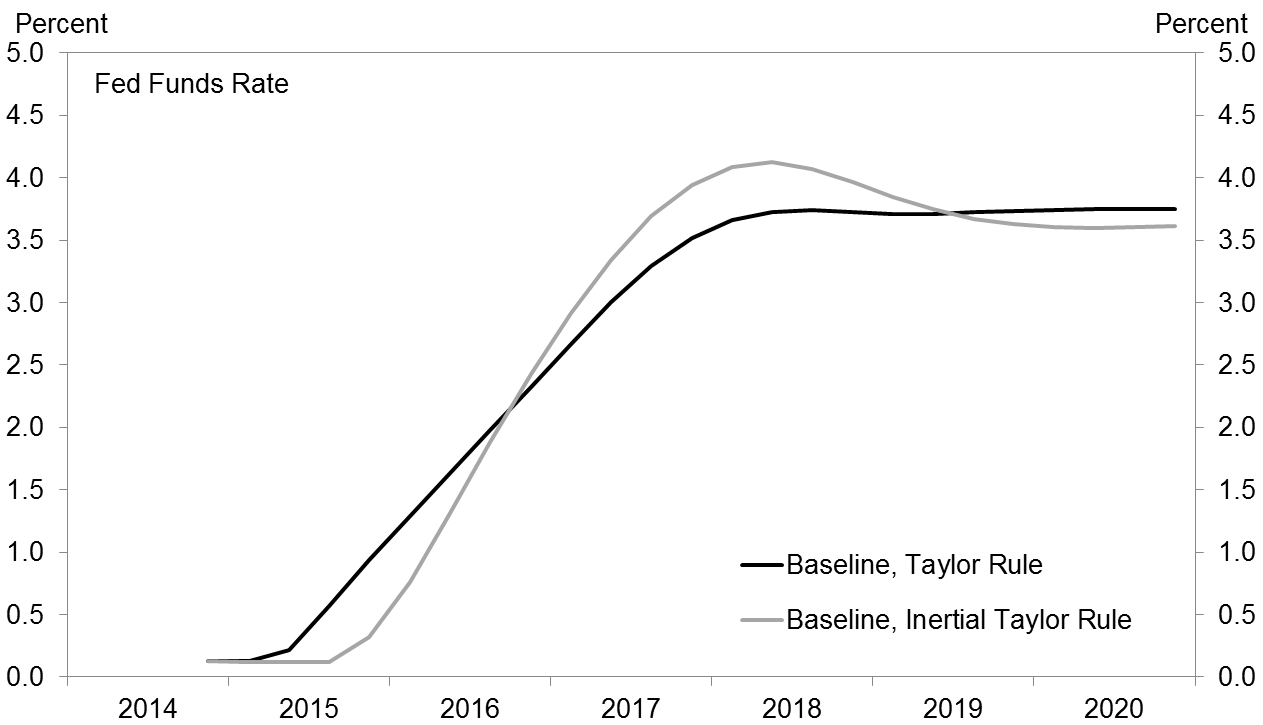
Black: path for fed funds rate implied by median forecast of FOMC members; blue: path for fed funds rate that would be optimal if Fed officials may have overestimated or underestimated r* by 150 basis points. Source: Hamilton, Harris, Hatzius, and West (2015).
An interesting result. However, I am left with two questions. One, how confident can you be in your historical interest rate data and especially in your estimates of inflation? Two, how do you explain Larry Summers’ prime piece of evidence for secular stagnation–the relative weakness of US growth from c. 2000 to 2007? (And explain how extremely weak the 2000-2007 growth would have been without mortgage equity extraction: there would have been barely any prior to 2005.)
I keep wondering if the very large trade deficits, which I understand subtract directly off GDP numbers, might have something to do with such weakness? Is secular stagnation of the developed world just a synonym for exported demand via globalization? I would love to have someone actually examine this, as I have wondered about it for over a decade now.
William Meyer: It would certainly be very problematic to compare an estimate of the CPI in 1858 with the CPI today, but that is not what we do. For our purposes what we need is an estimate of the year-to-year inflation. Even if you are skeptical of our estimates of year-to-year inflation early in the sample, we argue in the paper that our broad conclusions about the early trends come from high nominal rates in the 1800s with little trend inflation, and huge inflations during the world wars. Our conclusion about those broad features we think is quite robust.
As for secular stagnation, please note the following. (1) Summers claims this phenomenon goes back to the 1990s, which we think we refute pretty convincingly in the paper. (2) Our primary focus is the equilibrium real rate of interest, not the equilibrium real growth rate, and you see above some of the reasons why we think these two questions are separate. Personally I believe the rate of growth of potential GDP has permanently slowed, but that is not the issue here. Gordon’s arguments for slowing potential GDP growth have nothing to do with chronically deficient aggregate demand. (3) We also note in the paper that despite the housing bubble, the U.S. economy faced some headwinds over this decade from rising oil prices and the trade deficit– a significant part of that mortgage equity withdrawal went to finance imported goods.
It makes sense real rates are determined worldwide, at least in some long run reversion. I do wonder whether per capita gdp growth may be any more relevant.
In the second graph with real growth plotted against the real rate, both 1981 and 1990 should be taken out because the Fed was artificially raising the real rate to the range of 5% to 6% to control inflation momentum from the 1970’s. For me the analysis of the authors is put into question because they do not recognize that real rates can be manufactured by monetary policy. This is confirmed in their first set of graphs where the real rates for the USA are the real rates produced by monetary policy and not the natural real rates. So the real rate that they use in their analysis is not the true and natural real rate. ThEir analysis is thus led astray.
The natural real rate is still purely represented by population and productivity growths and growth in productive capacity.
Now since the crisis, productive capacity has not grown at all. This is unusual and shows that the economy is “sick” and that the natural real rate has fallen. But will the natural real rate of this business cycle end up being negative? I don’t think so. I foresee around +1.8% as others do. In that light, the Fed rate is too low now which overtime time will weaken productive capacity through encouraging “low road” firms that are reluctant to raise wages and burdensome for increased productivity.
Also inflation is low largely due to suppressed labor share worldwide in the face of srrong supply capacities. Thus keeping the Fed rate low expecting inflation and real wages to rise will be a disappointing policy. So I also disagree with authors above on keeping the nominal rates low.
nice paper professor.
“Relative to the “shallow glide path” for the funds rate that has featured prominently in recent Fed communications, our findings suggest that the funds rate should start to rise later but– provided the recovery does gather pace and inflation picks up– somewhat more steeply.”
i really like this conclusion. unfortunately, this paper has garnered interest in the business media, and the study ends up being quoted as saying the fund rate should start to rise somewhat steeply. the business media has been skipping the rest of your statement, which is rather unfortunate. i hope they modify their reporting to be more accurate going forward.
The question many ask is not why the interest rate is low relative to recent decades, but why it is low in the 5th year of a “recovery”. Were not the low interest rates another effort to “stimulate” the economy? After $100s billion of cash stimulation plus the non-existent interest rates, shouldn’t we have reached the stage where the economy is just humming along and real interest rates reflect that humming along economy? And if we have reached that stage, why are lenders (savers) being penalized?
I intend to read the paper, which looks quite fascinating, but I cannot resist responding to Bruce hall’s comment.
Savers are not being “penalized.” Liquid savings, in the sense you are using it, are for safety net purposes, not wealth-building, and the purpose of monetary policy is not to make savings a hot investment but to provide for non – inflationary full employment.
Meanwhile, bernanke noted for years that fiscal policy also has an important role to play and it hasn’t been allowed to; monetary policy can’t do it alone, especially given that housing, normally a key driver of growth under low interest rates, still suffers the psychological overhang if the housing bust and the inability of new households to come up with a down payment.
howard, i agree and have been saying the same thing. why is a saver “entitled” to a high interest rate environment? you want return, put your money into a riskier investment. we are in a world where having capital in itself no longer suffices to increase wealth. you need to effectively put that capital to work. the lazy way of putting it into a savings account or conservative bond is no longer viable. you need to do something with the cash, open a business, expand a business, etc. but the business world is demanding more than passive behavior for profit today. what this implies is the world is probably too flush with free capital, and is creating a competitive environment for its growth. this might have something to do with the growth in inequality, and ultimately too much accumulated capital in the hands of certain wealth profiles. we need more capital in the hands of folks who will do something active with it, rather than place it in a passive bond fund.
Eh, from where does the money for lending come? Well, obviously not from “savers”, but from the Fed’s presses. But is that really a healthy approach? Lots of argument on that front.
With regard to investment, building a company would be my version of investment, but others prefer Las Vegas and the NYSE. Somehow, we tend to get whiplashed more with the latter.
bruce, you are missing the point. you are taking the view that “savers” provide the critical capital with which to lend money. but the demand for debt, such as mortgages, is actually rather low. so the “savers” need to put their money to better use in other, riskier investments. but they do not want to do this. and that is why the interest rates are so low. too much crowding into the equivalent of savings accounts. and equities are only a solution if you have lots of new equity offerings. spending money on existing equities and driving up their price is not really the type of growth we need. you need money put into new business ventures or new equity offerings. but people are afraid of the risk.
again the major point is savers are not being penalized. they are being rewarded appropriately for the risk they are taking with their investment-no risk then no reward. i know this is not the environment the savers desire, but it is the environment the market is dictating. the market is flush with capital that does not want risk-but you pay a price for that. negative interest rates on euro bonds is an example.
Howard wrote:
Liquid savings, in the sense you are using it, are for safety net purposes, not wealth-building, and the purpose of monetary policy is not to make savings a hot investment but to provide for non – inflationary full employment.
Howard, you wrote one of the best sentences I have seen to describe the fallacy of demand side Keynesian thinking. It will be instructive to compare your theory to the results of Indian economic policy. The first action of Raghuram Rajan when he became the head of the RBI in the fall of 2013 was to raise interest rates. The Keynesian world took a collective gasp. Heresy! Well, India now has the fastest growing economy in the world, even surpassing China. India is conservatively projecting 8% growth next year.
There is a real difference between growth as shown by China and even Brazil. The increase in China and Brazil was due to significant government spending. Government spending is basically consumption not the creation of real productive wealth. India on the other hand has generated real wealth over the past year with increases in business creation due to an inflow of capital. Investors of the world are rushing to invest in India because it is almost the only place to get a real ROI. A good indication of this can be seen in the price of the India small cap ETF, SCIN. The day before Ragan took over the RBI in September 2013, SCIN was at 8.30. When Narendra Modi was elected Prime Minister in May of 2014, SCIN had jumped to 13.03. As Modi presents his first budget with a 5% cut in business tax rates (30% to 25%) SCIN was at 18.47. Here we have a real world example contrasting Keynesian solutions to supply theory solutions. My money is with India. Is your money with Europe? Let’s watch this play out.
I’m not sure what this has to do with Keynesian theory. No one ever said the supply side of the economy doesn’t exist. India no doubt has a lot of potential supply so with good policies it can enjoy strong GDP growth. Tightening by the Central bank may therefor be necessary if the economy is in danger of overheating into inflation.
Wow, big project and a lot of issues in there. I’ll take on just a few.
The market in interest rates is set in nominal terms according to expected growth in nominal incomes. It might seem like that’s practically the same thing as setting rates in real terms according to growth in real terms, but it’s not quite. Anticipated income growth is not the same as anticipated price growth. The more open the economy, the more they differ. Past inflation is not the same as anticipated inflation.
I agree that real rates swell and sink with the business cycle more than with growth rates. Growth is usually strongest early cycle, real rates highest mid-cycle.
I don’t agree with the general line that the US is still somehow in early cycle more than five years into an expansion. That part makes me think here comes Hatzius the sell-sider making that growth=is-about-to-accelerate pitch yet again. Seriously, he’s more predictably over-optimistic than the IMF. The long-term growth rate has slowed, and there are simple demographic explanations for much of that.
The US economy has taken a drastic turn since 1980. Every decade since, real interest rate has declined. If interest rate is the equilibrium for demand and supply for funds then what does the declining trend of interest rate say about supply of funds or demand for funds. Too much money floating around and not enough investment opportunities?
“…we could get a modestly positive correlation if we threw out the brief expansion ending in 1981:Q3.”
In the oil data, the period between the 1980 and the 1982 recessions looks like a recession. It is an integral part of the Second Oil Shock and I treat these two, along with the interim period in 1981, as part of the same shock. The Europeans, by the way, treat the entire second oil shock, from 1980-1983, as a single recession.
From my perspective, you should feel free to drop that period from your analysis and treat it as a recessionary period, in effect.
The Long Wave, folks. Long Wave Peaks occurred in the 1810s, 1860s, 1920, and 1980-81. We’ve been in a Long Wave Downwave since 1980-81 and in a debt-deflationary (without much debt deflation so far) Long Wave Trough regime since 2008, not unlike in the 1830s-40s, 1880s-90s, 1930s-40s (mass distortions from WW II, of course), and Japan since 1998.
Also, the real rate was high during the Long Wave Downwave Victorian Depression because prices fell 50% while wages were effectively flat, doubling real purchasing power of the period.
There is no longer a reflationary effect to investment, production, consumer borrowing and spending, and real GDP per capita from positive real rates because the total net flows to the gov’t and financialized sectors (financial services, gov’t, health care via insurance, education by way of student loans, and “Social Media Valley” from IPOs and stock option compensation) now absorb most, if not all, annual growth of value-added output of the economy.
The reflationary effects of the Long Wave Downwave from falling nominal interest rates and a negative real Fed funds rate is over now that incipient deflation has arrived, the yield curve is flattening, and the Fed is at ZIRP. Growth will not be driven by additional debt to wages and GDP but now has to come from retained earnings and accelerating private investment to GDP and growth of after-tax and -debt service labor’s share of GDP.
However, the largest firms by market cap have been borrowing at a record high to wages and GDP to repurchase shares rather than grow investment with revenues growing at the slowest rate since the Great Depression at ~2.5%, which is around the post-2007 trend rate of GDP. Nominal GDP and earnings growth at ~2.5% implies a similar rate of growth of money supply (less bank cash assets/reserves)/deposits, which is insufficient growth of total debt-money to service the existing total debt outstanding, let alone grow it further as a share of wages and GDP and thus cause faster growth of real GDP per capita.
The Long Wave Trough has historically been an era of “secular stagnation” and price and debt/asset deflation, i.e., “consumption of capital”, characterized by extreme wealth and income inequality, falling money velocity, steadily decelerating or contracting real GDP per capita, labor-capital conflict, indifference of elites, increasing mass-social anxiety, fear, anger, and resentment, social and political polarization and instability, and social and political reaction and war.
If I compare the graph “Current and projected values for the short-run U.S. ex-ante real rate…” with the graph “Black: path for fed funds rate implied …” (Fed Funds Rate) it seems to indicate a forecast for U.S. inflation of about 3%. Am I missing something? For example, is the real rate in the former graph a longer-term rate (and thus we can interpret the two as indicating an inverted yield curve in a few years)?
tew: You are comparing two different forecasts made by two different entities. The first graph you ask about is a forecast based on the historical cointegrating relation. The second graph is a forecast based on the median response of FOMC members. FOMC members can make their forecasts any way they want and there is no presumption that their implicit forecast of the real rate is consistent with the forecast of a real rate that comes out of the historical cointegrating relation.
And that indeed is precisely the point we are making. The FOMC is assuming that the long-run equilibrium real rate is a number around 1.5-2.0, so that their forecast for the fed funds rate of 3.5 is consistent with an inflation rate around 2. We on the other hand say the real rate could end up stabilizing around 0.5, in which case the FOMC is way overestimating how much it will need to raise nominal rates. Our point is that, given this uncertainty about how far they’re going to have to raise the nominal rate, it may pay to wait to start raising until we have a better read on the economy.
Thank you very much for your reply.
Professor Hamilton,
With a long-term real rate of about 0.5, what is the implication for equity risk premium? Has the historical risk premium been a lot higher than it was thought to be?
AS: There are long-standing puzzles in finance as to both why historical average stock returns are so high and why historical average risk-free rates are so low. On the latter question I think one promising explanation is that Tbills offer liquidity benefits in addition to being a store of value, as in Bansal and Coleman, JPE, 1996. Remember also that we are not claiming that the real rate will be constant at 0.5; rather, that is the value to which our forecast settles down. Given the unit root in this process, our prediction is that the risk-free real rate will continue to change over time. The forecast converges to a fixed point, but the confidence intervals around that forecast continue to widen as the horizon expands.
Professor Hamilton
I have a question on the table showing the real rate at the point of full employment (i.e. when actualGDP=potential).
In the 70s and in the 2001-2007 expansion the real rate seems to be quite low , but in the 80s and 90s it seems quite bit higher.
Doesn’t this imply some notion of neutral interest rate?
In the 70s (and possibly in the 2000s) there was a monetary policy error that caused inflation, and in the 80s and 90s there was deliberately tight monetary policy. The fact that monetary policy and the real rate deviated from some notion of neutral level did have a subsequent impact, therefore validating the idea that in equilibrium the real rate should be related to some other fundamental measure ( lets call it equilibrium growth )?
I don’t understand your apparent prior that the real rate and the growth rate should be positively correlated (sorry, haven’t read the paper yet). The negative correlation makes sense in a capital-constrained growth model. Lower real rates imply higher investment and capital accumulation. Your charts are more or less IS curves in my interpretation.
Jim,
What do you think of David Beckworth’s explanation?. He says you should subtract both expected inflation and a term premium to calculated the real rate, the premium he uses is found in Adrian, Crump and Moench. When he does that, the resulting real rate is strongly procyclical.
Jeff Hallman: We’re not claiming that output and real rates are uncorrelated. Instead we’re looking at the correlation between long-term averages of each variable over an entire expansion, decade, or several decades.
Yes, but Beckworth also maintains that the risk premium itself has been trending down since the 1980’s, so much so that the real interest rate is not any lower now than you would expect given where we are in the business cycle. In other words, he thinks that once you account for the declining risk premium over time, there is no evidence of secular stagnation coming from the real rate.
Jeff Hallman: Every interest rate plotted above refers to the fed funds rate, not the yield on a 10-year Treasury. The risk premium you are talking about refers to a 10-year Treasury but not to the concept we are discussing. Your comment is relevant as an alternative answer to the question posed in the opening sentence of the post, but would not alter any of the calculations described here.
Interesting paper. It’s a nice complement to Mervyn King’s recent paper on trends in the global real interest rate.
Your paper only looked at interest rates over the last 200 years. For an even longer perspective I would note that real interest rates in the high middle ages (prior to the Plague and Hundred Years War) were in the 12%-20% range based on the implied interest rate from granary records (e.g., McCloskey, Fenoltea, et al). Back in my student days I found similar implied interest rates based on monastic vineyard production records. So there is no doubt a lot to your observation that increasing life expectancies could explain some of the change in the inter-temporal substitution. And as developing countries start to see longer life spans, we could see a continuing problem with a global glut of savings.
I’m an agnostic on the “secular stagnation” argument, but there were a few things about your arguments against it that I didn’t find entirely convincing. For example, footnote 13 at the bottom of page 24 argues that there was fiscal tightening between 2004 and 2007, yet GDP grew. That’s all true, but I think Summers’ point was that even a deficit of 4.7% of potential GDP is way too much given that the economy was at its cyclical peak. It should have been in surplus. Summers’ argument about secular stagnation is not that the economy cannot generate enough aggregate demand, but that the private sector on its own cannot generate enough aggregate demand. The fact that the government was running a fiscally tighter deficit of 4.7% of GDP at the cyclical peak does not undercut Summers’ main point. Indeed, I heard Summers say that the economy should have been overheating given all of the monetary and fiscal stimulus that was being pumped into it in the mid-2000s. In order to refute Summers’ point with respect to the post-2000 world, I think you have to demonstrate that the economy was overheating, not just that the economy was near or slightly above potential. OTOH, your arguments regarding the 1980s and 1990s are convincing.
In your paper you modeled the interest rate risk as an ARCH(2) specification. This kind of surprised me because I would have thought that a more natural way to model conditional volatility of interest rates would have been asymmetrically…e.g., as an EGARCH specification. If you think that volatility above a threshold is more likely than volatility below a threshold (and this seems at least intuitively plausible), then wouldn’t you want to model the risk asymmetrically?
Finally, do you think that one of the results of your paper might be to increase the risk premium that investors should demand on “safe” assets? One of the things that I took away from your paper was that future interest rates are a helluva lot harder to predict than investors seem to believe.