The BLS reported on Friday that the U.S. unemployment rate was down to 5% in October and November, its lowest level since 2008.
The dramatic surge in unemployment during the Great Recession and its stubborn persistence in coming back down were both dominated by a tremendous increase in the number of people who spent longer than six months looking for a job. If we only counted individuals searching for six months or less, the unemployment rate today would be 3.7%, near the lowest levels for that measure over the last half century.
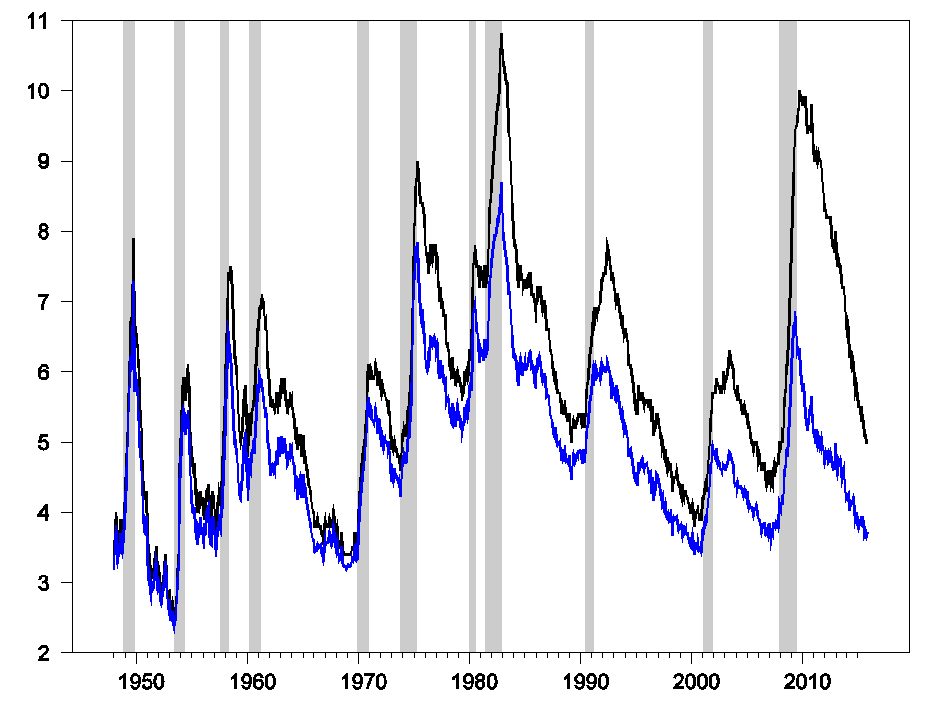
Figure 1. Seasonally adjusted number of people unemployed as a percent of the labor force (or the usual unemployment rate, in black) and number of people who were unemployed for 6 months or less as a percent of the labor force (blue). Latter calculated by multiplying unemployment rate by one minus the fraction unemployed for 27 weeks or longer.
One of the best predictors of whether an individual who is unemployed today will still be unemployed next month is how long that individual has already been looking for a job. For most of the last 50 years, if you considered an individual who has only been looking for work for one month, more likely than not you would find that individual was no longer unemployed the following month. But in every year of the sample, if you looked at an individual who had already been looking for work for longer than six months, there would be a better than an 80% chance that individual would still be unemployed the following month.
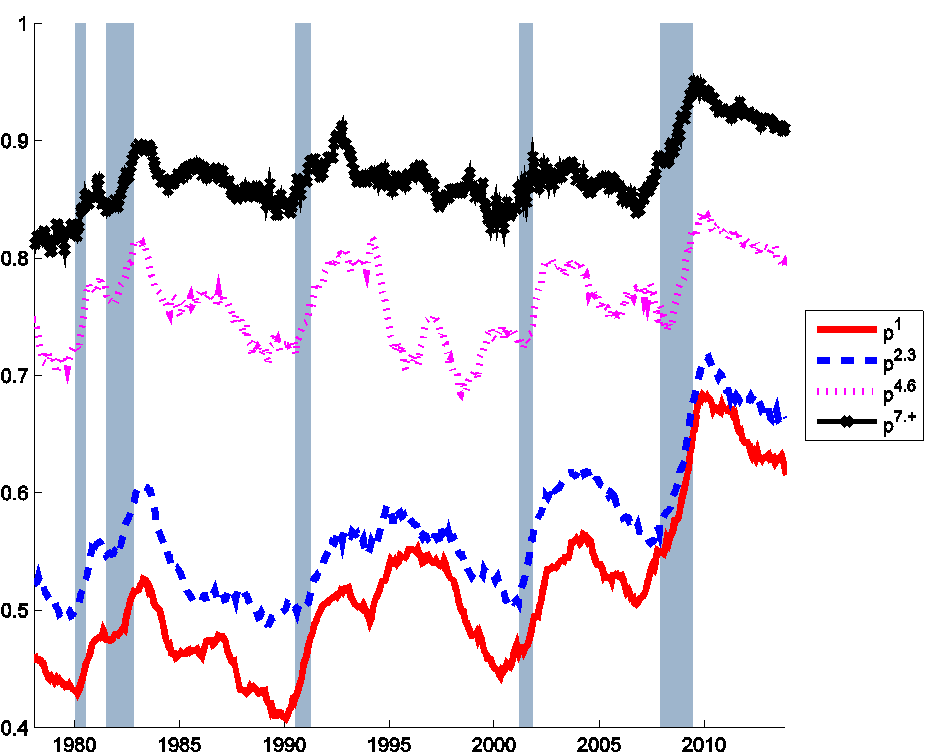
Figure 2. Probability that an unemployed individual will still be unemployed the following month for different durations of job search, Jan 1976 to Dec 2013. Red: individuals who have been unemployed for less than 1 month as of the indicated month; blue: unemployed for 2-3 months; fuchsia: 4-6 months; black: longer than 6 months. Calculated as described in foonote 1 in Ahn and Hamilton (2015).
One possibility is that the process of being unemployed for longer than a month actually changes an individual through some kind of scarring effect. For example, employers may start to discriminate against those who have been out of work for longer. Another possibility is that there are important differences across individuals that began in their very first month without a job, with some people having less favorable skills and opportunities. If you follow those individuals over time, the ones who are still looking after six months will be selectively drawn from those who had a much lower probability of finding a job from the very beginning.
You can see how this could happen with a simple example. Suppose that in a given group of 100 newly unemployed individuals, 20 of them are “type L”, who have an 85% chance of still being unemployed next month, while the other 80 are “type H”, who only have a 35% chance of remaining unemployed. After one month of searching, 17 of the type L (85% of the original 20) will still be looking for work, compared with 28 of type H (35% of the original 80). Of the people who are still searching after 2 months, 60% (15/25) will be type L, even though they were only 20% of the original 100. After 6 months, 9 of the original 100 may still be looking for work, and they are almost certain all to be type L.
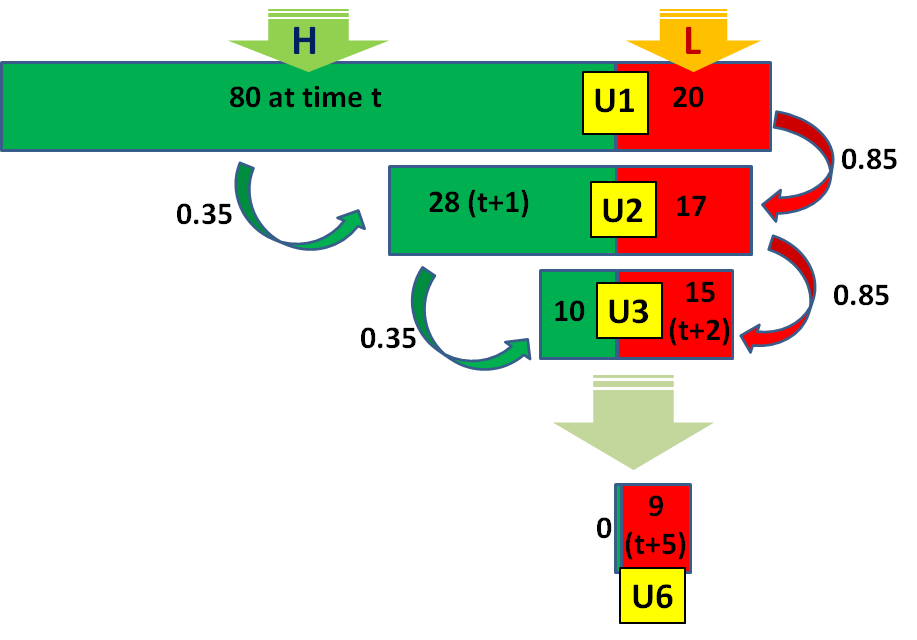
Figure 3.
We can get a quick idea of plausible numbers from the following calculation. Suppose that in an average month there are wL newly unemployed type L individuals and that their average probability of still being unemployed next month is pL (in the above example, pL was assumed to be 0.85). Then the average number of type L individuals who have been looking for work for k months would be wL x pLk-1. The average number of type H individuals who have been looking for work for k months would similarly be wH x pHk-1. If there’s no way to determine an individual’s type from the information recorded in BLS data, then all we would observe would be the total number of people who have been looking for work for k months, which would be the sum of the above two numbers:
Suppose we observe the average number of individuals looking for work at 4 different values of k, represented by the first 4 dots in Figure 4 below. We could then use these four observed values to calculate values for the 4 unknowns wL, pL, wH, and pH. For example, the average number of newly unemployed individuals, U(1) = 3.2 million, must equal the sum of wL + wH, as illustrated in the figure.
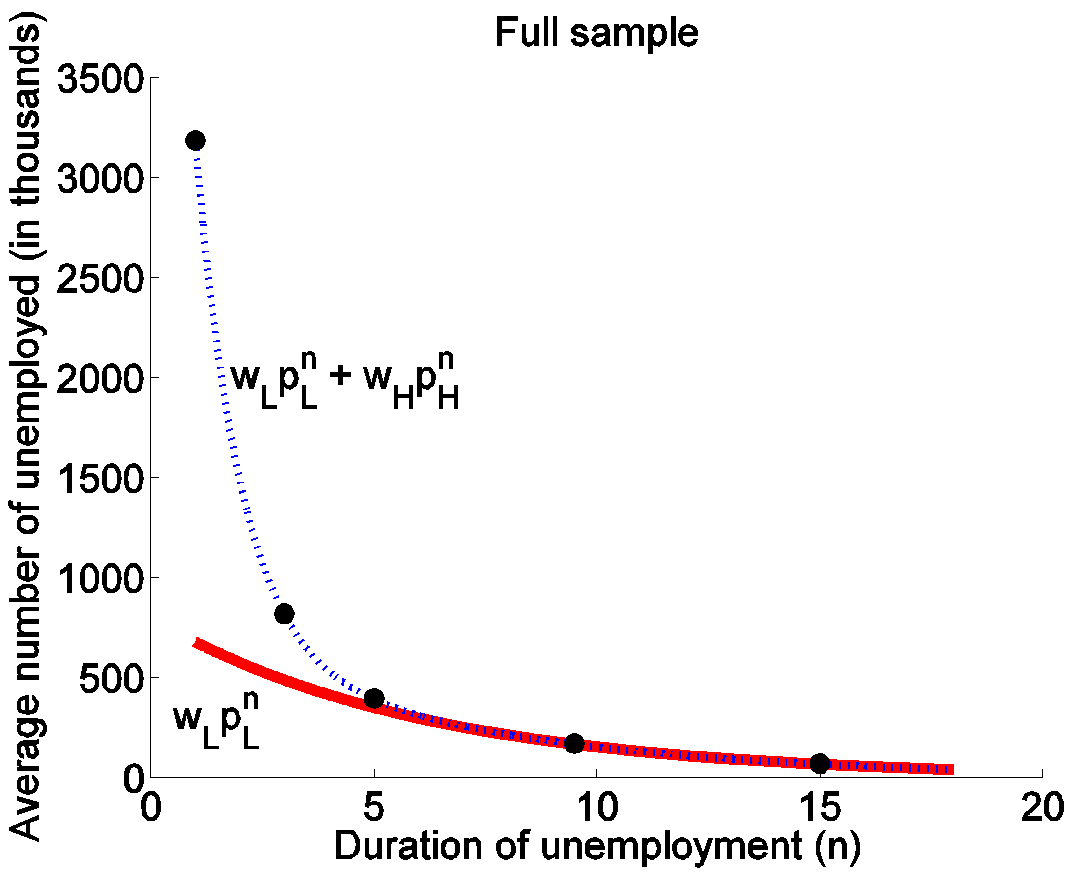
Figure 4. Horizontal axis shows duration of unemployment in months and vertical axis shows number of unemployed for that duration in thousands of individuals. Dots correspond to average observed numbers for selected durations over the period Jan 1976 to Dec 2013. Source: Ahn and Hamilton (2015).
The values for pL and pH that result from this curve-fitting are 0.85 and 0.36, essentially those used in the red-green diagram above. The imputed fraction of type L individuals among the newly unemployed is 21%. The calculation also gives a predicted value for the fifth dot in Figure 4, corresponding to the average number of longer-term unemployed individuals, that turns out to be very close to what we observe in the data.
Now suppose that we were to redo the exercise using only data since December 2007. The result is summarized in Figure 5. The average number of newly unemployed individuals, 3.3 million, is only slightly higher than the historical average. The unemployment-continuation probability for type L individuals is estimated to be 0.89, again only a little higher than that for the historical average. The feature of the data that gives rise to this conclusion is that the average numbers of longer-term unemployed individuals drops off only slightly slower than they did historically. But we’d be forced from this calculation to conclude that many more type L individuals have been losing their jobs since 2007 than had historically been the case. The exercise suggests that while there were 680,000 newly unemployed type L individuals on average each month over the entire sample, since 2007 the inflow has been over a million each month.
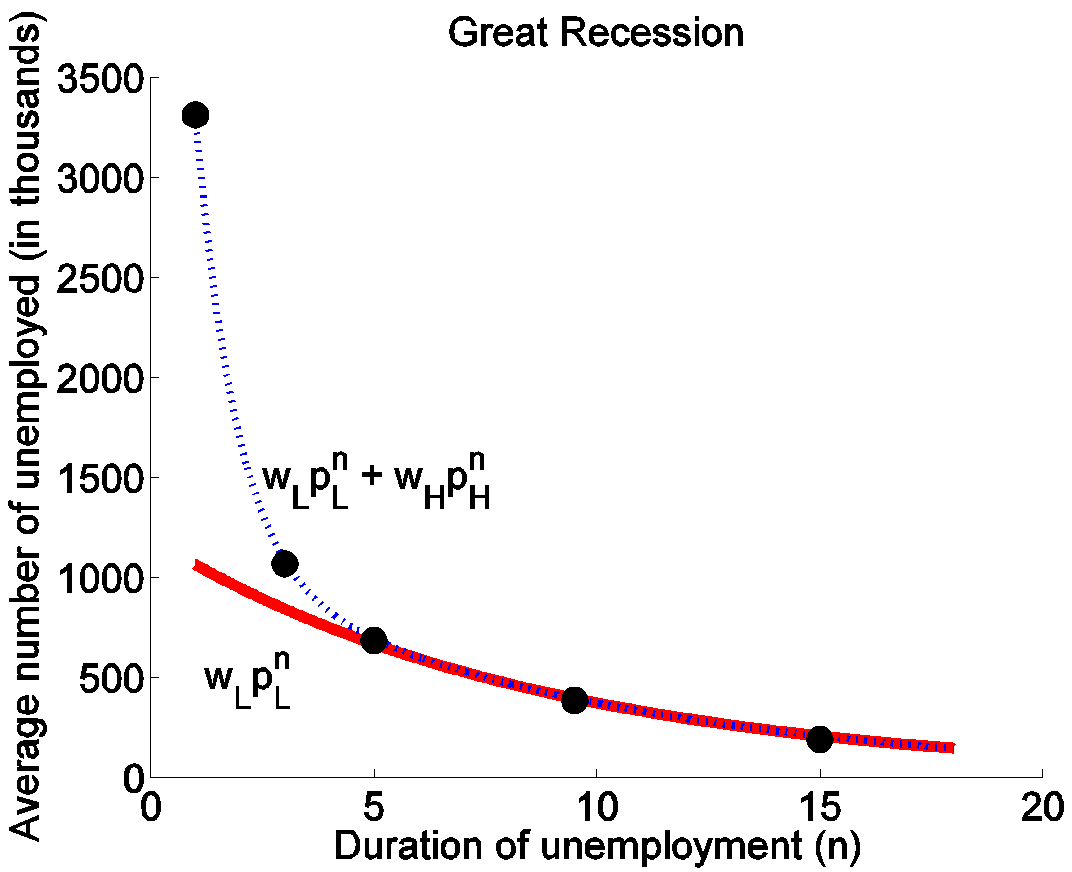
Figure 5. Dots correspond to average observed numbers for selected durations over the period Dec 2007 to Dec 2013. Source: Ahn and Hamilton (2015).
Why might the composition of the pool of newly unemployed have changed during the Great Recession? One reason could be that firms decide which individuals to lay off during a recession based on how they have been performing at the job. More importantly, the skills sought by all employers could change with changing business conditions. For example, an unemployed carpenter might behave like a type H individual during a housing boom, quickly finding another job. But during an economy-wide housing bust, it will be much more difficult for that same person to find a job. Under either explanation, type L individuals would make up a bigger share of the newly unemployed during a recession compared to normal times.
In a recent paper with Hie Joo Ahn, a former student of mine who is now an economist at the Federal Reserve Board, we studied a generalization of the above model in which the magnitudes wLt, pLt, wHt, and pHt could all be changing every month t. In addition we allowed the possibility that there could be a separate scarring or discrimination effect arising from a longer spell of unemployment itself. The resulting inferences for the unemployment-continuation probabilities pLt and pHt are plotted in Figure 6. These average 81% and 34%, respectively, consistent with the quick calculations above. The value of pLt shows a modest tendency to increase during recessions and remain higher after the Great Recession.
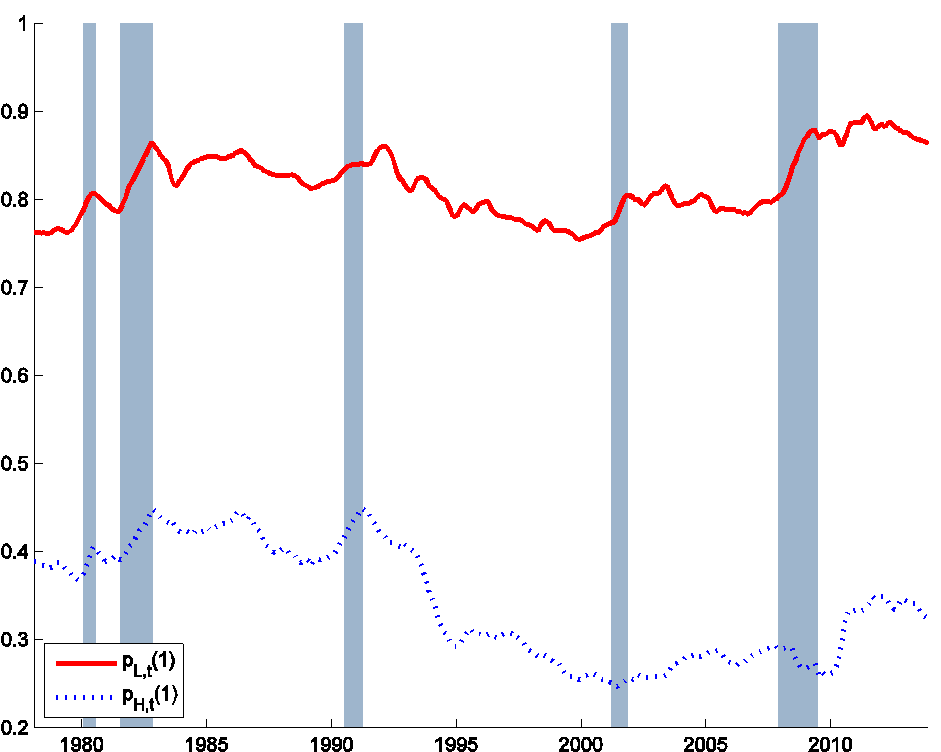
Figure 6. Probability that a newly unemployed individual of each type will still be unemployed the following month. Source: Ahn and Hamilton (2015).
Figure 7 shows our estimates of wLt and wHt, the new inflows into unemployment of each type. Type L individuals represent only 21% of the newly unemployed on average, again consistent with the above quick estimates. There is a big increase in this magnitude during each recession and particularly dramatically so during the Great Recession.
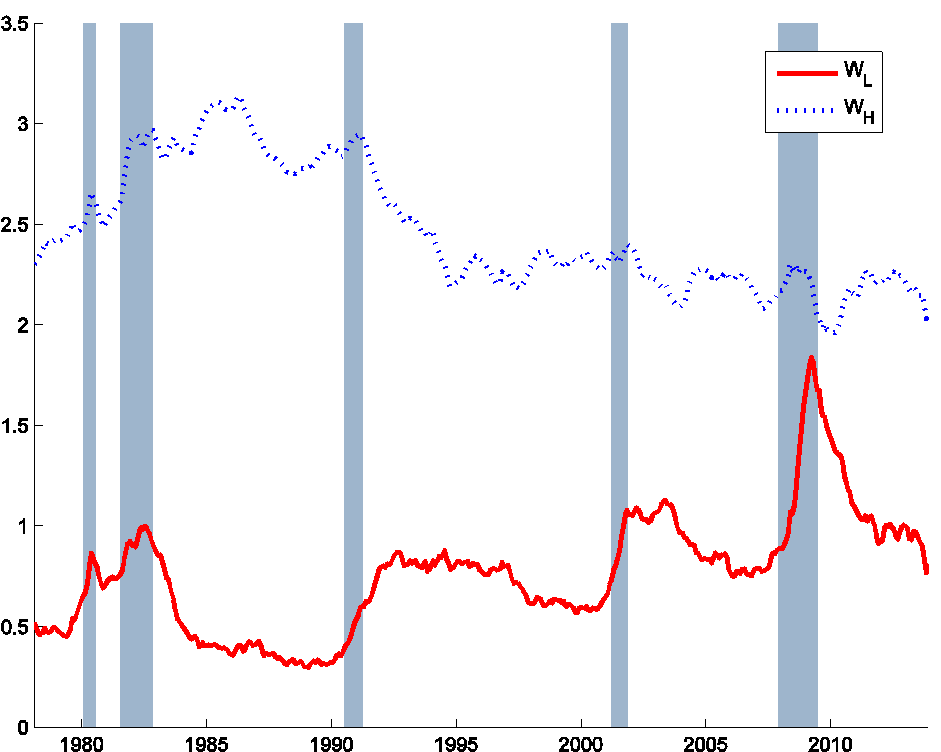
Figure 7. Number of newly unemployed individuals of each type. Source: Ahn and Hamilton (2015).
Could these same patterns instead be explained from the scarring or discrimination effect of being unemployed mentioned above? A recent survey by Krueger, Cramer, and Cho (2014) concluded that it might, pointing for example to experiments by Kroft, Lange, and Notowidigdo (2013) who found that potential employers were less likely to call back on fictitious resumes with longer reported unemployment. But an audit study by Farber, Silverman, and von Wachter (2015) failed to confirm those findings, while Jarosch and Pilossoph (2015) built a model in which effects of the size found by Kroft and coauthors could be almost entirely accounted for by the information that unemployment duration gives about true worker characteristics. Alvarez, Borovickova, and Shimer (2015) found from a dataset following individual Austrian workers over long periods that unobserved characteristics specific to individuals rather than effects of unemployment itself were the key determinant of unemployment durations. In my paper with Hie Joo Ahn we were able to use variation over time in aggregate counts of unemployment by duration to allow for both a quite general scarring effect as well as cyclical variation in unobserved worker characteristics and found that the latter was far more important quantitatively.
Another reason that Krueger and others are skeptical of this possibility is that we do not see significant changes in observable characteristics of the long-term unemployed during recessions. But Ahn (2015) demonstrated that within any group of individuals with the same coarse observable characteristics we find a similar pattern to that in Figures 4 and 7 above. The conclusion is that there are different unobserved types of individuals within every group of people sharing a given observed characteristic.
Even so, there are some important regularities we can document based on observable characteristics. Type L individuals are more common among those who involuntarily lose permanent jobs, and cyclical variation in permanent job losses seems to be a key factor responsible for cyclical variation in wLt. Changes in the composition of the newly unemployed based on whether they were permanently separated and whether they file a claim for unemployment insurance turn out to be strong predictors of subsequent levels of aggregate unemployment over and above the aggregate new inflows into unemployment.
Though it might have seemed like a natural hypothesis, ours is the first paper to document the cyclical importance of this unobserved heterogeneity across individuals. We conclude that this phenomena is absolutely crucial for understanding cyclical fluctuations in unemployment.
Within the skill and opportunity filtering, I would also include motivation to find work.
That’s a great idea. The question is how you measure “motivation to find work” along with skill and opportunity.
It’s got to be correlated with average welfare benefits eligible for.
Not sure how you measure the others. We could probably come up with surveys or observable proxy traits. But I think the basic concept of a population varying in a trait and then selection out of the pool applies for all 3.
From roughly 1950 to 2000, the labor force participation rate (LFPR) of men was falling, while the LFPR of women was rising.
After 2000, both were falling and after 2007, both were falling faster.
Perhaps, the falling LFPR of women after 2000 mostly reflected retirements, including more early retirements after 2007, while the falling LFPR of men is more complex, e.g. disability income from physical work, living longer with their parents, underground income, etc..
“The conclusion is that there are different unobserved types of individuals within every group of people sharing a giving (sic) observed characteristic.” Let me rephrase this to what I think you mean: There are individuals with different unobserved characteristics (like lazy) in each and every group that’s defined by some standard observed characteristic like (age or sex). No surprise about this.
Type L individuals are more common among those who involuntarily lose a permanent job. No surprise here. Similarly then no surprise for the cyclicality of the number of newly unemployed type L workers being directly proportionate to the cyclical variation of permanent job loss.
The ABS (2015) paper your AH (2015) paper references as support for the unobservable characteristics variable seems to capture that variable by a residual. To my view this is tantamount to explaining very little. I saw no other literature support for unobservable other than that of the AH paper.
Our paper differs from any previous study in either the micro or macro labor literature in focusing on aggregate cyclical variation in unobserved heterogeneity. Documenting its importance for unemployment fluctuations and examining the causes behind it is one of the key original contributions of our paper. As best I can tell, the core of what you are getting at is that (abstracting from normal observable variables) the chance of an unemployed worker finding a job is f(duration of unemployment and the unobserved characteristics inherent to that individual). Of course no surprise here either.
Concluding sentence of AH (2015): We conclude that recessions are characterized by a change in the circumstances under which people become unemployed that accounts for the greater difficulty in finding new jobs during a recession. What???
Concluding paragraph of this post (rephrased): Unobserved heterogeneity across individuals is absolutely crucial for understanding cyclical fluctuations in unemployment. … So here’s what I thought when I read this. Suppose we had an exhaustive list of all factors that drove the unemployment rate to its cyclical high last recession. Am I to believe that factors idiosyncratic to individuals that is an otherwise unmeasurable variable (that is something about the individuals other than that they were laid off in housing or finance or other industries going down structurally, were male or female, etc.) somehow makes it into even the top 10 list of explanatory variables, let alone the top 5, of why the unemployment rate soared from 5% to 10%???
JBH: Thanks for your thoughtful comments (and noting the typo now fixed). Our key claim is that we are talking not about a fixed attribute of the individual but rather an interaction between the individual’s skills and overall market conditions. Some people are able to hold jobs in normal times but not when a firm has to let significant numbers go. An unemployed carpenter may be able to find a job quickly during a housing boom but have no luck at all during a housing bust. It is this interaction between cyclical conditions and individual characteristics that we are claiming is the key.
We suggest that the primary factor responsible for rising long-term unemployment during the Great Recession was the huge increase in involuntary permanent separations.
JDH: You’re welcome. Perhaps I can express what I was getting at via a short digression. Richard Feynman was one of the greats. This because his insatiable curiosity was on a quest to understand the deeper causal forces. Take the huge increase in involuntary permanent separations in the current cycle which is pretty much your focus. This, and the concomitant increase in long duration unemployment, would have been surface variables to Feynman, not causal ones. Feynman might have said, “Well OK. Fine about that long duration stuff. But what caused it? Now I’m making this up, but I believe he would have thought along the following lines.
What I’m seeing is a syndrome here: exceptional long duration-unemployment, employment-to-population ratio down precipitously and (even worse) not coming back, full-time employment taking an extraordinary (in fact record long) time to get back to its prior peak, truly remarkable flow of workers out of high-wage jobs into lesser paying ones, etc. Now there are theories and papers galore being written explaining these surface happenings. But might not all these highly unusual happenings be related? We’ve never seen anything like this before. Not even in the Great Depression. And therefore might the papers being written on each narrow exclusionary level topic be missing some far larger important point? In fact, be more of a red herring than anything else in that they divert attention away from some new gravitational force that has entered the system and is really the main causal force acting on each, catalyzing what you see?
The potential interaction you point to has been there since the dawn of time. It was always so and will always be so that some workers are marginal (per their unobservable characteristics). So what’s important here, anyway? Why has this syndrome appeared? This is the real question, the Feynman one.
Jim –
I’d just add that my wife is the director of a newly formed center at Rutgers seeking to assist the long-term unemployed in New Jersey. They are dealing with these issues on a clinical, but not statistical, basis. As such, they have lots of granular data, but no real capacity to work it up in conceptual terms.
If you or another researcher are interested in taking a closer look at the issue (as reflected in a kind of random NJ sample), don’t hesitate to let me know.
Find more on the center here:
http://www.heldrich.rutgers.edu/projects/new-start-career-network
What about longer duration unemployment compensation? Weren’t there several extensions of the duration, last recession?
Surely the more you subsidize something the more you encourage it. [I’m not arguing this is right or wrong, just making the common sense point that payoffs whether social payments, lack of them, tax breaks, or tax increases….affect activity.]
Interesting. We considered genuine duration dependence, that is the experience of being unemployed for a longer period of time directly changes the characteristics of a fixed individual. We found that the more likely it is the person will be unemployed next month the longer they stay unemployed provided that the duration has been 11 months or less. Once someone has been unemployed for more than a year, it becomes more likely as more months accumulate that they will either find a job or exit the labor force in any given months. The non-monotonic behavior of genuine duration dependence is statistically significant, but the overall effect of genuine duration dependence is very SMALL on the aggregate unemployment. We also took into account a simple time variation in the genuine duration dependence depending on the generosity of unemployment insurance benefits, and our result – the importance of HETEROGENEITY – is robust.
Nony,
unemployment compensation is almost always substantially less than the salary you had when employed – for highly employable laid-off workers it is a ridiculously small fraction. I really doubt the meme that unemployed persons choose to remain unemployed because of the easy money (UE benefits).
The UE benefits are typically (at best) 60% of your salary, is capped for large earners (e.g. a Silicon Valley engineer might earn $12k/month when employed, but will max receive $1k/month in UE benefits). The UE benefits are just as taxable as ordinary income.
I do believe that there is a “scarring” effect that best can be described as Dejection. but that’s NOT coming from high UE “subsidies”.
I believe in all factors. Scarring. Progressive concentration of traits by filtering over time. And the effect of xfer payments. Heck even savings. I’ve been unemployed. It’s not a sin. And not that bad in some ways to take a break. Having free money versus being under duress will change be by Avion. That us common sense. Just look how much fiercer a cat mouses when you starve it. Also most of the population isn’t especially highly paid.
Not really, you need to look at the industries the people were laid off in. I would suspect in most recessions a certain group of industries are hit particularly hard and they are typically very cyclical industries. In ’08 a good example would be construction. They were probobly making a lot before the bust because they were working long weeks and made a lot of overtime… so once laid off if they got 50% of that it was a lot, and during the recession there were likely no overtime jobs so they really could make about the same amount as if they got a new job at the time.
For example, right now the oilfield is being hit very hard, and generally people are being laid off from very high paying positions (they make $100k a year with a wage of $15-20/hour). When this happens, their unemployment benefit is actually still about as much or more as they could make at a more stable job with 40/hours per week that they are qualified for. And then you also are not taking into account the large severance packages that are often paid out when big companies perform mass layoffs. People can sit a long time on this. Got to realize that jobs like this are typically the most cyclical and these feast or famine industries are more likely to find people unemployed when the market goes bust.
That’s a valid hypothesis. However, if you take a look at the composition of long-term unemployment by industry or the share of long-term unemployment in each industry, cyclical sectors like construction, mining (including oil) and manufacturing cannot explain the dramatic surge of long-term unemployment during the Great Recession. So, cyclical industry is not the answer.
Nonetheless, your second point that firms often pay large severance package to the laid off workers is very interesting! It is related to JDH’s point that involuntary permanent job loss is an important driver of the dynamics of long-term unemployment.
The surge in construction and manufacturing job losses has to make up the majority of job losses by themselves during the recession. I’m sure there was a trickle down effect with related suppliers, retailers, services, etc that were part of these industries in reality but not in statistical groups. Wholesale, retail, finance, and professional jobs that saw large losses that were generally indirectly or directly related to these industries (apparel, furniture, car parts, civil engineering, etc) and it shows up if you look at the dis-aggregated data.
Most of your IT job losses have been an ongoing trend in the reduction in newspaper/periodicals and also the trend away from wired telecommunication, but it seems like it has happened at about the same time as the recession due to technological change happening quickly around the same time. If you look at IT unemployment duration vs these other categories, it has not recovered like the others. To me this means the IT unemployment duration is probably caused by loss of skill relevance due to a change in technology while construction, manufacturing, etc that were largely the cause of the recession have improved and cyclical factors such as described before prevail. It also doesn’t help that unemployment benefits were extended as long as they were, not a coincidence if you ask me.
A closely-related point is that, at least during the Great Recession, search effort falls over the unemployment spell even after controlling for time-invariant individual effects (see Krueger and Mueller’s 2011 BPEA paper). I’ve found evidence that this declining search effort largely owes to cumulative failures to find work, as measured by the stock of time devoted to search since job loss. This kind of path dependence alone is at least qualitatively consistent with the observed negative duration dependence in exit rates, and, I suspect, is another important piece of the story during the Great Recession.
Your finding is consistent with Faberman and Kulyak (2014).
https://www.richmondfed.org/~/media/richmondfedorg/publications/research/working_papers/2014/pdf/wp14-12.pdf
I am wondering which data you used for your study.
This does seem such a natural logical deduction that it’s surprising no one modeled it before this. You’ve done it in a very clear way, thanks.
Based on my anecdotal experience, the factors I saw most were age and having held a relatively well-paying blue-collar job. The age factor seems to fit your argument very well – 45+ men have a notoriously hard time re-entering the work force, and are a far bigger portion of the laid-off during recessions than outside recessions. Having held a relatively well-paying blue-collar job seems more of a structural issue driven by globalization, where the recession may have merely brought forward job-extinctions that were coming anyway.
Or it could be because high paying blue collar jobs are in very cyclical industries. Construction, mining, oil and gas are all very dependent upon the price of what they are selling.
Another oil post?
Prompt month WTI is now in the 35s. Brent is in the 38s. And HH natgas is in the 1s.
Posted too soon. Brent in the 37s now.