Last week I discussed the tools that the Federal Reserve will be using to raise short-term interest rates as we enter the next phase of U.S. monetary policy. In brief, the Fed plans to use interest on reserves and reverse repurchase agreements as an offer to borrow back Federal Reserve deposits at an annual rate between 25 and 50 basis points (0.25% to 0.50% interest per year). That offer from the Fed puts an effective floor under the fed funds rate, which is the rate at which institutions would lend these funds overnight to other banks. When the Fed raises its offering rate, the fed funds rate should go up with it. Today I look at the implications of these new procedures for the Fed’s balance sheet.
Large banks and certain other financial institutions have accounts with the Federal Reserve known as Federal Reserve deposits. The Fed has the ability to acquire new assets (securities it buys or loans that it makes) simply by crediting the counterparty’s account with the Fed with a new balance. When it does so, the Fed’s assets go up by the value of the securities or loan, and its liabilities go up by the same amount in the form of new Fed deposits.
The graph below records the Federal Reserve’s assets each week since the end of 2002. Up until 2007 these consisted almost entirely of Treasury securities (shown in blue). In response to the financial crisis, the Fed made a series of emergency loans (shown in brown) through facilities such as Term Auction Credit and the Commercial Paper Lending Facility (now no longer used) as well as large loans to foreign central banks in the form of currency swap agreements (in green). These roughly doubled the Fed’s total asset holdings by the end of 2008. As emergency loans were repaid, the Fed opted to maintain and then increase its assets through purchases of new Treasury securities and mortgage-backed securities in three separate phases of what are popularly referred to as “quantitative easing” or QE1, QE2, and QE3. Since the end of 2014 the Fed has kept its assets constant, only buying securities to replace those that mature. The current value of Fed assets is $4.5 trillion, five times as large as it had been near the end of 2007.
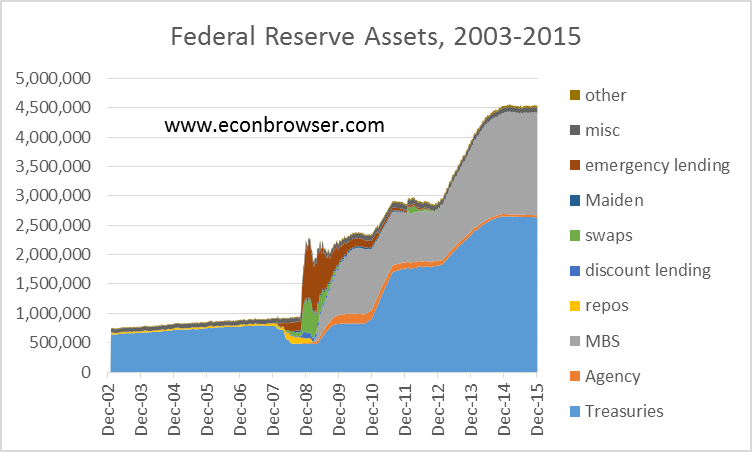
Federal Reserve assets in millions of dollars, Wednesday values, Dec 18, 2002 to Dec 23, 2015. Data source: Federal Reserve Statistical Release H.4.1. Treasuries: Treasury securities held outright plus unamortized premium net discount on all securities; Agency: Federal agency debt securities; MBS: mortgage-backed securities; repos: repurchase agreements; discount lending: primary, secondary and seasonal credit; swaps: central bank liquidity swaps; Maiden: net portfolio holdings of Maiden Lane LLC; misc: sum of float, foreign currency denominated assets, gold, special drawing rights, and Treasury currency outstanding; other: other Federal Reserve assets; emergency lending: Federal Reserve Bank credit minus sum of the preceding.
The graph below displays the Fed liabilities associated with these assets. For every week, the height of the graph below is exactly equal (by definition) to the height of the graph above. Up until 2007, most of the deposits that the Fed created ended up being withdrawn as currency held by the public (shown in blue), and indeed, providing for the gradual increase in currency demand each year was the primary reason that the Fed was slowly adding to its holdings of Treasury securities each year prior to 2007.
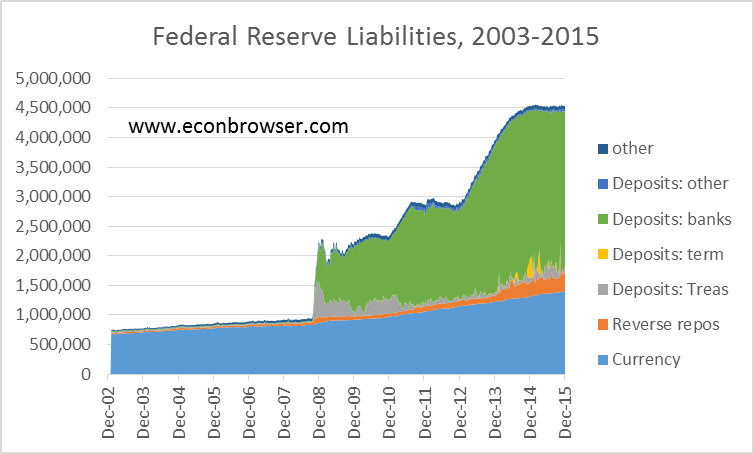
Federal Reserve liabilities in millions of dollars, Wednesday values, Dec 18, 2002 to Dec 23, 2015. Data source: Federal Reserve Statistical Release H.4.1. Currency: currency in circulation; reverse repos: reverse repurchase agreements; term deposits: term deposits held by depository institutions; other deposits: deposits held by foreign official and other nonbank accounts; Treas deposits: deposits held by Treasury plus required reserves, calculated as deposits other than reserve deposits minus previous two items; bank deposits: reserve balances with Federal Reserve Banks; other: Treasury cash holdings plus other Federal Reserve liabilities and capital.
Once the Fed has created new deposits, nothing an individual bank could do apart from withdrawing the deposits as cash would make the deposits disappear. If a bank makes a loan to a customer of another bank, the result of the loan is the deposits just get transferred from the first bank to the second with the total end-of-day Fed deposits of all banks unchanged. But the volume of Fed operations beginning in 2008 far exceeded that needed to meet demand for currency. Initially the Treasury held some of the extra deposits that the Fed was creating in the Treasury’s own account with the Fed, as seen in gray in the figure above. But with interest rates so low and the Fed offering to pay 25 basis points on reserves, banks were quite willing to hold the reserves at the end of each day rather than try to invest or lend out these funds themselves. Banks would make loans or investments during each day, of course, transferring the deposits between banks. But at the end of the day some bank was perfectly willing to hold the deposits overnight rather than try to make one more investment. The result is that most of the new Fed liabilities that have been created since 2008 have simply remained as deposits held on account with the Fed.
As we enter the era when interest rates are no longer stuck at zero, banks could still be persuaded to hold the existing volume of deposits each night by raising the interest rate that the Fed offers to pay on deposits. The Fed also has a couple of other tools that it can use to absorb some of the excess reserves. One is the Term Deposit Facility, through which a bank agrees to maintain a specified level of reserves each night on deposit with the Fed for an extended period. The Fed has conducted a number of operational experiments with this facility over the last several years, and found that banks were willing to commit term funds for a premium of just a few basis points above the interest rate paid on reserves. These operational tests can be seen in the yellow spikes in the graph above. Note that they were always matched by offsetting contractions in the green area (total bank deposits) so that the sum of bank deposits plus term deposits was unaffected. This experience suggests that the Fed can successfully use this tool to lock up deposits for short periods.
A second tool is provided by reverse repurchase agreements, in which the Fed essentially “borrows” the deposits overnight from a depository institution, temporarily delivering an equivalent sum from its securities holdings as collateral. The operation is then reversed the next day, with the Fed getting back its securities, and the counterparty getting back its deposits plus interest. In terms of its balance sheet, the Fed continues to claim the securities as among its assets, but adds the reverse repo as a liability (shown in orange in the second graph). Prior to December 16, reverse repos only paid 5 basis points at an annual rate, and so were primarily of interest only to institutions like the Federal Home Loan Banks that were ineligible to receive the 25 basis points interest on reserves.
Here’s a blown-up graph of Fed liabilities during 2015. The experience with reverse repos, like that of term deposits, was that the Fed can absorb deposits fairly reliably with these operations.
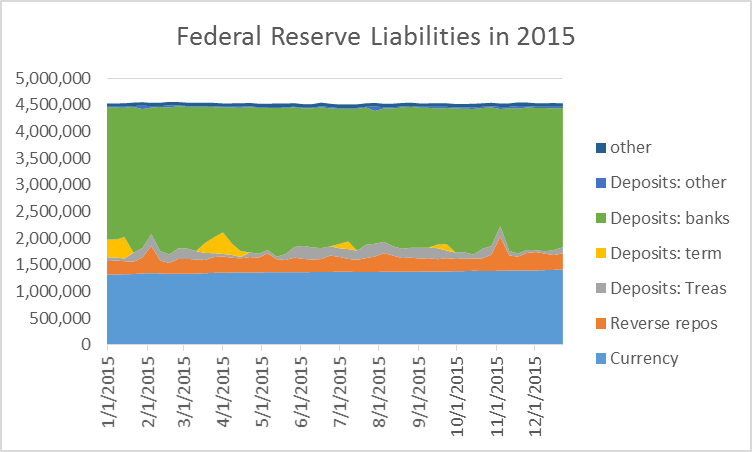
Federal Reserve liabilities in millions of dollars, Wednesday values, Jan 7, 2015 to Dec 23, 2015.
Beginning with the last week on the above graph (Dec 17-23), the reverse repos were no longer being used in test mode and we began the real deal. All the Fed did was announce that the reverse repos would pay 25 basis points instead of the 5 basis points they had been offering in operational experiments. The Fed simultaneously announced that banks could earn 50 basis points instead of 25 basis points on reserves held overnight. Although there was an $83 billion increase in reverse repos observed during this week, the magnitude is not that unusual relative to what we’d been seeing earlier in the year.
Although not much happened in terms of the Fed’s balance sheet this last week, the action in the fed funds rate was exactly as intended. The rate jumped up immediately from 15 bp on Dec 16 and has stayed at 36-37 bp since.
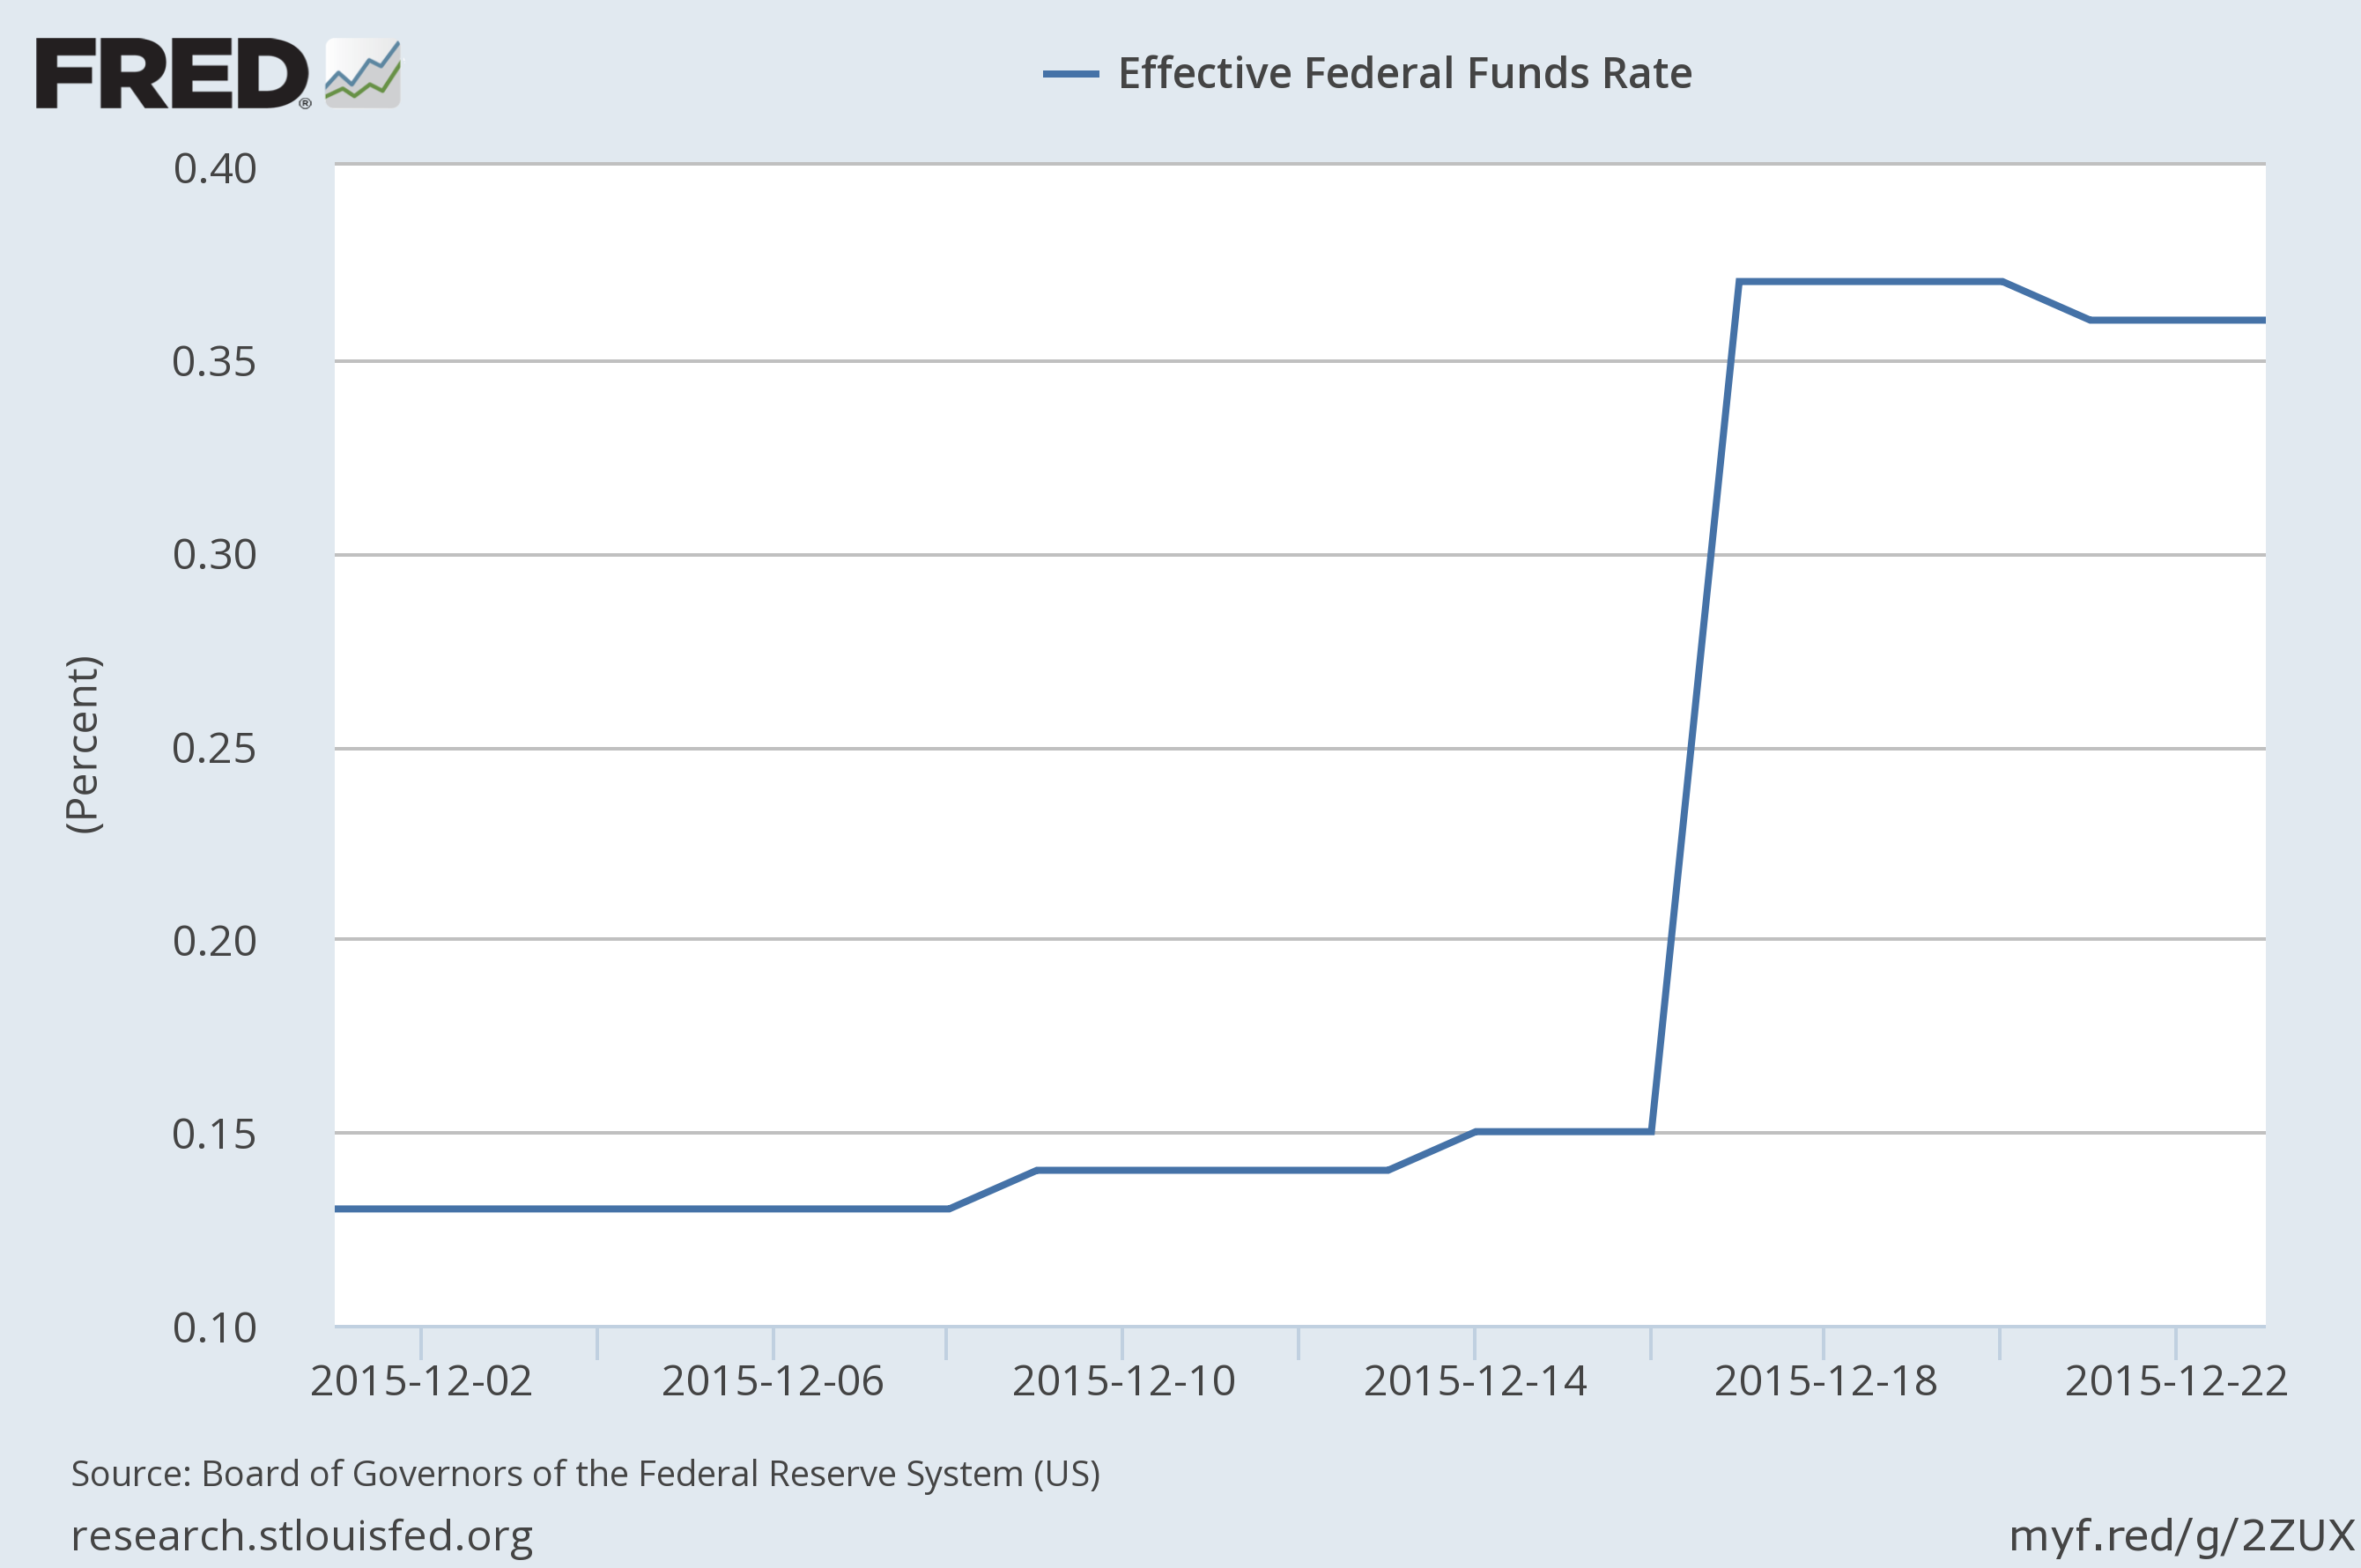
Volume-weighted average rate on brokered fed funds loans, Dec 1 to Dec 23. Source: FRED.
To summarize, although the tools of implementing monetary policy have changed, the fundamentals are as they had been before 2007. Namely, Fed policy is best understood as setting a target for the interest rate rather than in terms of a goal for a monetary aggregate such as the level of reserves or broader M1. The Fed’s primary decision is when to change its interest rate target. For the time being, the Fed has the ability to manage its large balance sheet in a manner consistent with its chosen target.
I think many observers have been surprised that this magnitude is so small:
“Although there was an $83 billion increase in reverse repos observed during this week, the magnitude is not that unusual relative to what we’d been seeing earlier in the year.”
Citibank and other market participants generally estimated between $300 billion and maybe as much as $1 trillion of reverse repos could be needed to put the Fed Funds rate up 25 basis points – in the short run, those estimates have been far off the mark.
This will be interesting to monitor going forward – much less activity on the part of the Fed thus far, but over the past few months, high yield credit spreads have been blowing out to dimensions suggesting some sort of potential liquidity (or pure risk aversion) problem developing in the market place. I suppose the the trend in energy prices are playing an important role in this interaction, since so much of the high yield debt issued the past few years has been energy related credit.
https://research.stlouisfed.org/fred2/series/BAMLH0A3HYC
Anarchus: Just to be clear, the total volume of reverse repos last week was $390 B. But that was only an increase of $83 B over the $307B sold the week before, or an $83 B increase. The $307 B for the week ending Dec 16 paid 5 bp, while the $390 B paid 25 bp. The FHLB and other institutions were willing to lend roughly these amounts at 5 bp the week before, and are also willing to lend these amounts now at 25 bp. No bank would lend reverse repo at 25 bp when they could now get 50 bp from the Fed as interest on reserves.
Good stuff Professor.
I ask if all else is the same, a bank which receive more interest of reserves will, at the margin, reduce the number of loans? If so, this will tend to lead to less economic activity outside the Fed system. As a sign, I would look to continued reduction in commodity prices til a new equilibrium is struck. I would suggest an alternative policy of the Fed. Instead of remitting the profit the Fed generates from its expanded sheet to the Treasury, it simply “burn” it and let interest rates change naturally.
“Once the Fed has created new deposits, nothing an individual bank could do apart from withdrawing the deposits as cash would make the deposits disappear. If a bank makes a loan to a customer of another bank, the result of the loan is the deposits just get transferred from the first bank to the second with the total end-of-day Fed deposits of all banks unchanged.”
Does this suggest (since taking out actual currency is unnecessary for most business transactions) that we cannot read anything about bank-loan-creation or activity from the Fed’s liability composition? Or from the excess reserve plot here https://research.stlouisfed.org/fred2/series/EXCSRESNS ?
SJP: That’s exactly correct, and this is a common misunderstanding.
Right. There’s no impairment to lending when you can make more at the risk-free rate from the Fed than in lending to companies. That’s why the growth in Excess Reserves compared to actual lending since The (start of the) Great Recession Ended is about 1,000:1.
https://research.stlouisfed.org/fred2/graph/?chart_type=line&recession_bars=on&log_scales=&bgcolor=%23e1e9f0&graph_bgcolor=%23ffffff&fo=Open+Sans&ts=12&tts=12&txtcolor=%23444444&show_legend=yes&show_axis_titles=yes&drp=0&cosd=1984-02-01%2C1984-02-01&coed=2015-11-01%2C2015-11-01&height=445&stacking=&range=&mode=fred&id=EXCSRESNS%2CBUSLOANS&transformation=lin%2C&nd=%2C&ost=-99999%2C&oet=99999%2C&lsv=%2C&lev=%2C&scale=left%2C&line_color=%234572a7%2C&line_style=solid%2C&lw=2%2C&mark_type=none&mw=2&mma=0%2C&fml=a%2C&fgst=lin%2C&fgsnd=2007-12-01%2C&fq=Monthly%2C&fam=avg%2C&vintage_date=%2C&revision_date=%2C&width=670
“If a bank makes a loan to a customer of another bank”
Exactly how does that work? It seems to me that if I get a loan from a bank, I am a customer of that bank. I could also be a customer of another bank too.
Get Rid of the Fed: No matter how you trace through the transaction, the final outcome is the same. Let’s say that Bank A makes a loan to one of its own customers. It does this by adding the loaned sum as a credit to the customer’s account with Bank A. So far, this has not brought about any change in Bank A’ deposits with the Fed or any other bank’s deposits with the Fed. Then suppose that the customer buys something with the loan (that’s why she took out a loan in the first place!). The customer will do this by writing a check on her account with Bank A to somebody else who has an account at Bank B. That person deposits the check in Bank B. When the check clears, Bank B’s balance with the Fed gets credited by the sum and Bank A’s balance gets debited. At the end of that day, the sum of all banks’ deposits with the Fed (Bank A plus Bank B) are exactly the same as they were before Bank A made the original loan.
OK. That sounds correct. It also sounds better to see what is actually going on.
“It does this by adding the loaned sum as a credit to the customer’s account with Bank A.”
So demand deposits have increased in the banking system overall because customer A’s checking account balance at Bank A has increased?
“Then suppose that the customer buys something with the loan (that’s why she took out a loan in the first place!).”
And, “The customer will do this by writing a check on her account with Bank A to somebody else who has an account at Bank B. That person deposits the check in Bank B. When the check clears, Bank B’s balance with the Fed gets credited by the sum and Bank A’s balance gets debited. At the end of that day, the sum of all banks’ deposits with the Fed (Bank A plus Bank B) are exactly the same as they were before Bank A made the original loan.”
Let’s assume the customer did not need a loan. The And, “… part is still true, right? Also, I believe the scenario ends up being the same if customer A withdraws currency from Bank A to pay customer B and customer B then deposits the currency in Bank B?
The point is I see three different things going on here:
1) creation of a loan / creation of demand deposits
2) paying for goods/services using checks and/or moving demand deposits between banks if a different bank is involved
3) “borrowing” by banks in the fed funds market
Those 3 things sometimes get co-mingled. I believe that leads to confusion as to what is actually happening.
Thanks for the reply!
“or every week, the height of the graph below is exactly equal (by definition) to the height of the graph above. ” How is that right? MBS, Treasury prices can fluctuate while the liabilities of the FED (money) cannot.
Is there a time series marks to market the value of FED’s assets?
sam weiss: Changes in the unamortized premia or discounts on securities are included in the series I’ve plotted for Treasuries in the assets graph and are matched by a change in imputed Fed capital that is included in the “other” category in the liabilities graph. But in general items are carried at cost rather than mark-to-market. For example, the Fed’s gold (included in my “misc” assets entry) is valued around $42/ounce. If you revalued that you’d have to match it with a surge in the value of Fed capital (an implicit liability).
Hey James. Thanks for the reply. I must not understand accounting b/c that doesn’t make sense to me. If the Fed buys gold at x and now its worth 2x, how do liabilities go up? The amount of reserves – x – remains unchanged.. right? Are there resources you can guide me to that can explain this more clearly?
Thanks in advance
Sam
sam weiss: Gold is an example of an asset that is not marked to market. So as far as that example is concerned, when the price of gold changes from x to 2x there is no reported change in any Fed asset or liability.
By contrast, for securities the Fed does report values for unamortized premia and discounts. The way the accounting works here is the same for the Fed as it would be for a private bank. For any institution (Fed or private company), the institution’s net equity is entered on the liability side of the balance sheet– net equity is defined as assets minus all other liabilities, so when you add net equity to all other liabilities you get a number that is equal to total assets, which is what makes the balance sheet “balance.” If the Fed were to record a loss on securities it had purchased, that would reduce assets by the specified amount, and would reduce net equity by the exact same amount. This is the matching entry on the liability side that makes assets still equal to liabilities after the change.
thanks for clearing that up 🙂
Ed Hanson, your comment assumes a loanable funds bottle on the part of banks. This is an out dated view of how banking works. Banks lend first and fund those loans later, based on market prices and maturity matching. Banks are not reserve constrained. Banks are constrained by capital, which is their ability to assume losses when loans go sour. Furthermore banks make money on the spread between their lending revenues and their funding costs; IORs does not change this revenue and profit dynamic.
Now the easy conclusion is that IOR has disincentivized banks for making loans. I submit that banks have made fewer loans since GFC not bc of messily IOR profit incentives, but bc they were busy repairing their busted and bankrupted balance sheets while toeing a new regulatory line that limited their ability to fund profitably. This is consistent with the idea that banks are constrained in their lending by their capital base and not loanable funds or reserve boundaries.
I have always thought that the balance sheet composition was irrelevant since any interest on bonds is returned to the payor, the US Treasury. In other words, its as if the bonds have been bought and torn up, which is what I learned in school. Different I guess for MBS stuff. Two ways to read this: Monetary base is not debt, or monetary base is debt. Some have looked at this issue I recall. If monetary base is debt, then bonds v. money is irrelevant, and the Fed is irrelevant.
Another weird factor is the failure to mark the Fed’s assets to market. E.g., its gold was last marked to market years ago. There is an artificial price that the Treasury places on the gold certificates held by the fed. This was adjusted once in a while, but not recently.
“Once the Fed has created new deposits, nothing an individual bank could do apart from withdrawing the deposits as cash would make the deposits disappear.”
This is true but an odd way of looking at it. A bank withdrawing banknotes merely changes reserve deposits into vault cash reserves. Total reserves don’t change. Usually what people are concerned with is when bank clients aka the real sector withdraw banknotes, which reduces reserves.
You seem to be referring to the old textbook explanation of how the Fed injects liquidity in the form of excess reserve deposits and banks use up that liquidity by lending. How that model works is that when banks increase lending they increase the real sector’s demand for paper currency, and their required reserves increase according to the regulatory ratio, thus decreasing excess reserves. That model applied fairly well in the US till 2008, when excess reserves were thin. The Fed could fairly reliably expect that the more excess reserves it injected the more banks would lend, because the Fed had set up a system in which banks operated with a relative scarcity of excess reserves. Since 2008 the quantities of excess reserves have been far too large for lending to decrease them to the point of scarcity. Bank lending still decreases excess reserves, but if you mapped that effect on these charts, the relative scale would be close to invisible.
Another comment: while the Fed can certainly raise interbank short rates when it wants, and without draining reserves, the bigger question is how well the Fed can regulate financial conditions for the real sector. I don’t doubt that the Fed could if it wanted tighten enough to change those conditions, even dramatically. But it’s worth noting that the response from private lending and bond markets to the rate rise was minimal. Such measures as Moody’s AAA ten-year and average US mortgage rate didn’t really move. Earlier in the year private sector nominal rates were trending upward with inflation expectations as measured by TIPS, and lately those nominal rates have been range-bound while inflation expectations have kept rising. So the recent trend in private sector real rates seems to be slightly down, actually. Of course the rate hike was expected and priced in, but it’s not easy to see any pricing-in event in the charts.
Tom: Everything has two effects. What follows is a specific case of this principle, which for simplicity I congeal effects of the same sign into each appropriate separate composite. The instantaneous effect of hiking the funds rate is to raise the base and hence the entire level of the yield curve. The other effect is amorphous, expectational, probabilistic, depends on time, and relates to the complex flow of future economic and inflation conditions. The two effects always have opposite signs. Since from precisely early-Nov when Yellen announced the likelihood of a rate hike at the next FOMC meeting, the second effect has swamped the first. When in Dec the hike was in fact actuated, the second effect continued to dominate, though in a dampened way as by then much was already built in. Thus the post-hike reaction of the AAA and mortgage rates, which are intimately tied to the 10-year yield. The second effect is dominating at this juncture (always context is important) because the global economy is slowing with momentum and direction pointing to more of the same until something changes. You will not find this explanation in the textbooks, but this is in fact how interest rate markets work.
One can see it that way, but I don’t – I don’t see the whole term curve much following the federal funds rate. Especially not long yields, and those are overwhelmingly more important than short rates to the private sector’s cost of raising money.
Tom: As you say, the relationship between the curve and the fed funds is not perfect. But I disagree that long rates don’t much follow the short rate. Take the effective fed funds and the 10-year:
https://research.stlouisfed.org/fred2/graph/?chart_type=line&recession_bars=on&log_scales=&bgcolor=%23e1e9f0&graph_bgcolor=%23ffffff&fo=Open+Sans&ts=12&tts=12&txtcolor=%23444444&show_legend=yes&show_axis_titles=yes&drp=0&cosd=1954-07-01%2C1954-07-01&coed=2015-12-01%2C2015-12-01&height=445&stacking=&range=Custom&mode=fred&id=DFF%2CGS10&transformation=lin%2C&nd=%2C&ost=-99999%2C&oet=99999%2C&lsv=%2C&lev=%2C&scale=left%2C&line_color=%234572a7%2C&line_style=solid%2C&lw=2%2C&mark_type=none&mw=2&mma=0%2C&fml=a%2C&fgst=lin%2C&fgsnd=2007-12-01%2C&fq=Monthly%2C&fam=eop%2C&vintage_date=%2C&revision_date=%2C&width=670#
Not perfect, absolutely. But the R2 of 10-year on fed funds is 80%. There’s comovement there.
Since assets = liabilities, when reverse repos increase, the liability isn’t just increased. Another liability decreases (deposits), since assets are unchanged.
JDH,
This post and its preceding accompanying post were both great. Your ability to clearly & succinctly elucidate these topics never fails to amaze me. You’re a true asset in the area of macro-news. As always, thanks.
Dr. Hamilton, several years ago you estimated that the FED could continue to operate profitably at low rates through part of 2017 (I don’t remember if that was before or after QE2, I don’t remember if you did an update after QE3). Could you do another update and maybe add some sensitivity analysis or provide some scenario comparisons–what profits the fed can make and for how long at various interest rates?
And Brent is below $35.
http://www.reuters.com/article/us-global-oil-idUSKBN0UK04C20160106
WTI (and Brent) both dipped into the 32s (prompt month). WTI was below the 2008 low for WTI in the 32s and matched a level last seen in 2003. OPEC basket crude, selling in the 29s (heavier average grade).
http://www.ibtimes.com/falling-oil-crude-production-steady-even-low-prices-slam-drillers-2252562
http://www.rigzone.com/news/oil_gas/a/142374/OPEC_Crude_Oil_Plunges_Below_30_for_First_Time_Since_2004