The Bureau of Economic Analysis announced yesterday that U.S. real GDP grew at a 2.9% annual rate in the second quarter. That’s below the historical average U.S. growth rate of 3.1% per year. Even so, this was the best report in the last two years.
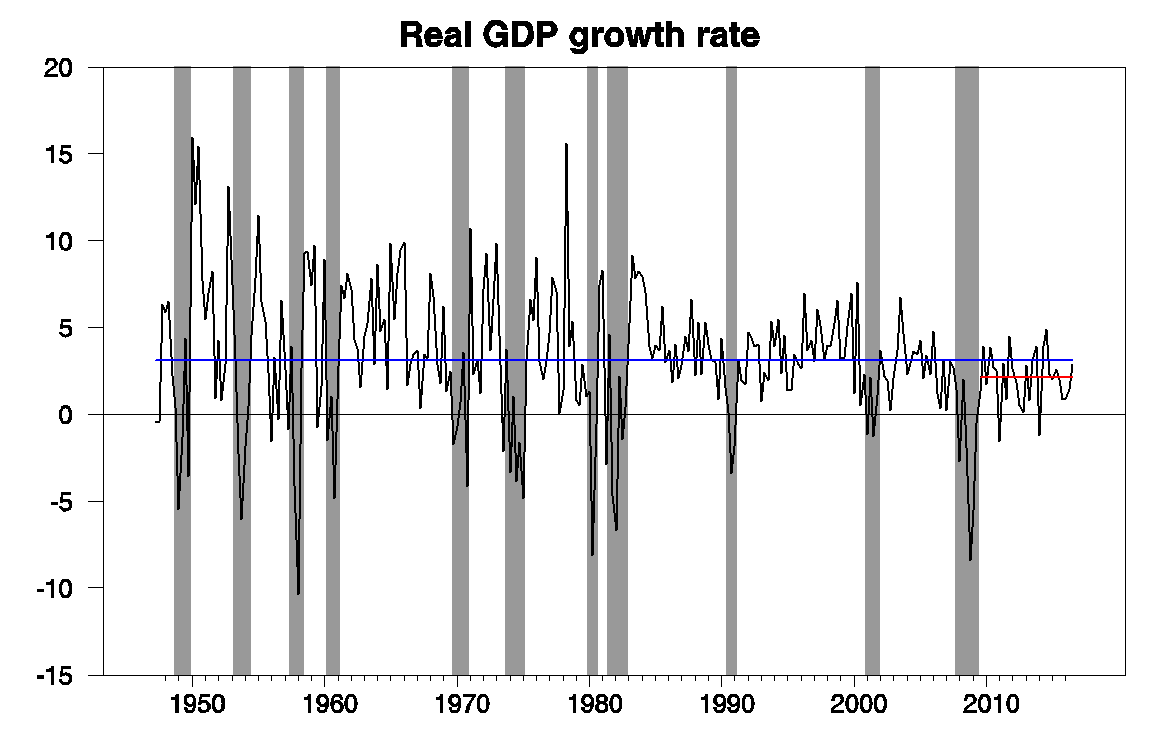
Real GDP growth at an annual rate, 1947:Q2-2016:Q3, with historical average (3.1%) in blue and post-Great-Recession average (2.1%) in red.
The relatively favorable report brought our Econbrowser Recession Indicator Index back down to 12.2%. The index uses yesterday’s release to form a picture of where the economy stood as of the end of 2016:Q2. The index previously had been somewhat higher due to the earlier string of weaker GDP reports.
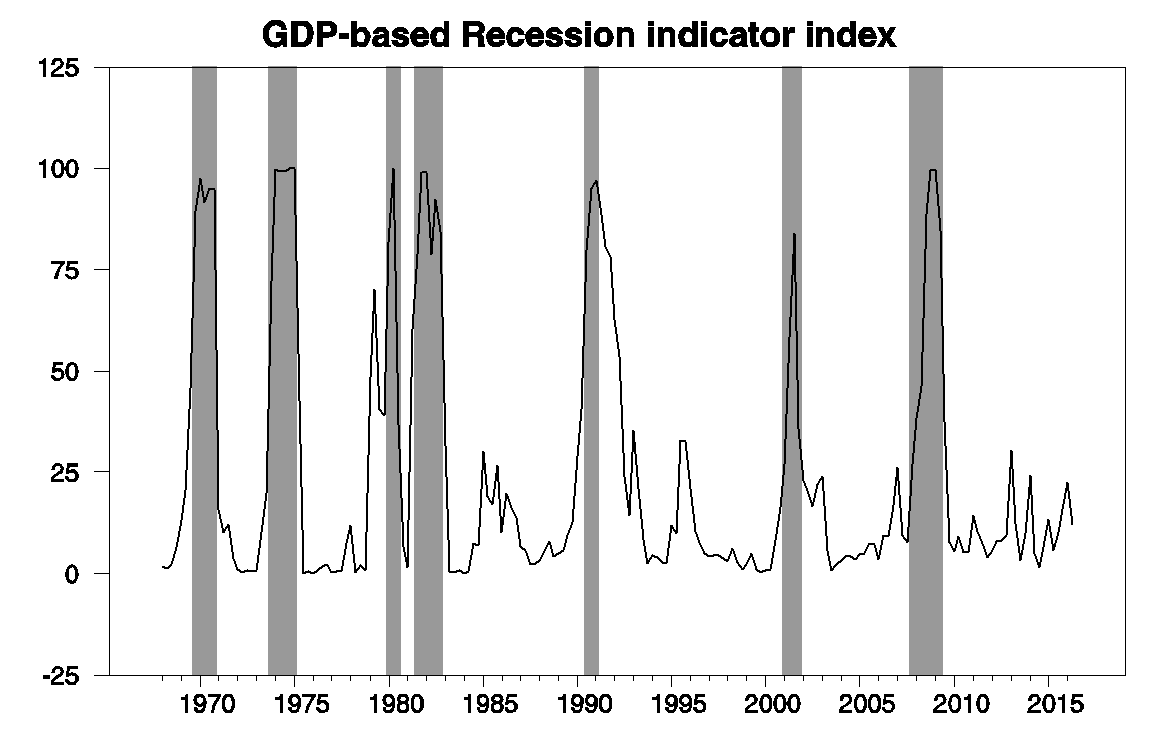
GDP-based recession indicator index. The plotted value for each date is based solely on information as it would have been publicly available and reported as of one quarter after the indicated date, with 2016:Q2 the last date shown on the graph. Shaded regions represent the NBER’s dates for recessions, which dates were not used in any way in constructing the index, and which were sometimes not reported until two years after the date.
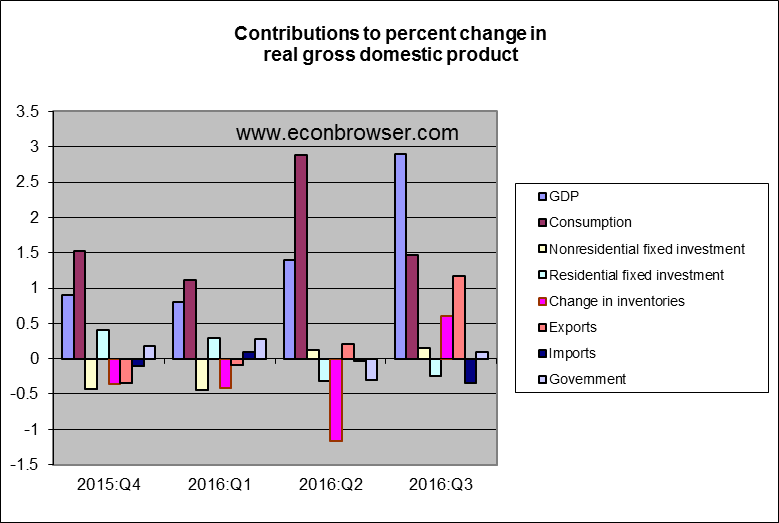
The most important factor in the improvement in GDP growth was real exports. These grew at a 10% annual rate in the third quarter and contributed 1.2 percentage points to the 3.1% total GDP growth. The BEA offered this explanation:
The acceleration in exports was mostly attributable to an acceleration in exports of foods, feeds, and beverages, mainly reflecting an increase in exports of soybeans. This increase in soybean exports was largely offset by decreases in components of nonfarm and farm inventory investment, most notably in merchant wholesale inventories of “farm product raw material.”
The Council of Economic Advisers suggested that U.S. exports in the previous three quarters had been somewhat weaker than was warranted by the observed global economic slowdown, with the Q3 estimate more in line with recent growth rates of our main trading partners.
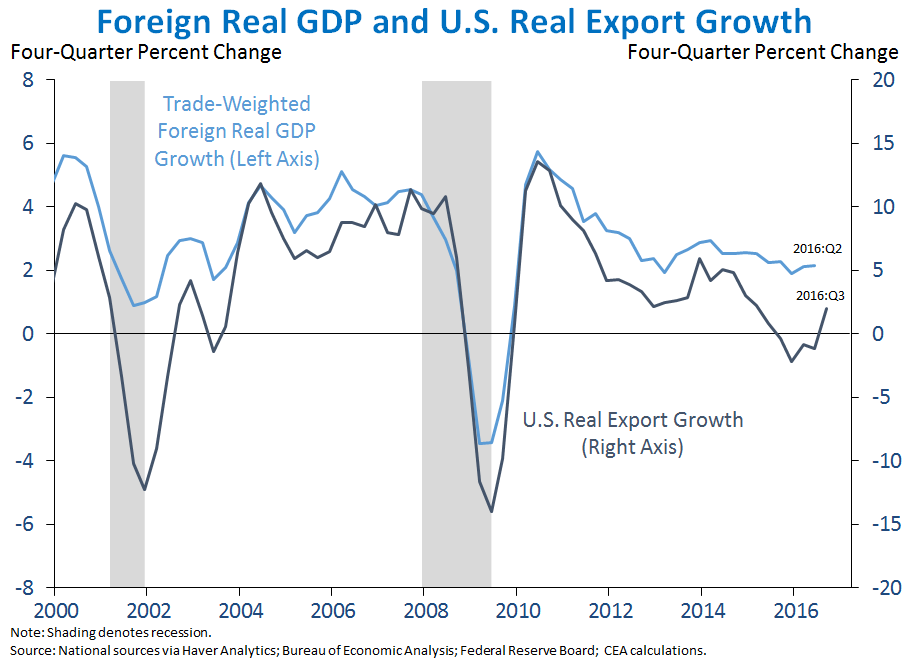
Source: Jason Furman.
The long-run growth rate we should expect for the U.S. economy is now presumably below the 3% historical average as a result of a slower growth rate of the working-age population.

Year-over-year percentage change in U.S. working age population. Source: FRED
I nevertheless believe we should still expect to see a period with U.S. GDP growth above whatever the new long-run trend might be. The graph below plots spending on autos and home construction as a percent of GDP. These indicators are usually above average in an expansion, when GDP is growing faster than trend, and below average when GDP is growing slower than trend. Both have been stuck well below their historical averages ever since the Great Recession. But it would be a mistake to assume they’re going to be stuck there forever.

Contributions to the level of GDP, 1947:Q1 to 2016:Q3. Top panel: nominal spending on motor vehicles and parts as a percentage of nominal GDP. Bottom panel: residential fixed investment as a percentage of nominal GDP. Blue lines represent historical averages. Data source: BEA Table 1.5.5.
Bill McBride argues that we will still see a rebound in housing. And when it comes, nonresidential fixed investment should follow.
Last graph is the key. Housing rebound will come, December rate hike will come. Maybe the name of our next Ronald Reagan will be Donald Trump.
But still I believe it will not be Trump but Clinton’s health- as all media is centralized and coordinated with the same evil spin. The Podesta emails are a most interesting reading matter in this whole damned Internet, this John Podesta was always an invisible guy in the club, but one of the important ones. That he chose his account password as”runner4567″ tells more about him and the Clinton gang, than the whole FBI investigation. Huma Abedin=Monica Lewinsky=white house intern, pretty face and stupid : HRC makes many mistakes, some day it will be one too many.
Remember, the y/y growth rate of real GDP is still just 1.5%.
This GDP report does not change the analysis that the real growth trend is still about 2%.
As a point of clarification, Jim, the Auto Level Share graph I believe refers to “Motor vehicles and parts” per the BEA.
I mention this because auto sales themselves are running ahead of pre-Recession levels, and at or near record rates, see here:
http://www.calculatedriskblog.com/2016/10/us-light-vehicle-sales-increase-to-177.html
On the other hand, heavy truck sales have plummeted, largely due to low oil prices, here:
http://www.calculatedriskblog.com/2016/09/update-us-heavy-truck-sales-slump.html
With oil prices now firmly off cyclical lows and oil rig counts up 120 over the May trough, we would expect heavy vehicle sales to steady and begin a gradual recovery heading into 2017.