A year ago, the Federal Reserve decided to raise its target for the fed funds rate by 25 basis points above the floor of 0-0.25% at which we’d been stuck for 7 years. FOMC members indicated at the time that they were expecting to end 2016 at 1.4%, or four rate hikes during the last year. We started this December at 0.41%, and the first hike of 2016 didn’t come until last week. Now FOMC members say they are expecting to end 2017 at 1.4%, or three more hikes from here during the next year. The January 2018 fed funds futures contract is currently priced at 1.23%, suggesting that the market is buying into two, not three hikes during 2017.
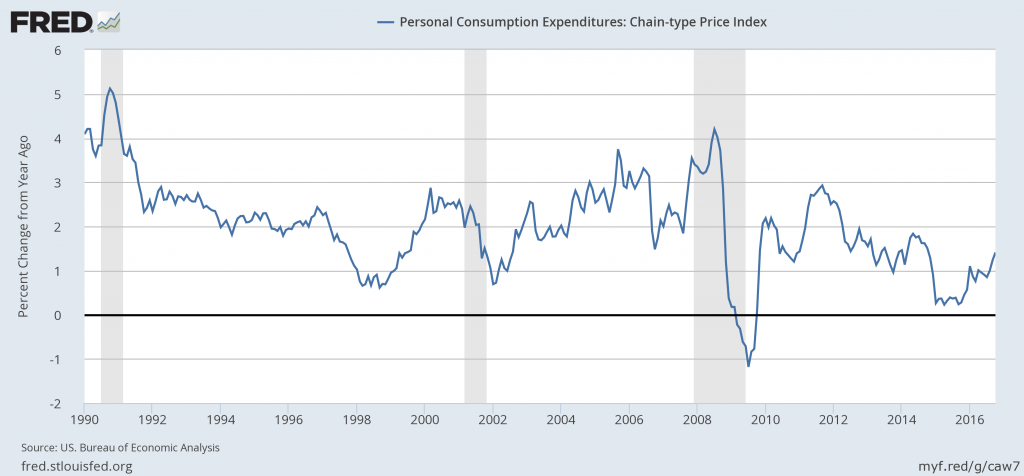
The Fed has a long-run goal of seeing the inflation rate around 2%. In earlier decades, the big challenge was how to keep inflation from rising well above that target. But over the last 8 years, inflation has been coming in persistently below 2%, suggesting the Fed had room to try to stimulate the economy more without having undesirable consequences for inflation. During the last year inflation has been climbing but still remains well below 2%.

Year-over-year percent change in monthly personal consumption expenditures price index, Jan 1990 to Oct 2016. Source: FRED.
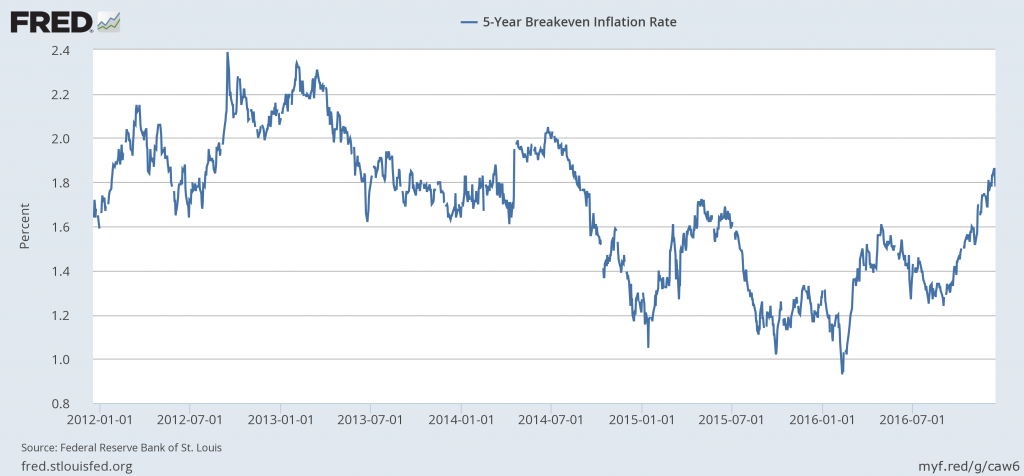
Expectations of future inflation implicit in the price of Treasury Inflation Protected Securities have also been stubbornly below 2%, though these too have moved up over the last year.

Yield on 5-year nominal U.S. Treasury securities minus those on TIPS, daily Dec 17, 2011 to Dec 15, 2016. Source: FRED.
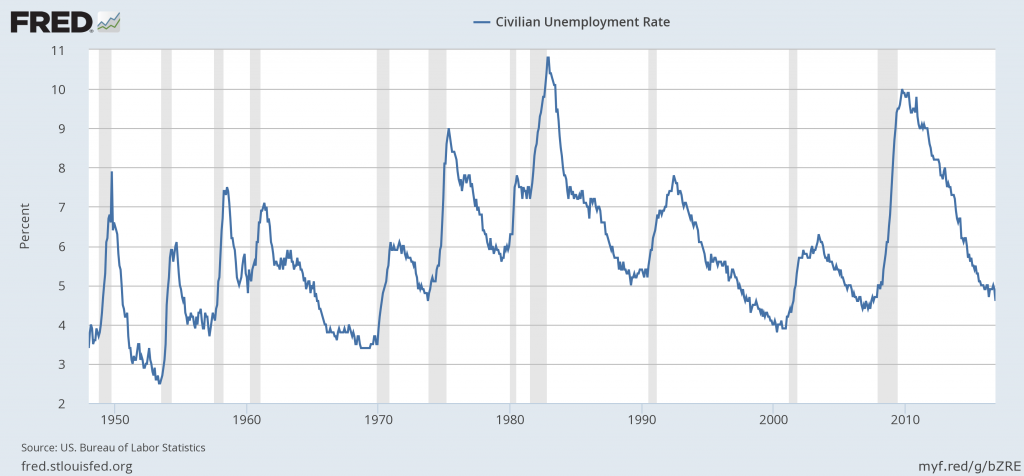
But the big question is whether there is still so much slack in the economy that more stimulus is called for. The unemployment rate fell to 4.6% in November, which brings it below the Congressional Budget Office’s current assessment that the long-run natural unemployment rate for the U.S. is 4.8%. The long period when the Fed looked in frustration at the unemployment rate as something it wanted to bring down may now be over.

Civilian unemployment rate, Jan 1948 to Nov 2016. Source: FRED.
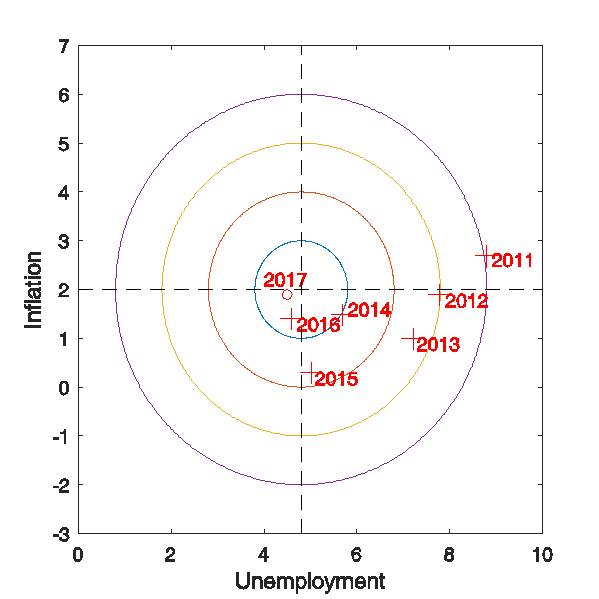
I like the visual device that Federal Reserve Bank of Chicago President Charles Evans proposed, which summarizes the Fed’s inflation and unemployment objectives in terms of a target with a bull’s-eye. I’ve centered the bull’s-eye below assuming a long-run inflation target of 2% and a natural unemployment rate of 4.8%. We’d like to be as close to the center of the target as possible. The U.S. has been moving steadily toward that objective since 2009, though up until the November employment report both the inflation and the unemployment data were arguing for more stimulus. This month for the first time the inflation number calls for more stimulus while the unemployment number suggests we may need less.

Horizontal axis: civilian unemployment rate. Vertical axis: inflation rate as measured by year-over-year percent change in implicit price deflator for personal consumption expenditures. 2017 entry represents FOMC projections. Crosses denote values for October unemployment and October year-over-year inflation for indicated year, with exception that 2016 unemployment number is for Nov 2016 and 2017 projection is for end of year. Adapted from Evans (2014).
If you took the bulls-eye literally, on net you’d still want to see some additional stimulus today, bringing unemployment even lower until inflation is closer to target. And in fact the Fed sees enough underlying strength in the economy that it thinks that, even with the rate hike last week and additional hikes planned for next year, on balance they’re still providing a modest stimulus and expect that by the end of 2017 we’ll end up very close to target:
The stance of monetary policy remains accommodative, thereby supporting some further strengthening in labor market conditions and a return to 2 percent inflation.
Even if the Fed’s assessment of where we’ll be next year is correct, Paul Krugman thinks it may still be too early to start raising rates again:
Right now the economy looks OK, but things may change. Of course they could get better, but they could also get worse– and the costs of weakness are much greater than those of unexpected strength, because we won’t have a good policy response if it happens.
But the elephant in the room is of course the possibility that fiscal stimulus may soon be a factor pushing us in a northwest direction on that target. And that may soon come to play a bigger role in U.S. monetary policy determination.
The bulls-eye chart brings up the story of the three economists on a hunting trip. They see a deer and first economist shoots and misses a yard to the right. The second economist shoots and misses a yard to the left. The third, an econometrist, throws up his hands in the air and cheers “We got ’em!”
Over the last 5 years while real GDP growth averaged 2.1%, the real output of the non-farm business sector averaged 2.6%. The 0.5 percentage point difference reflected the direct impact of the tight fiscal policy imposed on us by Congress. All trump has to do to achieve some 3% to 4% real GDP growth is allow government to grow.
We are switching from a policy combination of tight fiscal policy and easy monetary policy to a combination of easy fiscal policy and tight monetary policy. Under this changed policy combination the last few years probably does not provide a good guide as to what to expect under Trump. He will be implementing a stimulative fiscal policy when the economy is at or near full employment. This will almost certainly force the Fed to implement tighter money policy.
It will have to be a joint decision of the Republican Congress and Trump, and right now, the Republicans want a big tax cut, an increase in Defense spending, but huge cuts in domestic spending, Social Security, Medicaid, and Medicare. The result will be a fall of incomes and therefore marginal spending among the lower 90% of income earners, an increase in 10% and the Government net deficit. The upper 10%, and particularly the upper 1% has a lower marginal propensity spend (and if they spend, the spend on already existing assets like art and real estate). So the Fiscal expansion will be small, if any. But the experience of it, rising inflation and low unemployment, plus more hawks on the Fed Board with Yellen replaced by Gold Bug early in 2018 will mean an acceleration of interest rate increases through the summer of 2018. Given the Austerity and Austrian influence in this administration, I expect they will be slow to reduce interest rates, and will be procyclical in their Fiscal policies (cutting spending as the recession deepens, perhaps curtailing unemployment insurance in order to encourage workers to “stop their vacations and get a job, no matter the pay'”) and try win the 2018 mid-terms by being as white Christian Nationalist as possible in their rhetoric and overt actions, domestic and foreign, leading up to the election.
Nice post. One note — the Fed targets Core PCE, not the headline. The Core happens to have been a bit lower during this period, indicating that there was never a year since the crisis when the Fed has actually hit its target.
Also, while unemployment looks totally fine at the moment, the employment to population ratio for prime-aged adults looks like it still has room for improvement. If one looks instead at RGDP growth, things actually look terrible. Employment is fine but the state of growth is not.
^And I was wrong. The Fed does in fact officially target the overall PCE, even if they typically use the core to gauge the short/medium term inflation trend. (MC sorted me out…)
GDP growth may be slow, because more Americans are working part-time or working at low-paying jobs. Also, it may be easier to secure disability benefits and food stamps. Moreover, generous student loans, grants, and scholarships can keep individuals out of the workforce for many years.
Peak,
I agree with your statement about part-time etc., but if you are suggesting that it is easier today than e.g. 10 years ago to “secure disability benefits and food stamps” and that student (loans) and *grants* are generous, then you should perhaps look again.
Individuals are indeed squeezed out of the workforce ( i.e. labor participation rate is declining), but that has more to do with Automation, outsourcing and stagnant wages than with generous benefits.
It’s interesting how disability applications spiked in the recession, and with a Democrat Congress and a food stamp President (see link):
I think, you can borrow well above $100,000 for college, even for an unmarketable degree. Some public colleges are cheap enough to have the grants pay for the tuition. And, departments and organizations give out scholarships, particularly if you’re a minority or a woman.
https://www.google.com/amp/www.forbes.com/sites/theapothecary/2013/04/08/how-americans-game-the-200-billion-a-year-disability-industrial-complex/?client=safari
Reagan made it easier to qualify for disability benefits. However, it spiked in the last recession and under the Democrat government.
It looks like the increase in disability benefits was more or less the result only from the increase in disability applications in the recession.
Food stamps remain much higher than before the recession:
http://www.trivisonno.com/food-stamps-charts
Although, a strong safety net is appropriate, I suspect, there are many millions of Americans who can work, or work more, but don’t want to or have to, which weakens the safety net and lowers GDP.
I know, in California, there were commercials encouraging people to apply for food stamps, and a seminar, through a law center that assists illegal immigrants, how to secure disability benefits, even with a minor disability.
I’m sure, many people prefer government assistance than a low-paying job with little or no benefits. However, everyone should do their fair share contributing to society – producing goods or services and earning an income. Of course, some people cannot work at all and government should be generous providing for them.
People who really want a job can get one. It may be a low-paying job to start. However, with experience and seniority, it’ll likely pay well after a few years.
About 50% of food stamp recipients have a at least one family member working, but because of low pay they qualify for food stamps. http://www.cbpp.org/research/the-relationship-between-snap-and-work-among-low-income-households
Disability Insurance is a real problem, but in part because interplay of Mr. Market and the Government has given a real incentive for people working jobs with low pay and benefits who suffer from chronic diseases to get on SSI so they can qualify for Medicaid. As the lead NBER paper on the subject states, besides the 1984 liberalization, the second biggest reason for the increase is:
…A second factor is the rising value of DI benefits relative to potential labor market earnings. As the authors explain, this increase is not due to any legislative intent. Rather, the interaction of increasing income inequality and the DI benefit formula means that low-income workers now have a larger share of their pre-disability income replaced at the 90 percent rate and less at the 32 or 15 percent rate. Similarly, there has been a substantial rise in the real value of Medicare received by DI beneficiaries. The authors estimate that the DI replacement rate (including the value of Medicare) for a low-income older male worker rose from 68 percent in 1984 to 86 per-cent in 2004…: http://www.nber.org/bah/fall06/w12436.html Abolishing Obamacare will increase that incentive, not diminish it.
A third factor cited by the paper that discouraged and displaced workers seek SSI benefits, as you suggest. But perhaps that is because they are, as David Simon calls them “surplus people,” a lumpenproletariat that Mr. Market does not need and or want when willing workers exist in China, Vietnam, and Bangladesh who will work for wages that would not obtain shelter or food here in America.
The Obama administration and Pelosi Congress did extend unemployment insurance and expanded food stamps 2009-2010, but that liberalization was reversed under the Ryan Congress (Ryan has been the ruling intellect of the House even when Boehner was the Speaker). They never expanded or liberalized SSI.
I’m sure, there are lots of people collecting food stamps who don’t want to work, don’t want to work full-time, or are willing to work only part of the year.
There may also be a lot of fraud, e.g. thousands of dollars in the bank (e.g. from an inheritance or saving), but little or no income.
peak, some people would consider those in the financial industry collecting social security and medicare in retirement today “fraud”. rather than targeting the poor as committing fraud, you should be more interested in the fraud perpetrated by those financial professionals who continue to collect their government subsidies to this day. the earnings of many of these financial professionals over the past decade should be excluded from their retirement benefit calculations. why should fraudulently obtained mortgage commissions count toward their social security benefits?
Baffling, the vast majority in the financial industry are honest and responsible. The ones who commit crimes should be punished. Obviously, you’re still blaming lenders for the moral hazard created by Congress. Only a political hack, like yourself, would continue to shift blame and not take any responsibility for supporting a policy that led to a massive financial disaster.
peak, only a hack would continue to defend the financial industry and blame the government for the misdeeds of the financial miscreants. peak, you do understand your view is not supported by any of the credible economists in the world today? it is only advocated by a small number, although loud, political economic hacks. the echo chamber you visit so often warps your reality. let me repeat, there are no credible economists in the world today who take your revisionist view of the financial crisis.
Baffling, you forgot to say “So there!” 🙂
peak, just want to reiterate. the position you take with respect to the financial crisis is not one that is generally accepted by credible economists in the field. it is a position taken by hacks and conspiracy theorists, to further their agendas.
Baffling, I’ve shown you lots of evidence what caused the financial crisis. You Just want to accept the reactions or behaviors of the cause to shift blame to an entire industry.
Basically, I’ve shown the moral hazard created by government in the financial industry and then how government facilitated it.
The banks knew it would end badly. However, they were forced to play the game to be competitive in making profits. They were encouraged by Congress and even threatened that they were not making enough minority low-income loans.
Anyway, the banks knew government would bail them out. It turned out to be a giant social program. The Congressman who promoted it believed they were very clever government didn’t have to pay for it.
Also, I may add, the economists who predicted the financial crisis don’t blame the financial industry. Here’s one example:
“In the book, Pettifor blames the US Federal Reserve, politicians and mainstream economists for endorsing a framework to support unsustainably high levels of borrowing and consumption under the guise of propping up the economy. Continuing the theme in her most recent writing, Pettifor attacks the “small elite that controls the global finance sector” and suggests government bailouts protecting speculative private wealth holders mean “we are no longer dealing with anything resembling a free market system.”
peak, you have never been able to demonstrate your position, other than with statements from the hacks i alluded to. but as i have stated repeatedly, why would i expect you to acknowledge the inappropriate behavior of the banking industry? you were an active member of that group. your response is that of a teenager unwilling to own up to their mistakes.
“I think, you can borrow well above $100,000 for college, even for an unmarketable degree.”
the average student debt is about $30,000 at graduation. your number is the exception. state schools have driven up the debt of students by cutting funding to the higher ed system, pushing the cost onto the students through tuition increases. operating costs have not risen at these schools, it is the sources of funding which has changed.
if you really want to fix student debt, one area to clean up is the for profit university fraud that has been perpetrated over the past decade. that is where you get the $100k and no marketable degree outcome. the statistics are decidedly poorer with the for profit cohort of students than the traditional nonprofit cohort of students.
That’s a pretty generous scale for inflation on the bullseye…
Consistent with the Evans graph though
Inflation is low because capacity utilization is low. It is more desirable to increase utilization of capacity as demand increases instead of raise prices. Capacity utilization was much higher when inflation was more probable. And capacity utilization is related to labor share… as labor share has declined over the years, capacity utilization has declined making inflation less and less probable.
The connections here center around profit rates and optimization of capacity in relation to labor share.
It has been a mistake to wait for the whites of the eyes of inflation. It won’t come because capacity utilization is low.
It is called effective demand… but in the end, inflation is not coming, even in the face of low unemployment because labor share is low.