Or, Does Mr. Trump feel lucky?
From EconoFact:
The agriculture sector in the United States depends upon exports for its vitality. Sales of U.S. agricultural products abroad are responsible for 20 percent of U.S. farm income, supporting more than one million American jobs on and off the farm, according to the U.S. Department of Agriculture. The three biggest buyers of American agricultural products are China, Canada, and Mexico. Yet trade with these three countries faces heightened uncertainty. The Trump Administration initiated a process of renegotiating the North American Free Trade Agreement (NAFTA) with Canada and Mexico, which includes the option of exiting the deal altogether. In addition, the United States has started a series of investigations of unfair practices leveled against China, some of which have already resulted in the imposition of new tariffs. These trade policy initiatives threaten agricultural exports both because of the potential increase of tariffs on exports to Canada and Mexico that would result from a withdrawal from NAFTA as well as the very real threat of retaliation in response to other proposed policies.
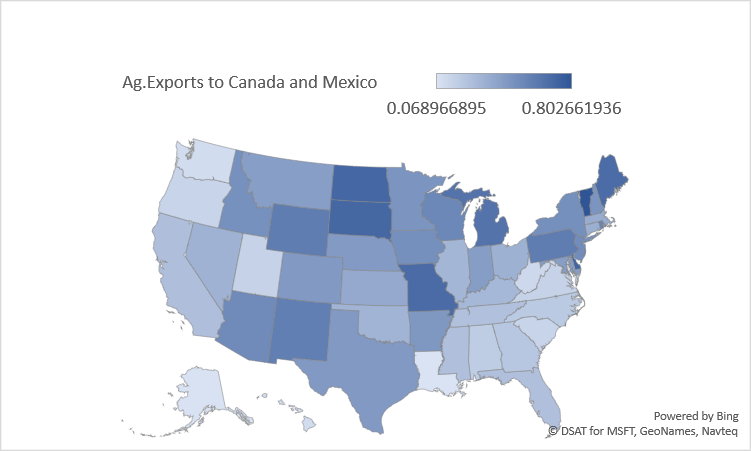
Figure 1: Share of total agricultural exports going to Mexico and Canada, by state. Agricultural exports defined as NAICS 111+112+311 (crops, livestock, and processed food). Source: Census via ITA and author’s calculations.
The entire article is here. More on agricultural sector fortunes here.