The Bureau of Economic Analysis announced today that seasonally adjusted U.S. real GDP grew at a 2% annual rate in the third quarter, slightly below the average growth rate of 2.25% that we saw during the previous economic expansion.
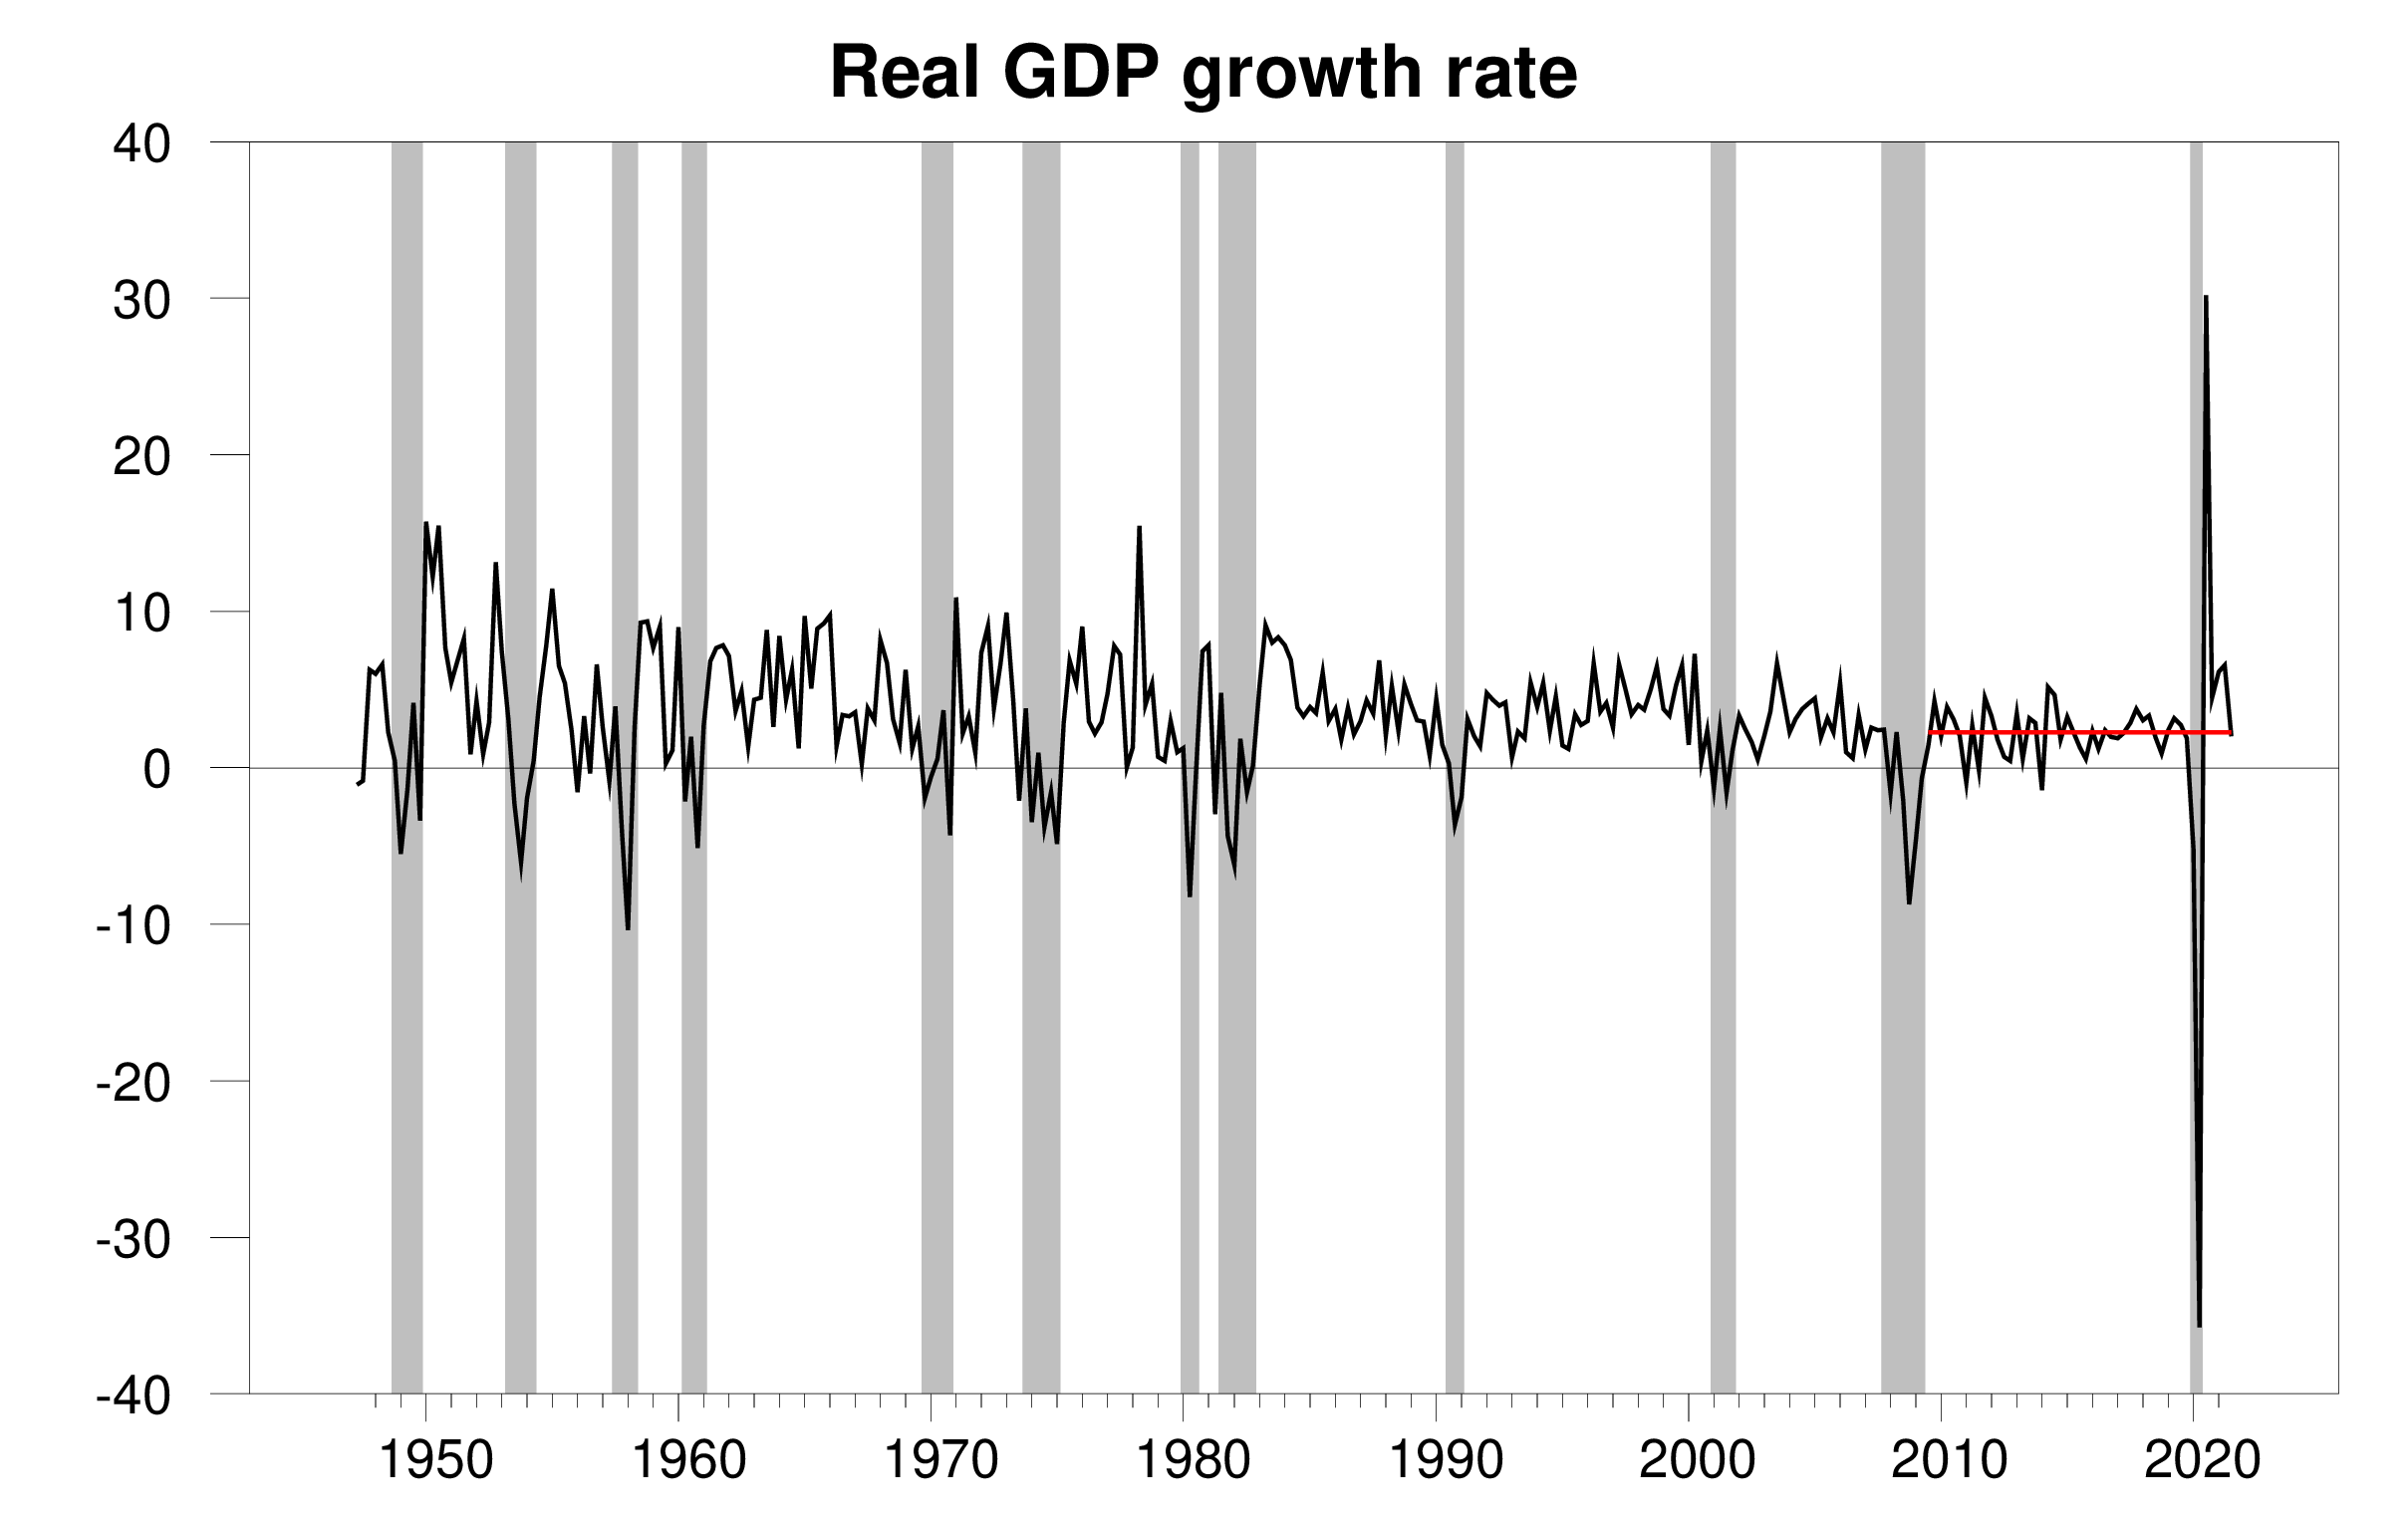
Real GDP growth at an annual rate, 1947:Q2-2021:Q3, with the 2009:3-2019:4 average (2.25%) in red. Calculated as 400 times the difference in the natural log of GDP from the previous quarter.
The new data put the Econbrowser recession indicator index at 0.3%, historically a very low value and signalling an unambiguous continuation of the economic expansion. The number posted today (0.3%) is an assessment of the situation of the economy in the previous quarter (namely 2021:Q2). We use the one-quarter lag to allow for data revisions and to gain better precision. This index provides the basis for an automatic procedure that we have been implementing for 15 years for assigning dates for the first and last quarters of economic recessions. As we announced on January 28, the COVID recession ended in the second quarter of 2020. The NBER Business Cycle Dating Committee subsequently made the same announcement on July 19.
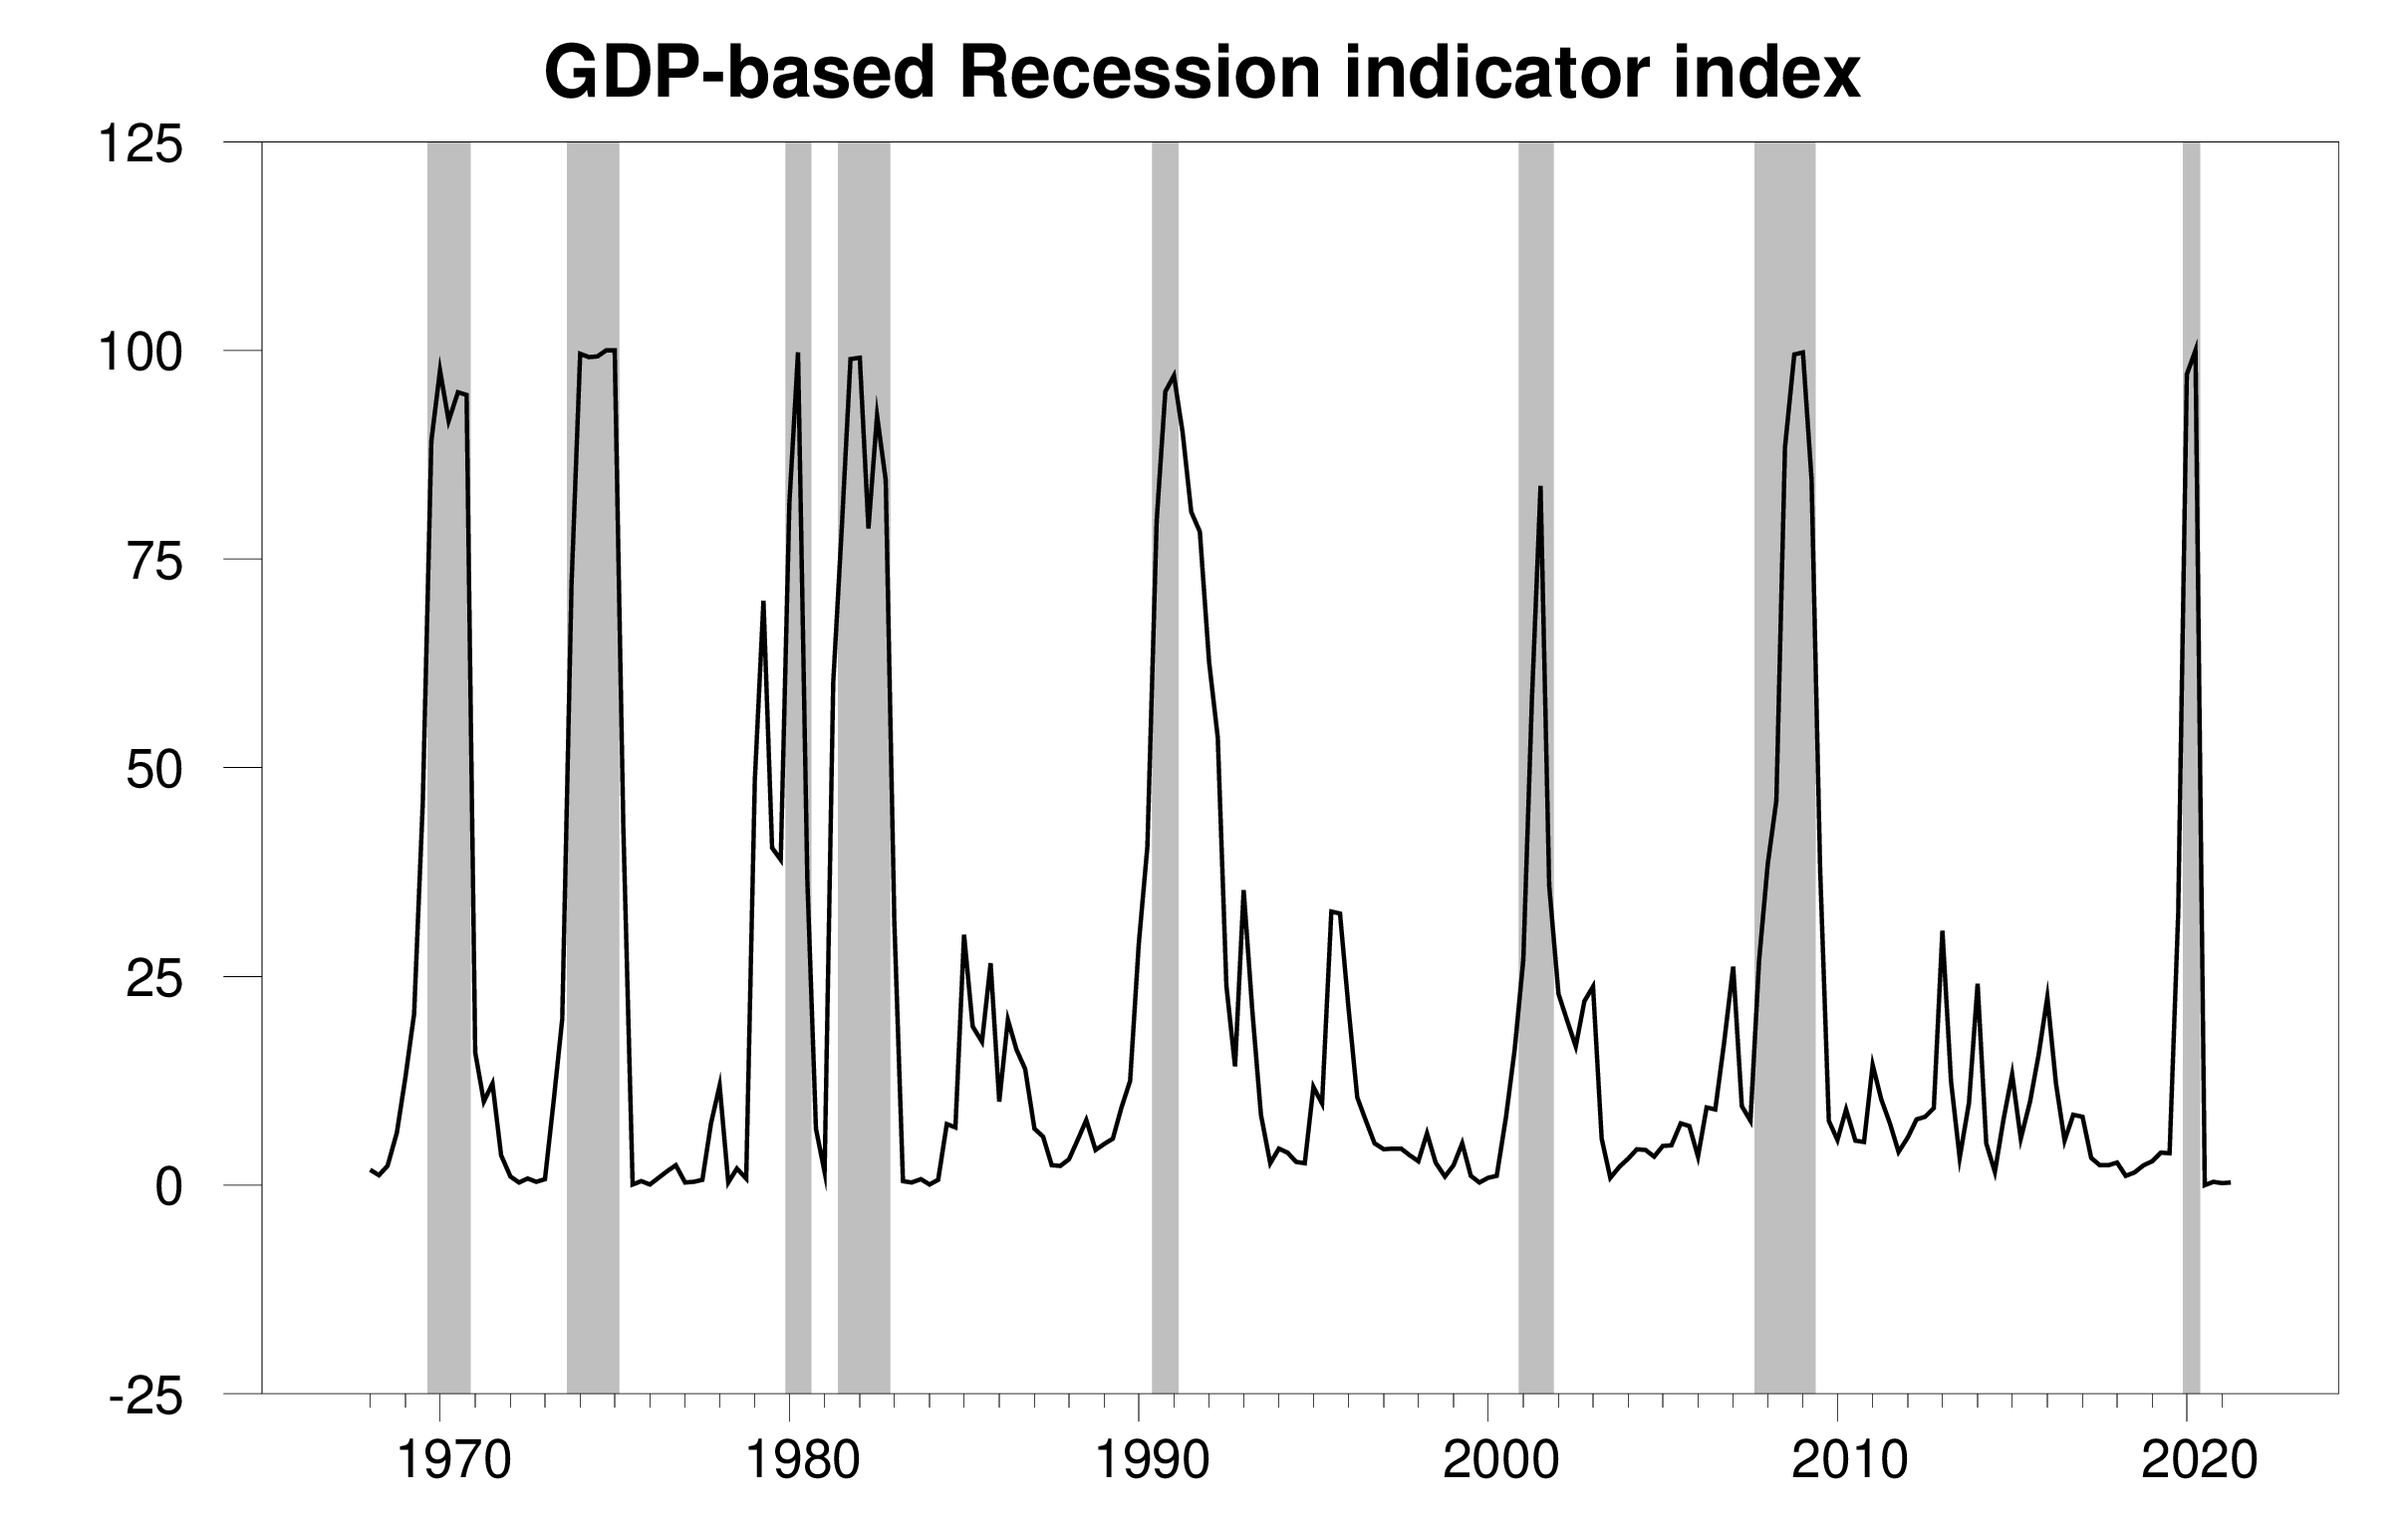
GDP-based recession indicator index. The plotted value for each date is based solely on the GDP numbers that were publicly available as of one quarter after the indicated date, with 2021:Q2 the last date shown on the graph. Shaded regions represent the NBER’s dates for recessions, which dates were not used in any way in constructing the index.
By Q2, the level of GDP had recovered to the value reached in 2019:Q4 before the COVID recession began. But if we hoped to return to the trend line associated with the previous expansion (shown in red in the graph below), we’d need to see growth for Q3 of over 4%, not 2%, and we’d have to maintain that pace for a full year.
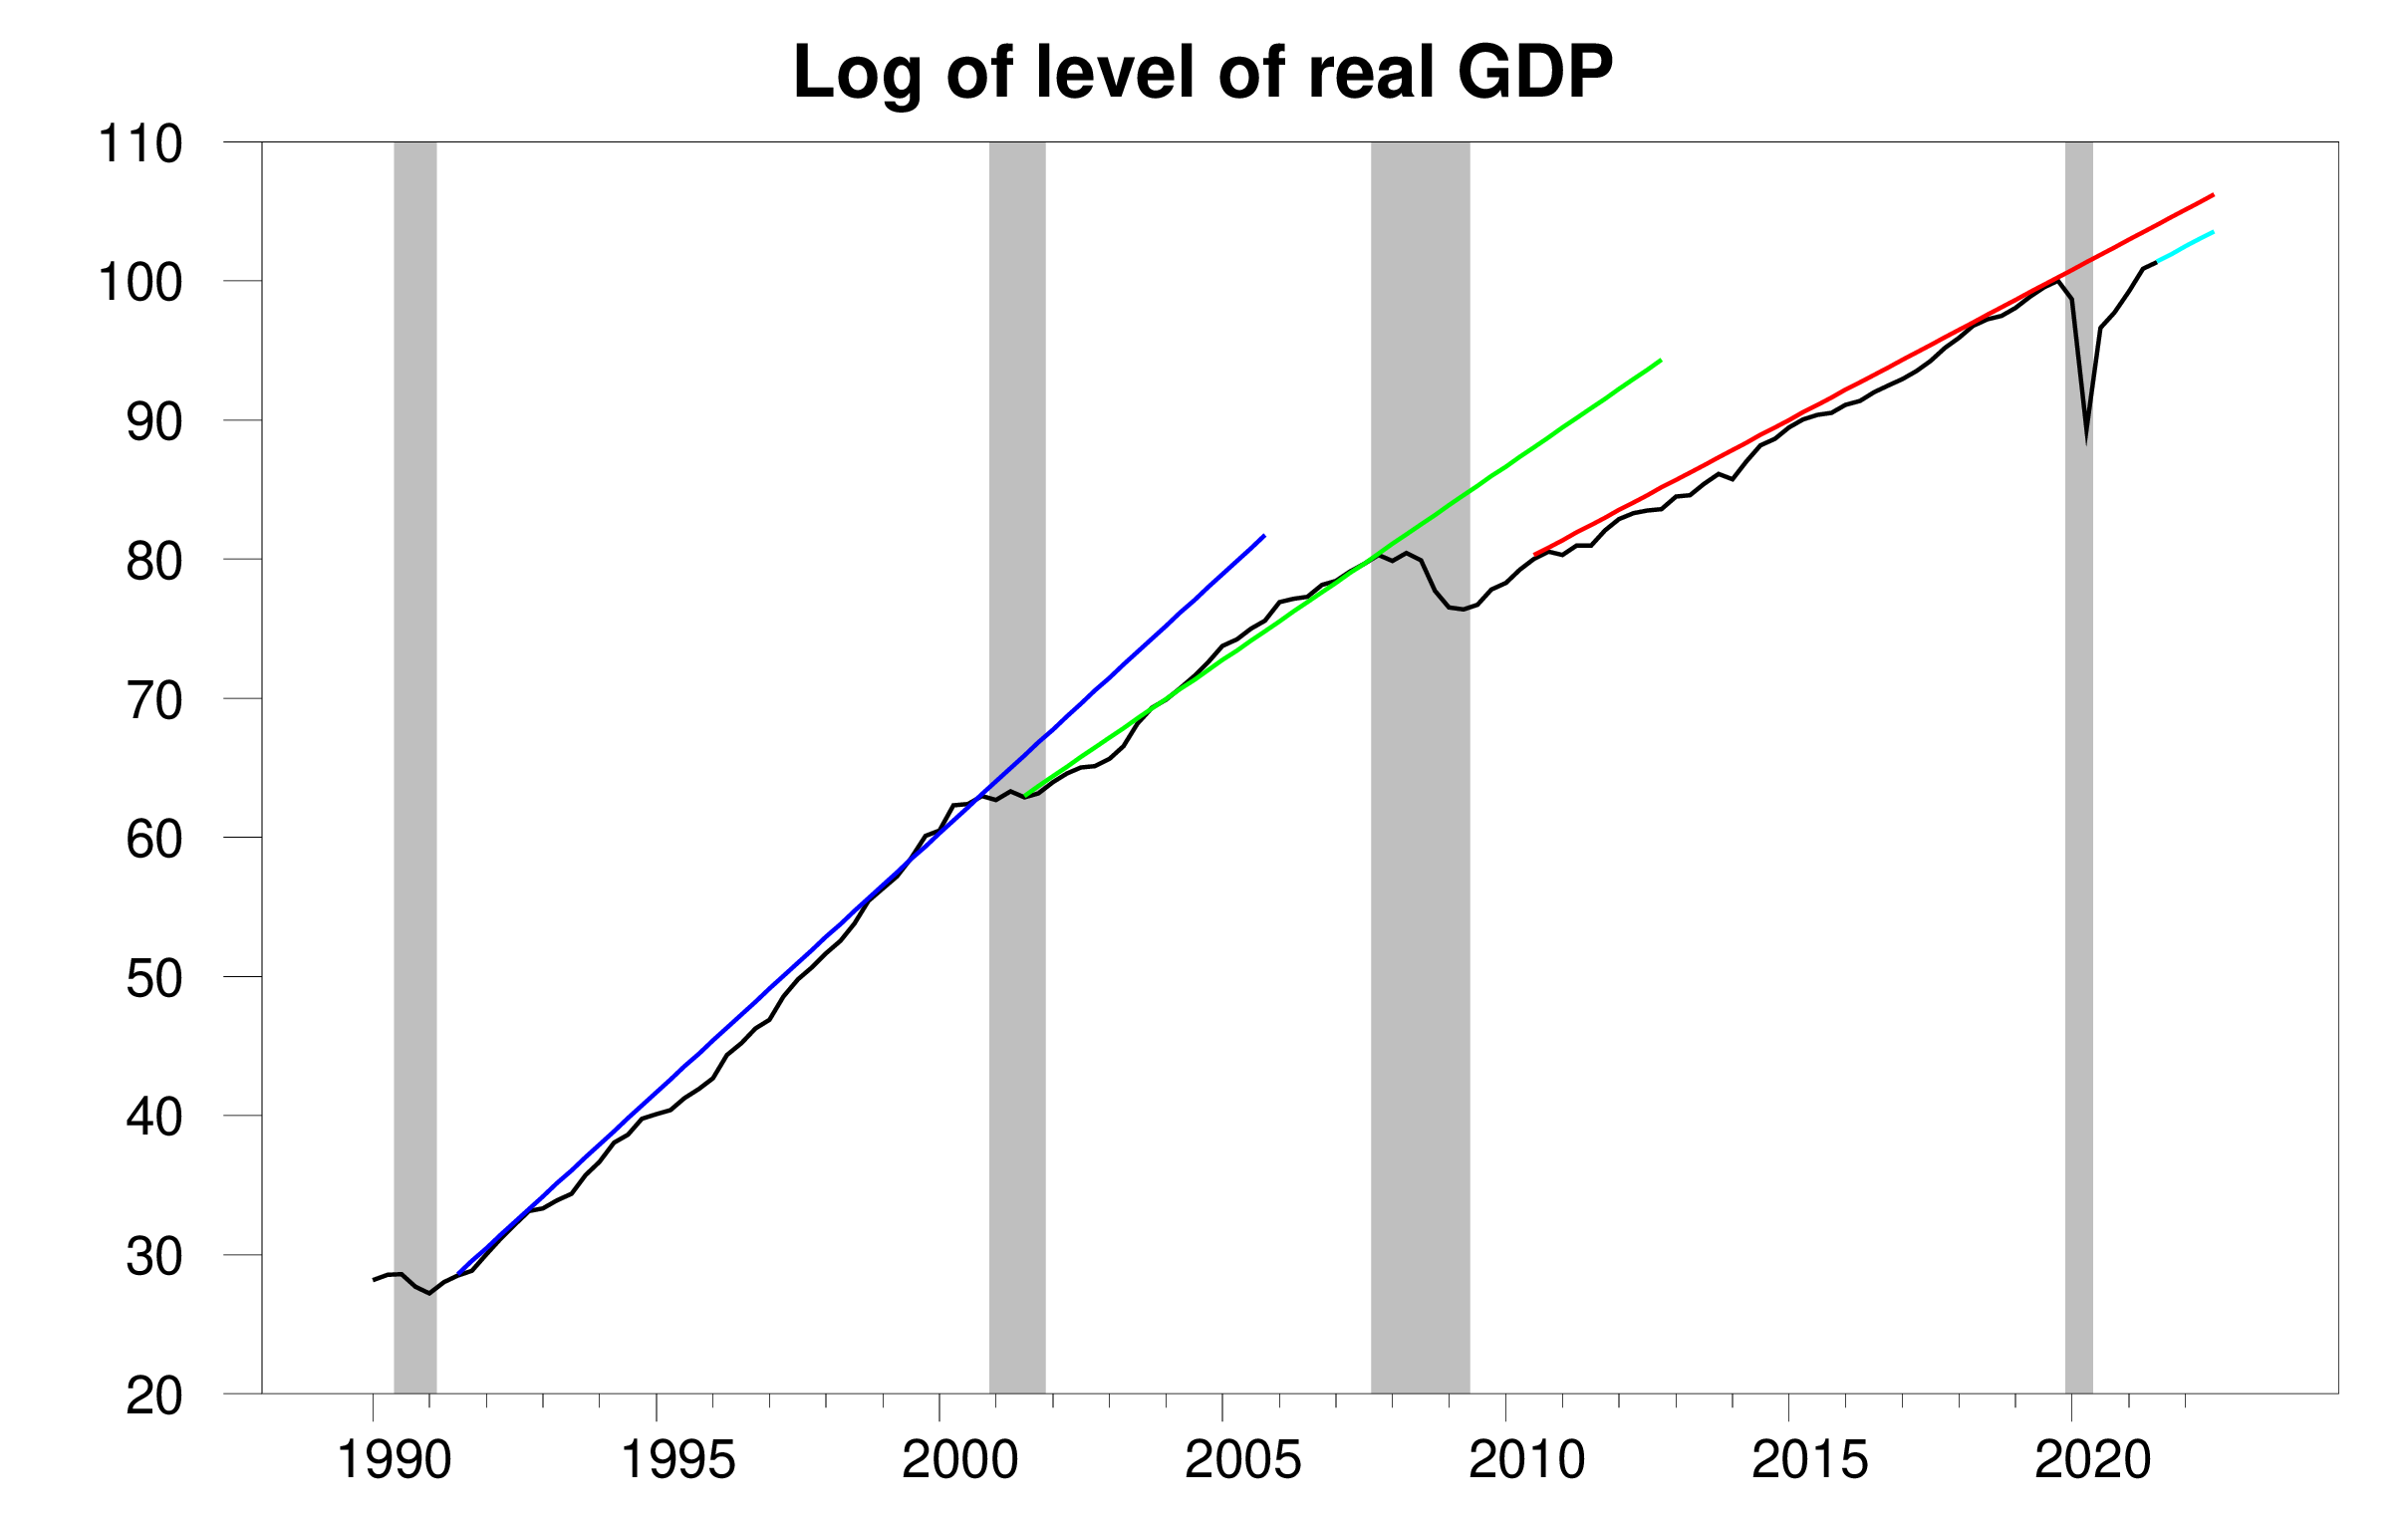
100 times the natural logarithm of the level of real GDP, 1990:Q1 to 2021:Q3, normalized at 2019:Q4 = 100. A movement on the vertical axis of 1 unit corresponds to a 1% change in the level of real GDP. Blue line extrapolates the trend from the 1991-2000 expansion, green from the 2001-2007 expansion, and red from the 2010-2019 expansion.
But the expectation that we’ll recover to the previous trend once a recession is over doesn’t have much support in the data. Economic recessions seem to have permanent effects on the level of GDP. There is often above-average growth in the first few quarters of expansion (the recovery phase in a “V” shape). But once the level of GDP is back to its pre-recession value, trend growth becomes the norm. We also see in the above graph that the average growth rates during expansions (which determine the slopes of the lines) seem to be falling over time. Big factors in those falling average growth rates are slower growth of the labor force and productivity.
In terms of the individual components of GDP, a key reason that the economy grew at only a 2% rate in Q3 is slower growth in consumption spending. Purchases of automobiles were a big factor in this. An important cause is difficulties car manufacturers are having in acquiring the computer chips required to put together the modern car.
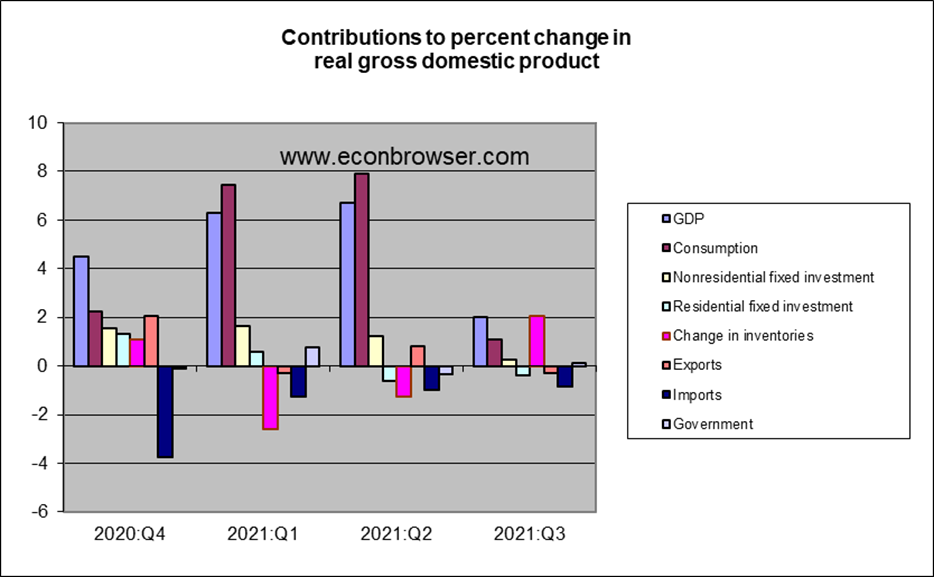
Another disappointment was new home construction, which made a negative contribution to the Q3 growth rate. We’ve seen plenty of stimulus for more residential fixed investment with low interest rates and dramatically rising house prices. Some analysts are also blaming sluggish new home construction in part on supply-side problems.
Inventory changes were an even bigger factor in the GDP numbers. If inventory investment had not made a positive contribution, GDP in Q3 would actually have declined relative to Q2. To understand what this means, it’s important to remember the way that inventories enter the GDP accounts. The change in inventories during a quarter is referred to as inventory investment. If inventories end up higher than they started out, inventory investment is positive, and if inventories are lower than they started out, inventory investment is negative. Inventory investment was sharply negative in Q2 of this year (namely -$174B at a quarterly rate). Inventory investment was still negative in Q3 (namely, -$68B), but not as negative as in Q2. Thus inventory investment was $106B higher in Q3 than it had been in Q2 (-68 – (-174) = +106). This alone accounts for essentially all of the increase in GDP between Q2 and Q3.
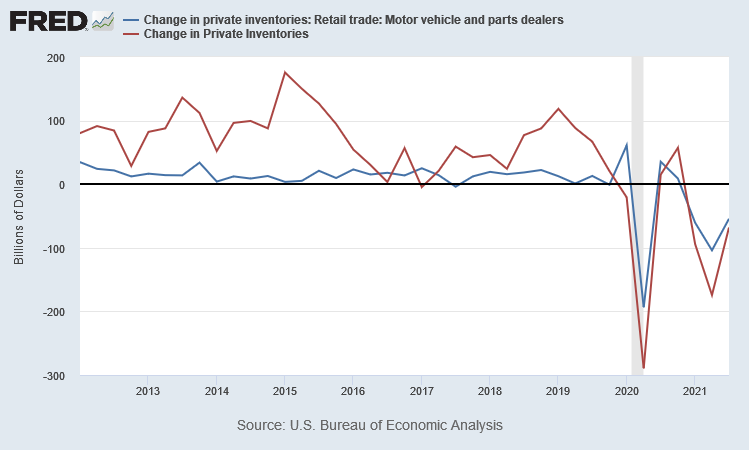
Nominal inventory investment, quoted at a quarterly rate, 2012:Q1-2021:Q3. Red line: Change in dollar value of all private inventories. Blue line: change in dollar value of inventories of dealers of motor vehicles and parts.
The graph above also shows where these inventory movements come from: cars are the main story. The manufacturers weren’t delivering enough new cars to dealers, which is why inventories ended the quarter lower than they started. This is another important way that the car-makers’ supply-chain issues are having big effects on U.S. GDP.
As these supply-side constraints ease, I would expect to see a surge in both consumer purchases and dealer restocking. Both changes should give a big boost to GDP. So it might be that 4% rather than 2% is the kind of growth we should be expecting once supply problems ease.
But fiscal and monetary stimulus are not the policies we should be looking for to get us to that faster economic growth.
Nope. Auto Sales via PCE wiped out at least 2-4% and 3-4% annualized growth pre-covid era trend rate, just by lack of final sales due to the hopefully now fading Chip Shortage. A distorted report that means little. Matter of fact, its evidence why the government need to stop giving out quarterly reports.
Yeah, you’re right. Less information would definitely be better.
Without the information, there’s no way to analyze what happened. The supply chain problems have their effect. Data means that effect can be considered and analyzed. So, quarterly reports are good, not bad, even though they seem erratic. They reflect what’s going on.
Datum ex machina, right, so no standard error? Why do you have so much blind faith in point estimates, that you simply don’t report error bars?
rsm,
Because these do not exist. Just exactly how are they supposed to estimate the standard errors on a particular estimate of quarterly growth. And, furthermore, what difference would it make if they did know what those were? Do you think those vary a lot over time? If they do not change over time (and, frankly, they cannot be estimated), then would you be inclined to say: “Ah ha! this point estimate rose, but I think given these standard errors it actually declined!”?
As it is, the degree of non-certainty of various estimates probably does vary over time. The intense debates last year about what was really going on during the second and third quarters when we saw a sudden and massive decline of the economy followed by sudden and massive increase was a time when in fact the degree of non-certainty was a lot higher than during most other periods. But, rsm, gues what? Nobody estimated standard errors on any of those less certain than usual estimates. Was this due to some sort of irresponsibly unscientific misbehavior on their parts that we should all be endlessly tsk tsking about as you keep so stupidly doing here? No. Making such estimates was impossble.
I am not sure which is worse with this repeated complaint of yours: how it shows what a humongous idiot you are or how it shows what humongous schmuck you are. Hey, I think their estimates should be rejected if they do not pay me a million dollars. Maybe I shall start repeatedly making that complaint here whenever these announcements are made. It would make about as much sense as this senseless and worthless whine you keep subjecting us to.
barkley, the behavior of rsm is just an extension of a similar behavior pushed by the radical right these days. they take scientific fact and try to inject uncertainty into the conversation. the end goal is to create enough confusion that people will begin to even doubt the basic science to begin with. rsm seems to think gdp based decision making (or informing) does not support his world view. so the next goal is to create uncertainty or doubt in the concept, so that it cannot be used to dispute his world view. if you notice on this blog, others have done similar things. think corev and his disputes of satellite data. or rick stryker and his attack on r0. unfortunately they are promoting a race towards ignorance.
CoRev promoting ignorance? Well, smack me with a soybean!
Baffled, again can not admit that following the SCIENCE means questioning it: “they take scientific fact and try to inject uncertainty into the conversation.” only ideologues do not question anything which might cause them to be uncertain.
His latest laugher was his denial that creation of Covid variants are LARGELY due to leakage from those vaccinated. Remember the ad claims kills 99% of …? Does he really not know what happens to that small percentage not killed? As a claimed scientist is he so ignorant to not understand: ‘Leaky’ Vaccines Can Produce Stronger Versions of Viruses” https://www.healthline.com/health-news/leaky-vaccines-can-produce-stronger-versions-of-viruses-072715
“Our data show that anti-disease vaccines that do not prevent transmission can create conditions that promote the emergence of pathogen strains that cause more severe disease in unvaccinated hosts.” How more wrong can anyone be?
Next he’ll be claiming adding more intermittent sources to the electric grid will stabilize it by solving the intermittency problem. Nah! He’s not that ignorant. Is he?
“in unvaccinated hosts” <<—–which part of this does CoRev not understand??
CoRev also says "to the small percentage of those not killed"—so here he's claiming that the majority of people vaccinated are "killed".
Now, I generally don't give Menzie advice on banning or censoring—but when you're talking about misinformation which can cause people’s deaths, I think this comment deems being filtered from the blog, more than say a person’s random use of vulgarity. But my sensibilities are different than most people’s I guess…….
CoRev, you might be interested in reading this:
https://www.nebraskamed.com/COVID/are-leaky-vaccines-causing-the-new-covid-19-mutations
Unless it’s one of your favorite preacher of idiots conservative radio host or Fox news, you’re not going to find a single scientist saying that those who have gotten both of the Moderna or Pfizer vaccine shots “are causing variants”. This is the type crap you’d read on QAnon bulletin boards.
There may be uncertainty in the world but one thing is known with absolute precision – everything you claim is a lie.
“Next he’ll be claiming adding more intermittent sources to the electric grid will stabilize it by solving the intermittency problem.”
That is NOT what baff is arguing and you know. But I’m disappointed that you did not write intermittent in all caps (this time).
Corev, i said probabilistically the unvaccinated have a greater chance to produce a variant. We had variants before the vaccine was widely available. And the virus spreads to the vaccinated primarily through the unvaccinated. This is the science corev.
Prof chinn, I appreciate your tolerance of opposing views. It enhances the debate. However, i suggest you reconsider your tolerance of intentional misinformation posted to this site. As a society, we have permitted this era of intentional misinformation to get out of control, to our significant detriment. Permitting intentional falsehoods is not constructive to good dialogue. Just a suggestion towards a couple of the more misleading commenters on this board. People like corev are not challenging the science, they are challenging science, period.
It gets worse moses. From the link
“Our research demonstrates that the use of leaky vaccines can promote the evolution of nastier ‘hot’ viral strains that put unvaccinated individuals at greater risk,” Nair said.
This is not just ignorance on corevs part. He intentionally tries to mislead. He says he is just challenging the established science. But that is not what he does. He tries to create doubt about science. As a scientist, i always have an amount of skepticism about what has been assumed and even proven. But he applies that to the entire scientific discipline. It is one of the reasons we have so many antivaxxers in the world today. They simply dont believe in science, period. Part of the problem is permitting their views to be equal to scientific views when displayed in public. These intentional misinformation comments have no business on this platform. Truth has a very hard time defeating liars who follow no rules. Its like arriving at a street fight that was supposed to have no weapons, and dealing with an adversary who wields a knife. Truth may be right, but wont win that fight today.
Prof chinn, perhaps you could add a feature to posts where viewers could vote on the truthfulness of a comment. Many may be hesitant to comment, but more likely to vote. At least somebody could get a measure of how bad a comment is without needing to directly engage with the commenter.
instrument error, observer error……
it is not like you are looking at a designed experiment of something that can be measured.
Well, clearly there are a whole bunch of supply chain issues going on right now that are outright restraining growth in many sectors. If those can get cleared up at some point, with this apparently taking longer than many (including me) thought would be the case awhile ago, then presumably there will be the possibility of “something better than this.”
Can you and the professoriate herein expand on what exactly are the supply chain issues and how to resolve?
Plus, maybe it’s not only supply chain constipation.
Just google “supply chain issues,” Shaw. Closed ports in Vietnam and China, chips, quite a bit more. They will get fixed eventually, not great dramatic resolution.
Does your question mean that you are such a blazing ignoramus that you think there are no supply chain issues? Oh, or do you think they are all due to something Biden did? I note they started under Trump, although they have gotten worse.
Oh, I suppose we could have the Fed sharply reduce demand by putting the federal funds rate at 10% there by inducing a substantial recession. Is that what you think the “professoriate” should come up with? Just how effing stupid are you?
annual rate was 4.9%
“we’d need to see growth for Q3 of over 4%, not 2%, and we’d have to maintain that pace for a full year.”
Well said. Two years ago 2% growth would be fine as we were near potential and 2% seems to be the growth rate in potential by a lot of metrics. But we are not yet at potential. It is odd, however, that supply-side considerations are the barriers to getting back to potential. These are not normal times – yet.
https://www.cepr.net/gdp-2021-10/
October 28, 2021
GDP Slows Sharply in Third Quarter Due to Supply Chain Pressures
By DEAN BAKER
Service consumption rose at a 7.9 percent rate, despite the delta variant.
GDP grew at just a 2.0 percent annual rate in the third quarter as supply chain issues hampered growth in several key areas. Durable goods consumption contracted at a 26.2 percent annual rate, knocking 2.7 percentage points off the quarter’s growth. Equipment investment fell at a 3.2 percent annual rate, while housing construction dropped at a 7.7 percent annual rate, knocking 0.18 percentage points and 0.38 percentage points off the quarter’s growth, respectively.
Even with Third-Quarter Declines, Vehicle Consumption Is Still Far Above Pre-Pandemic Levels
The drop in third-quarter car sales accounted for 2.39 percentage points of the hit to GDP from durables. However, car sales are still 4.3 percent above the year-round average for 2020. This means that the supply chain problems are stemming from extraordinary demand, which will fade in the quarters ahead, not an inability to supply a normal quantity of vehicles.
Housing Is Also Above Pre-Pandemic Levels, In Spite of Third Quarter Decline
Even with the 7.7 percent drop in housing construction, which followed a drop of 11.7 percent in the second quarter, output in the sector was still more than 10 percent above the 2019 average. It will likely remain somewhere near the current level in future quarters, after jumping sharply due to low interest rates at the start of the pandemic.
Consumption of Services Grew at a 7.9 Percent Annual Rate in the Quarter
In spite of concerns about the spread of the delta variant, services grew at a solid 7.9 percent annual rate following growth of 11.5 percent in the second quarter. However, service consumption is still 1.6 percent below its pre-pandemic level. Recreation services and transportation, which is largely commuting expenses, account for the bulk of this drop. The category of food services and accommodations rose at a 12.4 percent annual rate in the quarter (in spite of delta) adding 0.54 percentage points to growth. Real restaurant sales are actually above pre-pandemic levels.
Inventories Added 2.07 Percentage Points to GDP in the Third Quarter
This was all due to growth in non-farm inventories, which added 2.14 percentage points to growth. Farm inventories continued a fall that began in the third quarter of 2015. The drop in non-farm inventories presumably is the result of both relatively low prices over this period and weather conditions. It is important to realize that inventories still declined at a $77.7 billion annual rate in the third quarter, but this was still a positive for GDP since it was much slower than the $168.5 billion rate of decline in the second quarter. As inventories stop shrinking and start to rebuild, they will be a big positive for growth in future quarters.
Nonresidential Investment Grew at a 1.8 Percent Annual Rate ….
“This means that the supply chain problems are stemming from extraordinary demand, which will fade in the quarters ahead, not an inability to supply a normal quantity of vehicles.”
and this is why i am not concerned with long term inflation. the demand we see pushing prices up will not continue. so the forces pushing up inflation will subside.
Disposable personal income down 0.2% (0.7% annualized. Worker compensation up 2.2% (9% annualized.) So good news from the labor market, but not so good for overall demand. Personal saving rate at 8.9% is good, but it’s falling.
On the assumption that supply chain problems won’t clear up entirety in Q4, more of the same ahead. The Atlanta Fed’s Q4 GDPNow estimate will be released tomorrow. Should be fun.
Real GDP rose at a 2% annualized rate. Vehicle output was a 1.4% drag. So GDP ex-auto rose at a 3.4% pace. That’s only half of the median estimate 7%+ rate from early in August. So trouble beyond cars and trucks – no surprise.
Final sales to domestic private purchasers up 7.2%. Final sales of domestic product up 5.1%. Those and similar measures of demand are closer to estimates from early in the quarter. So demand is holding up. Supply is the problem. Demand outstripping supply accounts for inflation. What’s the outlook for supply? See “Log of level of real GDP” above.
About the step down in trend growth due to recession represented in the charts – there is also a flattening of trend. If labor participation is permanantly lower, that will lower trend growth, all else equal. Build Back Better is aimed at raising trend growth. The two factors are likely to prove offsetting to each other. Two percent growth will be tough to maintain over the long haul.
The Atlanta Fed’s GDPNow estimate for Q4 is out of the gate at 6.6%. The Blue Chip estimate is around 6.2% (just eye-balling from the chart). Trade and residential investment are seen as drags. Everything else is seen as boosting GDP, with personal consumption accounting for nearly 5% of the 6.6% total.
Just a guess – there is lots of room for a downside miss on PECE due to empty shelves during the holidays.
well, i’ve been foiled…i came over here intending to challenge all of you to explain how a $77.7 billion real decrease in inventories added 2.07 percentage points to GDP and i find that Dr Hamilton has already explained it…
so now look at this: these are the changes to inventories in 2012$ for the prior quarters of this year:
-88.3 -168.5 -77.7
those are historically large decreases; in fact, never in our history have we seen an inventory contraction such as we’ve seen in the wake of the pandemic https://fred.stlouisfed.org/series/CBI
one has to believe inventories will need to be rebuilt…if we get just half of that rebuilding in the 4th quarter, real inventories could grow by $167 billion…that would mean a $244.7 billion relative increase might be applied to 4th quarter GDP…that alone would boost 4th quarter GDP by 6.5%, even before one adds in any other GDP components…
algorithmic forecasts for 4th quarter GDP will never see that possibility…
whoops, i’ve made a mistake; it was a $90.8 billion improvement in inventories that added 2.07 percentage points to GDP, not $77.7 billion…hence, a $244.7 billion relative increase in 4th quarter real inventories would add something like 5.5% to 4th quarter GDP..
You know, not to punch too hard here, because I get the sense you are slightly better at numbers than I am, but, as regulars here know I can’t resist being the smart-aleck jerk. Uhm, just to verify, you didn’t get these numbers from China’s National Bureau of Statistics did you??
that’s a fair question. i’m spouting numbers & assuming everyone knows where to find them
source: https://www.bea.gov/sites/default/files/2021-10/gdp3q21_adv.pdf
Tables 2 & 3, Line 40 in both
if you can’t get the pdf to load, go here first: https://www.bea.gov/data/gdp/gross-domestic-product
the rest, as we say here, are “author’s calculations”
I was mainly teasing because of some things you quoted out of China in the past, where I thought the accuracy of the numbers (not your calculations but the sourcing) were dubious. But I do appreciate the links. Just razzing you mainly. I think the numbers related to inventory are interesting (and not something that would be immediately apparent to me) so I actually found your comment to be edifying.
looking my above comment this morning, Moses, i realize how sloppy it was, almost incomprehensible, so you were certainly justified in calling me on that, even being an otherwise smart-aleck jerk nonwithstanding….so let me try to explain what i was getting at again..
the following are the changes to private inventories in 2012$ for the prior quarters of this year, all at annual rates: 1st Quarter: -$88.3 B; 2nd Quarter: -$168.5 B; 3rd Quarter: -$77.7 B
those are historically large decreases; in fact, never before in our history have we seen an inventory contraction such as we’ve seen in the wake of the pandemic https://fred.stlouisfed.org/series/CBI
so i believe that inventories will need to be rebuilt from the current levels…if half of the inventory drop in the first three quarters of this year should be restored in the 4th quarter, real inventories would grow by $167 billion…that would mean a $244.7 billion relative increase would be applied to private inventories in 4th quarter GDP (ie, the change from -$77.7 billion to + $167 billion) …that alone would boost 4th quarter GDP by ~5.5%, even before one adds in any other GDP components…
I think most of your numbers are probably very accurate, my only question there, or strong suspicion, would be those inventories would not be “rebuilt” or “caught up” in the 4th quarter, and might come a couple quarters later. I’d certainly be happy if they did backload faster, because that would keep oil/gas down to the end of the year—among other products.
Yes. The current supply constraints are actually confirmation of demand that will be met in the following quarters.
I have said this before but LinkedIn is populated by a bunch of morons. Case in point this stupid joke from some clown who confuses economists from the hacks that often pretend they are expert witnesses on something. Most of these clowns are accountants or lawyers pretending to be economists:
A mathematician, an accountant, and an economist apply for the same job.
The interviewer calls in the mathematician and asks “What do two plus two equal?” The mathematician replies “Four.” The interviewer asks “Four, exactly?” The mathematician looks at the interviewer incredulously and says “Yes, four, exactly.”
Then the interviewer calls in the accountant and asks the same question “What do two plus two equal?” The accountant says “On average, four – give or take 5% percent, but on average, four.”
Then the interviewer calls in the economist and poses the same question “What do two plus two equal?” The economist gets up, locks the door, closes the window shades, sits down next to the interviewer, and says “What do you want it to equal?”
I had a very pleasant flight a few years ago with a former econometrician turned stand-up comedian. Since I was working on the company’s strategic plan at the time, I asked her what she thought the country’s GDP growth would be.
Her response: “what do you want it to be?”
So much for economic forecasts! But no different from corporate financial plans.
ZOMG! We haven’t seen GDP growth this low since …
2019 right before the pandemic! Or Q3 2018 or Q4 2018 when it was 0.9% during the so-called Trump miracle economy.
Or the Bush Boom (Jerry Bowyer’s Fuzzcharts at the National Review back in the day)!
So, in 28 to 29 years our real GDP will have doubled?
Allowing for some, arguable future population growth, per capita GDP will be north of $100,000.
Does any care to imagine what the economic standard of living will be?
Ah, love the smell of exponential growth in the morning…
You must be assuming a 2.5% per annum growth rate. If the growth rate is only 2.0% then real GDP with have increased by 75% not 100%.
But who knows. After all John Cochrane thinks 4% growth is responsible if we simply take the weeds out of the garden. And he claims to be an economist?
I was being a tiny bit sardonic about how about the consequences of assuming indefinite exponential growth are blithely overlooked by one and sundry.
In general, either we riff on Keynes about the long run, or we assume the Second Coming happens (theologically or cybernetically) before the universe’s limit on growth kicks in, or we say: yes, while we do use data from a number of previous decades as our base, we can as rational actors only reasonably work with the 5-10 years, if we want to be very daring, perhaps we can do some extrapolations for maybe 20 years, but after that… che sera, sera.
Ah, the most interesting history is yet to be, if not the best…
Jared Bernstein of the Council of Economic Advisers has an excellent post showing part of what is behind the supply chain issues.
https://www.whitehouse.gov/cea/blog/2021/10/26/bernsteins-beat-throughput-at-the-ports/
Figure 1 shows how demand for goods has exceeded demand for services for the first time in history — and not by just a little, by a lot! It’s rather extraordinary.
And Figure 2 shows that it isn’t that the ports have broken down. They are actually handling 19% more containers than ever before. They just can’t keep up with the extraordinary demand.
(I would also be interested in an explanation for the decade long shrinking of the gap between services and goods even before the pandemic. It’s rather curious that the crossover occurs right before the pandemic.)
Kevin Drum presents the data on consumer spending in a different and useful way:
https://jabberwocking.com/chart-of-the-day-consumer-spending-slows-down-in-september/
Before the pandemic, goods spending was 36% of total consumption. Now it is around 40%. Back in 2014, goods represented only 34% of total consumption.
note that his graph of goods and services is an index, with February 2020=100 so personal services naturally fell after that date due to the pandemic…the value of services is still about twice that of goods, ie, from this morning’s income and outlays: the current dollar increase in September personal spending included a $63.6 billion annualized increase to an annualized $10,517.0 billion in spending for services, and a $33.1 billion increase to $3,558.5 billion in annualized spending for nondurable goods, which was slightly offset by a $3.2 billion decrease to $1,984.8 billion in annualized spending for durable goods…
source: https://www.bea.gov/sites/default/files/2021-10/pi0921.pdf Tables 1 & 3
what his second graph probably really shows is that our ports were overwhelmed after the stimulus checks went out and everyone ran out & loaded up on imported goods….
“note that his graph of goods and services is an index”
Doh, of course, thanks. The graph was constructed with the 100 crossover point at the beginning of the pandemic. It does a good job of showing the extraordinary switch from services to goods. This is a recession like no other. The folks a year ago who were thinking that the economy would flip on like a switch once vaccines were available were overly optimistic. Real life is always more complicated than you think.
Joseph,
Note that Bernstein has indexed both series in order to show relative changes more clearly. In terms of levels, service consumption is still much higher than goods consumption:
https://fred.stlouisfed.org/graph/?g=IoUd
Still, that chart is remarkable.
“Figure 1 shows how demand for goods has exceeded demand for services for the first time in history”
Note that the graphs were both indexed to being both equal to 100 as of 2000. Services still dominated goods but by a lot less as many of us are now eating at home and not out.
As to the narrowing pre-pandemic, I would conjecture that the relative price of services has gone up (goods a lot cheaper but the cost of providing services not so much).
《Just exactly how are they supposed to estimate the standard errors on a particular estimate of quarterly growth.》
See https://economics.stackexchange.com/questions/12311/how-to-measure-gdp-in-practice/17812#17812
《the general principle is an estimation based on statistical data. The 4 major aspects are private consumption, government consumption, investment and net exports.》
Estimations have standard errors, no? This is basic statistics, right?
Are you all talking about noise, since you refuse to report your statistics accurately?
And even when economists do their own error estimates, not, as they should, by calculating the standard error, but by comparing GDP to GNI, do you still get widely varying estimates that make a mockery of your policy prescriptions?
See https://voxeu.org/article/new-measure-us-gdp
《As a stark example, in 2000Q1 GDPE was 1.1% while GDPI was 8.1%, and the very next quarter GDPE was 7.5% while GDPI was 2.2%. Clearly, since they are supposed to measure the same underlying true GDP, one of them was badly wrong each quarter.》
If you look at the GDP and GNI estimates graphed over time, do you see wide swings that vary?
Once again, you’re all dealing with noise, right? Any claim to the contrary is pure religion?
Kevin Drum just went off saying local stories should get less national attention using an example of how right wingers are abusing the actual facts of a high school rape to help Youngkin in the Virginia governor race. Forget Kevin and just read this excellent detailed account of what really happened as I think this needs more national attention:
https://news.yahoo.com/loudoun-county-sex-assault-case-dominates-final-days-of-virginia-governors-race-143831258.html
A 14 year old boy did rape a 14 year old girl but the right wing claims he was posing as a girl and the liberal school officials covered this up are false. No this is a cheap exploitation of a tragic rape to go after the rights of transgenders by the Donald Trump crowd. It should be reported to expose the evil of these right wingers.
https://cepr.net/third-quarter-gdp-more-good-than-bad/
October 29, 2021
Third Quarter GDP: More Good than Bad
By DEAN BAKER
The 2.0 percent growth figure reported for the third quarter was widely viewed as disappointing. It was slower than most analysts had expected and certainly a large falloff from the 6.7 percent rate in the second quarter, but on the whole, it should be viewed as a positive report.
There are two key reasons for why I see the report as largely positive. First, there were extraordinary and temporary factors that prevented the growth from being considerably more rapid. Second, we need to get a fuller picture in assessing growth. In the pre-pandemic period, no one would have considered 2.0 percent growth particularly bad. It averaged 2.5 percent in the three years preceding the pandemic. We are already above the pre-pandemic level of GDP, although somewhat below the trend rate of growth, which means we are through the period where we would ordinarily anticipate extraordinary growth.
The Temporary Factors
The two major temporary factors slowing growth in the third quarter were supply chain problems and the pandemic. The supply chain problems have been widely reported. There are ships sitting offshore at our major ports waiting to unload cargo. The problem is that ports are overloaded as there has been a sharp increase in demand for goods during the pandemic. Since many of these goods are imported, this means more ships to be unloaded.
The problem is not just one of unloading at the ports. The transportation companies that move the cargo to warehouses across the country are unable to meet the increased demand for their services.
A big part of this story is that they don’t have the truckers to move the freight. Several decades ago, trucking was a relatively high-paying industry for workers without college degrees. This was in large part due to the fact that it was a heavily unionized industry. The Teamsters union was very effective in raising the pay and improving the working conditions for truckers.
However, in the last four decades, trucking deregulation coupled with anti-union policies by employers, which often had the support of the government, substantially weakened the Teamsters. As a result, wages stagnated. The real hourly wage for a trucker, just before the pandemic, was 5.0 percent below its level in 1990. Also, without a strong union to back them up, truckers were often forced to work long and irregular hours and to drive unsafe trucks.
As a result, quit rates in the industry soared, peaking at 3.3 percent in April, 40 percent higher than the prior peak. The sector now reports a job opening rate of 7.8 percent, two and a half times the 3.3 percent peak in 2001, when the economy was still experiencing the Internet boom.
It is worth noting that the bottlenecks due to a lack of trucking capacity have little to do with whether we import our goods or produce them domestically. In either case, they must be moved from the place they are produced to the stores or Internet retailers that will eventually sell them to consumers.
The fact that we now import many of our manufactured goods is not the main source of our problems. The backlog of goods is showing up on our ports because that is where the goods come in. If we instead produced everything domestically, and our trucking sector was in no better shape, then we would see the goods piling up outside of Detroit, Milwaukee, and other major manufacturing hubs.
It is easy to see the impact of the supply chain problems in the third quarter GDP data….
https://fred.stlouisfed.org/graph/?g=Inl9
January 30, 2018
Personal Consumption Expenditures for goods and services, 2017-2018
https://fred.stlouisfed.org/graph/?g=ImjO
January 30, 2018
Personal Consumption Expenditures for goods and services, 2017-2018
(Indexed to 2017)
https://fred.stlouisfed.org/graph/?g=GyyX
January 15, 2018
Real Personal Consumption Expenditures for durable goods and services, 2017-2018
(Indexed to 2017)