What the interest differentials say
One of my long term interests is in the predictability of exchange rates, particularly over the longer term — at horizons of quarters if not years.
One recent paper coauthored by myself, Yin-Wong Cheung and Antonio Garcia Pascual examined the
long horizon (1 quarter, 1 year and 5 year) predictability of the USD against the DM, Yen, Pound, Swiss Franc, and Canadian dollar. We compared several popular models, including the Dornbusch and Frankel
sticky price monetary model, a model based upon productivity differentials, interest rate parity (essentially the forward rate), and a specification incorporating many of these channels — sometimes called
BEERs (for behavioral equilibrium exchange rate models). All of these were compared against a random walk characterization of the exchange rate.
We found that, using a mean squared error criterion, there was little evidence of outpredicting a random walk, although at long horizons, interest differentials did the best.
When we used a direction-of-change metric, we obtained greater evidence of outprediction (easier to predict direction than level), and found the same model, interest rate
parity, did best. But this pattern held primarily at long horizons (5 year) rather than at short horizons. This reflects the well known finding of forward rate
bias in exchange rate literature. In fact, at short horizons, the interest differentials point in the wrong direction.
If forward exchange rates were unbiased predictors of future spot rates (i.e., if interest differentials were unbiased predictors of exchange rate depreciations), then assuming
away issues of nonstationarity, the beta coefficient should be one. Obviously at short horizons, they’re not. But at longer horizons, they do get closer to the value of unity.
Guy Meredith and I discuss this finding in greater detail here. If you are a sucker for
punishment, you can read another, wider ranging, paper on the subject. Truly interested people can
download the data (but you have to promise to cite our paper if you publish using the data!).
Should we conclude from this that all we need to pay attention to is long term interest rates, if we want to predict the dollar’s value in the long term?
If so, then we can refer to the following rates to make our judgments:
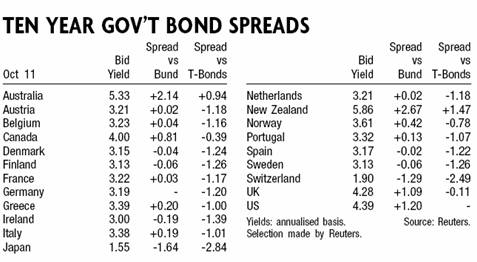
The spreads are recorded as foreign interest rate minus US interest rate, where the interest rates are on ten year bonds (of various maturities). I will assume
for the sake of simplicity that the duration of these bonds is about 5 years (i.e., that they have about five years until they mature, on average). If
this is the case, then the spread of -2.84 ppt. (1.55 ppt – 4.39 ppt) implies that the yen will appreciate against the dollar on average of -2.84 ppt per year for the
next five years. And the pound will appreciate an average 0.11 ppt per year for the next five years. Of course, you may lose lots of money if you try to exploit this relationship, since the interest parity relationship, even at the long horizon, is not
a strong one (the adjusted R-squared from the regression of 5 year changes on 5 year interest rates is 0.05). At the short horizon (one month, 3 months), don’t even try using this for
G-5 currencies — the forex traders make plenty of money betting against this relationship (it’s called the carry trade).
One last caveat in using interest rates. The past couple of years have seen what some considered aberrant behavior in long term interest rates. Several papers (Chinn and Frankel;
Warnock and Warnock) have discussed this. So it may prove even more perilous than usual to rely on long term interest rates to infer dollar movements.
More speculation on what does and does not work (from an academic/policy perspective, and not a money-making perspective) can be found in this
presentation.
Jim,
Once upon a time you and Charlie Engel published a paper in the AER that purported to show long swings in exchange rates. Now, presumably those long swings were/are relatively unconnected to any of the determining variables you were studying in this current paper, the “usual suspects” for exchange rate models.
Did you check your long swing model against the random walk? How does that earlier work relate to this current round?
Actually, Barkley, this post was from Menzie, not me.
A central question to the validity of any US economic statistics is the reliability of the dollar as a comparative unit of measure. There was an article in the Wall Street Journal perhaps 18 months ago that compared the value of the dollar to a synthetic basket of world currencies over fifty or one hundred years. This graph indicated that there were two significant departures from the mean. The first of these were in the early 1980’s. This coincided with 12% + CD rates, and might indicate that the buck was bid up as foreign investors purchased what might have appeared to be attractive assets.
The second deviation from the mean was in the last half of the 1990’s. This might reflect foreign investors buying the buck to invest in those lovely internet companies.
The recent depreciation of the dollar versus the Euro could be a retreat to the mean, or could be reflective of the short & interemediate term interest rates being offered on Euro deposits versus dollar deposits between 2000 – 2005.
Insofar as exchange rates reflect the activities of the various central banks, and the perception of political and economic stability, it is possible that the random walk theory is on point. However, recognize that the dollar has lost 1/3rd of its value as measured by the Euro, and, pre-Katrina, had lost 40% of its value as measured by a barrel of oil, and has lost about 30% of its value as measured by a pound of steel, and has lost about one-third of its value as measured by a residence located any place in the US over the last five years.
Given these rather dramatic changes in asset values compared to GDP as measured in dollars subject to an official deflator of 2% to 3% annually one is led to question the validity of the popularly reported data.
The change between the values of basic resources and dollars is sometimes called appreciation. What is the difference between appreciation of assets and a devaluating dollar?
Bill
Jim,
Oooops! Sorry.
OK, so, Menzie, how about it? How does this round of your research account for, or recognize, the view in the Engel and Hamilton paper (AER, 1990) that currencies do long swings? That looked pretty reasonable to me back then and still does.
After all, what has the history of the euro been since its official inception in 1999? Started at $1.17, fell pretty much steadily to around $.80 in about September 2000 when Larry Summers and gang oversaw an intervention, then proceeded to rise over the next several years to nearly $1.40, only to drift back down a bit more recently.
I don’t know what this says about the future of the US dollar, but obviously at some point the rising foreign indebtedness will show up as an increasingly negative outflow of investment income in the current account (bit of a mystery why that has not happened so far). Presumably this will eventually put some serious downward pressure on the US dollar, random walk or not.
My apologies, I have to remember to announce that it’s Menzie, and not Jim Hamilton, writing at the beginning of the post, when I contribute.
Let me deal with the easy question from Barkley Rosser: Charles Engel applied the Markov Switching model with long swings in a JIE paper in 1994. It can be found here:
http://www.ssc.wisc.edu/~cengel/PublishedPapers/JIEMarkov.pdf
If I recall correctly, he found that the long swing model did not outperform a random walk. Now, with additional data (and additional swings), the result may have changed. I’m not aware of anybody who’s tested it though. In considering the utility of the long swing model, one has to take into account the fact that sometimes the dollar seems to be trending sideways, e.g., 1987-1994. So, an open question.
I agree at some point outflows of income due to our net negative investment position should be important — but we still maintain a positive flow on this account. But if one believes in a present value interpretation of the dollar, then it’s already priced into the exchange rate.
Regarding Bill Ellis‘ point, I admit I am at a disadvantage, not having read the WSJ article. However, I will note that when purchasing power parity holds instantaneously, then the dollar’s value should move proportionately with the price of a bundle of domestic goods relative to the price of a bundle of foreign goods. When PPP only holds in the long run, this link is broken, and the dollar’s value need not move one for one with relative price levels in the short run. If PPP doesn’t hold because of nontradables, then the link is broken even in the long run.
So I’m not certain these observations are reasons to doubt the validity of the popularly reported data (although one might have questions about the data for other reasons — historical figures on Net International Investment Position get revised upward each year, for instance).
Menzie,
Do not wish to get picky, but I just looked at the abstract of the Engel and Hamilton paper. Unless I misread, it says that they rejected the null of a random walk in favor of their model of long swings. Did not read further. Maybe that means the random walk is favored, but it does not quite look like it, and my memory of actually reading the paper (a long time ago) was that they favored the long swings, at least back then.
Last time I looked that income flow account was negative, but by a relatively small amount, maybe around $20 billion, essentially a pittance compared to the now $3 trillion plus net indebtedness of the US (what is the latest on that figure anyway?). We might be looking at different accounts, things get a bit messy and complicated in the IBOPs. I would seriously doubt that it has gone from mildly negative to positive. People keep telling me it is because the US has such profitable foreign investments while those poor sucker foreigners (mostly central banks now) have been willing to lend us money at such pathetically low rates. OTOH, the pompous types go on about how we are so safe and have such a low risk premium, guffaw…
Bill Ellis said: “recognize that the dollar has lost 1/3rd of its value as measured by the Euro,”
That claim is made frequently, but it is not true. At its inroduction six years ago in January of 1999, the Euro was worth 1.17 Dollars – only 2% less than its value today at 1.20 Dollars. However, it is true that the Euro declined during the following years to 0.86 Dollars. The recent correction is therefore not a weakness of the Dollar but simply a recovery of the Euro from temporary weakness.
One more point. If we substitute the German mark for the Euro than the Euro/Dollar exchange rate can be traced back for over 50 years. It is very remarkable that in terms of the German mark, the Dollar did not change its value within the past 25 years. Its exchange rate against the German mark is today roughly the same as it used to be 25 years ago.
Finally, I believe that the exchange rates between all major currencies (US$, Euro, Yen etc) are being managed by the central banks within certain limits. For that reason, it does not make sense to analyze the Dollar exchange rate in terms of productivity differentials, interest rates etc.
Such analysis would only make sense if the Dollar would be trading in a truly free market. This is simply not the case.
The US$ exchange rate is part of a greater anomaly. How is it possible that the greatest debtor nation in the world (US) enjoys the highest possible credit rating (AAA) while the greatest creditor nation in the world (Japan) has a credit rating below that of poor Botswana (a 3rd world country)?
Barkley Rosser: I was referring to Engel’s 1994 JIE paper; in that study, he found
“In general, the model of Engel and Hamilton (EH) does not clearly outperform the random walk model or the forward exchange rate in out-of-sample forecasts. The mean squared errors of the forecasts of the segmented trends model tend not to be significantly lower than those of a zero-drift random walk, a random walk with drift or the forward rate.”
http://www.ssc.wisc.edu/~cengel/PublishedPapers/JIEMarkov.pdf
So Engel and Hamilton did find positive results in the in-sample context; however, ever since the Meese-Rogoff (1983) papers, it has been standard to subject exchange rate models to out-of-sample tests.
Regarding net income, I’m looking at the balance on income receipts, in the August issue of Economic Indicators, page 36 (published by JEC and CEA):
http://frwebgate.access.gpo.gov/cgi-bin/getdoc.cgi?dbname=economic_indicators&docid=36au05.txt.pdf
There is a negative entry of about $1 billion in 2002q1, but otherwise all entries are positive.
Robert Sczech: I agree in principle that G-3 central banks probably have target zones that are of diffuse credibility and definition. But these bands seem to be pretty wide, so wide that the nonlinearities implied by the formal Krugman-Obstfeld target zone models can’t be detected (see Meese and Rose, REStud, 1991, and a paper by me in JIMF in 1991).
About the anomaly of rankings — they pertain to sovereign debt, so the rankings pertain not to the soundness of the economy overall, but the ability of the government to service government debt. The two can diverge, even if we think they should move together.
I was looking at the chart with the red green and blue lines and was wondering why the green line seems to be the blue line offset by a number of years starting with about 1980.5.
If the green was moved starting at about 1990.5 back to 1980.5 the green looks like a good match for the blue. ?????
You smart guys could clear this up for a dumby, please.
Quote: “About the anomaly of rankings — they pertain to sovereign debt, so the rankings pertain not to the soundness of the economy overall, but the ability of the government to service government debt.”
Menzie, that argument is not convincing. The ability to service government debt is always better than the soundness of the overall economy. Sovereign debt can always be paid even if the economy is dead simply by issuing more debt or simply printing the necessary currency. In other words, sovereign debt can not be defaultet on. For that reason, a sovereign ranking is always a ranking of the underlying economy. In the case of Japan, their Dollar reserves are greater than of any other country in the world. Secondly, their economy is more competitive than the economy of the US (consistent trade surpluses in the case of Japan versus consistent trade deficits in the case of US). Their national debt as a percentage of gross national product is greater than in the case of the US, agreed, however, their long term inflation rate is much lower than in the US. Moreover, the total debt (over $40 trillion in the US) is much lower than in the US. In view of all these facts, ranking the credit of Japan on par with a 3rd world country much below the ranking of the US or any other G3 country can not be justified. It is in fact a joke.
Dilbert Dogbert: The green line is a random walk:
s[t] = s[t-1] + u[t]
so predicted-s[t+20] = s[t]
Robert Sczech: Of course sovereign debt ratings can differ from country ratings. Think of the USSR at the end of the Cold War — it’s rating was excellent because it always paid its bills; yet one could argue that the economy overall was collapsing (although few in the West knew).
Conversely, Russia now has tremendous earnings from oil exports; yet government bond ratings were only recently increased to BB+ (S&P). That’s the distinction between the country’s economic potential and government credibility.
“Think of the USSR at the end of the Cold War — it’s rating was excellent because it always paid its bills”
Menzi, Japan has never missed a payment on its sovereign debt either, yet its credit rating is below a 3rd world country. Furthermore, the Japanese debt is denominated in Yen – not in foreign currencies as it is the case with Russia. Nevertheless, despite a collapsing economy, Russia remained current on its sovereign foreign debt. It never missed a payment. Yet its credit rating was lowered to junk anyway. The US has defaultet on its foreign obligations in 1973 (closing of the gold window by Nixon), yet its credit rating was not lowered a bit. The more I think about this, the more I am convinced that all these credit ratings are simply politically motivated and have little to do with the actual credit worthiness of the countries in question. For instance, Russia is now in effect debtfree (the amount of Dollars held by Russia in reserve exceeds its foreign debts) and is for that reason much more creditworthy than the US which accumulated unpayable foreign debts amounting to many trillions of Dollars. Economics is indeed part of politics.
Robert Sczech – You are of course correct that the Euro began trading at $1.17. The point at issue is the value of the dollar, and it appears to me that the quoted statistics miss the reality of the economic transformation that we are in.
Over the last five years we have officially “enjoyed” a low level of reported increases in the CPI, and a low level of interest. It was probably necessary for the Fed to take an aggressive position post 9/11. While many of the changes that have resulted are necessary, they are glossed over by government statistics.
For much of the last five years the Bureau of Labor has reported significant growths in worker productivity in the US. Essentially, a growth in worker productivity, when viewed obversely, is that labor received a lower portion of business revenues. This basic change reflects many issues, including free trade, and improvements in communications. However, a central element is that there is a large under-utilized pool of labor in Asia, while the US has limited immigration and has a fertility rate that is at a maintenance level.
The first product of a shortage of labor in the US was reflected with large wage gains, roughly from 1960 to sometime in the 1980’s. These gains, compared to the cost of tangible assets resulted what is known as an improvement in the standard of living.
It is of interest to our government to maintain a position that there is no decline in this standard of living. The CPI has long been criticized as not providing an effective measurement, but I find it almost amusing that the press releases now talk about the “core CPI”, attempting to minimize the impact of unfavorable changes.
The history of the US is one of importation of labor through the process of immigration, both forced and free. In the twentieth century there was a marked change in attitude with increasingly strict limitations on immigration. This of course supported, in the short term, the value of domestic labor noted above. However, we are now supplanting this shortage with the importation of products, and the out-sourcing of services. This is the basic foundation of the “increase of worker productivity.” It wasn’t US based labor that generated the growth in production.
Growth in the productivity in where in the world is in the end good for the world for we can only consume that which we can produce. Thus, increases in Asian, and Mexican, etc. productivity increase the wealth of the world as a whole. However, the areas that benefit the most are those that make the most dramatic improvements in productivity, and in considering the large populations of Asia, and the generally low level of utilization, the economic gains that are being experienced are centered there.
Then we consider the impact on the dollar, and commentators cite the growth in US’s deficit in the balance of trade, yet we continue to report low levels of growth in the CPI. The balance of labor to consumption in the US is changing but there is no reported significant inflation. At least part of this support is due to China’s policy of pegging their currency to the US. While we have politically chastised them for this position, they have a vested interest. As China needs to import oil, they are competing with the US for that oil. If they let the dollar fall in value, then the funds they receive from export to the US will buy less oil.
Giving due caution to the statistics because the CPI is generated by a government with a vested interest, and exchange rates are a product of vested interests, it seems necessary to look for some validation. With this concern I look at real estate prices and find that the ratio of residential property prices to average wages has changed dramatically. Likewise, the cost of property in Mexico, and in China have also grown when compared to the dollar. Likewise, oil prices in dollars had grown dramatically (pre-Katrina). Steel prices increased dramatically.
We masked the change in real estate prices with a government monetary policy that kept home ownership costs low due to low mortgage rates. While real estate prices rose, the growth in equity was moderated by increased borrowing so that many have no more dollar wealth after five years than they had at the beginning. As the Fed retreats from this position the dynamics will inevitably change. While the papers are full of predictions that real estate prices are a bubble, and will fall, it is possible/probable that China, like Japan before them, will find US real estate prices attractive compared to their hoard of dollars.
The interest of much of the world in maintaining stable exchange rates suggests that the value of the dollar may not change a great deal. However, there is much evidence of a significant change in the balance of the wealth of nations.
I do not predict the end is near. As the wealth of the Asian populations grow, so will their consumerism as has happened in Japan before them. The gap between the American standard of living and that of the labor rich nations will narrow, but the question is whether this will come from the rise of Asia, or from the decline of the US standard of living.
Bill Ellis
OK, here’s the catch for us folks from the developing world. You say that interest rate differentials do a reasonably good job of explaining FX movements in the long run. But, your sample is composed mainly of OECD countries’ currencies. What if you, say, threw in the likes of the Indonesian rupiah and Polish zloty in there? Many of these countries would have had markedly higher interest rates yet suffered from depreciation in recent years.
Although the point made about interest rate differentials is salient among developed nations, I doubt whether it will hold once you include more developing nations’ currencies in the sample. A caveat, then.
Green vs Blue
Thanks for the explanation.
Robert Sczech: I think we’re in agreement on this point: politics matter. The commitments the government has made to its domestic constituents (contingent liabilities, refusal or willingness to tax) and the commitments, or impicit or tacit guarantees made to the government by other governments or institutions (think Korea vis a vis the US and the IMF) all matter to the extent to which sovereign debt can be repaid.
Bill Ellis: I’m not certain I understand with the main thrust of your argument — that’s my limitation rather than your discussion.
But let me address one contention, and that is the statistics are skewed in a way to highlight in a positive way the Administration’s worldview. This view appeals to those who have a cynical perspective on the Administration — and I believe that many politicians would love to distort those statistics. However, I don’t believe there is evidence that the key economic statistics have been distorted. CPI may have its problems, but the problems are more in people mis-attributing interpretations to this index that more careful analysts would avoid.
So far, the economic statistical base has been relatively insulated from political forces — albeit at underfunded levels (politiciams of all stripes don’t seem to find statistics gathering a useful enterprise). So in my view, one of the most important things we in the outside can do is to demand from our legislators greater funding of the statistics gathering agencies.
Emmanuel: Excellent point. My survey paper mentioned in my original post:
http://www.ssc.wisc.edu/~mchinn/uipsurvey_jan05.pdf
mentions a paper by Bansal and Dahlquist on interest rate parity in developing countries. They find mixed evidence. Similarly, a paper by Jeff Frankel and Jumana Poonawala:
http://ksghome.harvard.edu/~jfrankel/Forward_Market_in_Emerging_Currencies.pdf
In both cases there are offsetting effects. Government bonds denominated in different currencies should be poorer substitutes when examining those of emerging markets, as opposed to comparing developed countries. On the other hand, sometimes when inflation is higher, this means monetary shocks are larger, and interest rate parity seems to hold better as a consequence (i.e., the monetary shocks dominate real and financial shocks that might perturb the uncovered interest rate relationship).
Menzie,
What do you think you would find if you applied thresholds to interest rate differentials in a switching regime type of process. The assumption would be, for example, that dollar-Swiss is agnostic to interest rate differentials between a certain range, but then moves in a non-linear fashion once a threshold is crossed. Euro-dollar shows some short-term evidence of this. Plot the Euribor less US$ Libor 3mth differential vs. Euro-dollar with the former on the y-axis and the latter on the x-axis. You get a circle of sorts with Euro-dollar flat at high levels and at low levels between about -200bps and +60bps. But at +60bps (or so) in the Euro’s favor, the Euro ran. and when diffs were -200bps against the Euro, it fell powerfully.
Emmanuelle: I find that rate differentials matter powerfully in EM countries, but I think they need to be viewed in real terms, and, as per above, I think thresholds are important. For example, in Indonesia, real rates need to be about 200bps – 300bps for rupiah stability.
I also agree with your observation that many EM real exchange rates display powerful nonstationarity. I think this is because the economies have a tendency to experience massive real sector shocks (brought on by financial bubbles) which tend to produce permanent effects on relative productivity and relative price levels and so permanent shifts in their real exchange rate levels. The Asian financial crises of 1984 – 85 (Thailand and Malaysia) and then again in in 1997 – 1998 are examples.
Emmanuel: sorry for misspelling your name.
Menzie:
To clarify: Euro-dollar on the y-axis, the rate differential on the x-axis.
RF: I think it’s likely that application of formal statistical tests for thresholds would find evidence in support of this particular type of nonlinearity. See for instance this paper by Sarno et al.
http://faculty.haas.berkeley.edu/lyons/Sarno%20limits%20to%20spec%20and%20UIP.pdf
It’s a separate question whether exploiting such nonlinearities would result in superior out-of-sample forecasting performance. The detection of thresholds and the lack of outperformance may arise from two issues. The first is the distinction between statistical and economic significance. The economic magnitudes associated with the nonlinearities may not be large enough to be noticeable. The second is that the thresholds may not (are likely not) stable over time, even while the statistical tests typically identify a fixed threshold associated with each regime (close to UIP, far from UIP).
Any implied arbitrage opportunity or LTCM-like gambits if we posit your results correct?
TCO: Clearly, at the short horizon, people can — and do — make money on the carry trade (betting that uncovered interest parity does not hold). However, in all these cases you have to have very deep pockets because you can incur big losses before making money. At the long horizon, even though uncovered interest parity appears to hold, or more accurately, statistically you cannot reject the null hypothesis of it holding, the relationship is so weak, I can’t imagine anybody betting on it.
Uncovered Interest Rate Parity
Jim Hamilton Menzie Chinn writes about interest differentials and exchange rate movements: Econbrowser: Whither the dollar?: What the interest differentials say. One of my long term interests is in the predictability of exchange rates… myself, Yin-Wo…
Menzie,
Just came across a paper that claims that at the right time horizons regime-switching models beat the random walk in forecasting, thus, long swings do hold. It is by Franc Klaassen, “Long swings in exchange rates: are they really in the data?” Journal of Business and Economic Statistics, January 2005, vol 23, no. 1, pp. 87-95.
I would like to find a monthly plot of the dollar vs the euro since 1999.