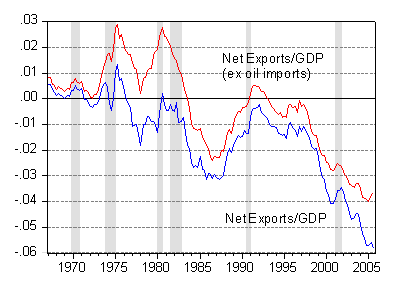
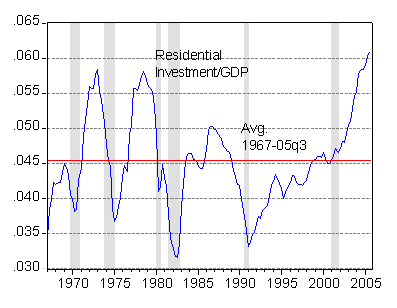
The messages from the 05q3 Preliminary GDP release.
The preliminary figures for the 3rd quarter GDP were released this morning. While the upward revision of real GDP growth to 4.3 percentage points at the seasonally adjusted annual rate caught most of the attention, it’s also of interest to consider the other figures.
First, consider the trends in net exports to GDP and net exports ex. oil imports. While net exports have stabilized as a proportion of GDP, non-oil net exports have actually started to rise (accounting for net natural gas imports only changes the level a little, by about 0.2 percentage points of GDP). This suggests that high energy prices might be crimping non-energy spending (although this uptick is also consistent with the effects of last year’s dollar depreciation finally feeding into tradables prices).

Second, investment in residential investment continues to rise through the 3rd quarter, albeit at a slower pace. In fact, the share of GDP devoted to this activity is unprecedented in the past 30 year period; if the past is any guide, this sector is in for a large contraction.

This pertains to the issue transferring resources from the nontradables to tradables sector discussed in my post a couple weeks ago. Reallocating labor and capital out of this sector and into manufacturing and tradable services (business process services?) may entail some large adjustment costs.
That slight uptick in ex-oil exports/gdp looks awfully similar to previous upticks that amounted to nothing more. Am I following your argument that the consumer spent the dough on the gas (oil exports/gdp not so upticky)to get to the store, but couldn’t bring himself to buy the stuff? And unless the pump prices come down significantly, the difference between these two levels will not narrow?
Last thing, the normalization to gdp is based on same quarter gdp numbers or is this spread out more? My concern is that current consumption is ~70% of gdp. Should consumers take a thrift pill and shift that compostion does it affect the normalization? Assuming that consumption/gdp has increased markedly over the 40yr period graphed, should I be accounting for this distortion?
‘Appreciate your view of residential investment and those adjustment costs ahead.
Menzie:
What is the composition of residential investment? New construction or residential realty sales?
Bill
Cal Morton: Yes, the normalization of net exports is based on contemporaneous GDP. You make a good point, but I’m not certain how else to display the data that doesn’t incorporate the aspect you mentioned.
I agree that the upturn in non-oil net exports might be a mere uptick. I think the trend depends upon the pace of real GDP growth.
Bill Ellis: The residential investment figure is from the National Income and Product Accounts, so it is fixed investment in residential housing (as opposed to investment in plant and equipment that would produce goods and services). Hence it is not a direct indicator of how “hot” the housing market is; rather it is a partial measure of how much of output is devoted to nontradables.
Thank you for that encouraging and generous reply mc. If we could for the sake of argument stipulate a 2%/yr increase in the consumer component of gdp, then would stretching/contracting the vertical axis on the RHS/LHS of this time frame give a more accurate picture? [If we could construct the function by which consumer/gdp changes over these 40yrs, the stretching/contracting would occur at each data point.]
Part of me wants to use a modified denominator (even contemporaneous GDP less consumption spending, or whatever is being normalized) in an effort to make the normalization more than a series of contemporaneous snap shots.
If the numerator is a small component this seems too trivial to be anything more than an academic exercise, but when the numerator is 70%, the normalization seems in jeoparody.
The other part of me (the one that tells me I’m tired and not sharp) tells me there are many other pressing problems with gdp larger than this…that yield solutions.
Great post, as usual. Am glad more and more people are talking about future adjustment costs.
I agree with Calmo — at this stage, the uptick in nx excluding oil could possible just be temporary — am interesting in what q4/ q1 look like. this year (on a y/y basis, less so on a q/q basis in q3) we had strong export growth ($ depreciation) and very slow growth in non-oil imports. Much as i would like to think the slow growth in non-oil imports is a sustainable trend/ byproduct of a weaker dollar/ rising oil imports/ less to spend on other things, i still suspect it is going to prove to be a period of consolidation after exceptionally rapid import growth in late 03/ most of 04. recent $ appreciation makes me even more skeptical it will last if q/q consumption growth is 4% …
Menzie:
Your chart of Residential Investment / GDP intrigued me and invited farther exploration. We have certainly had robust home building, and all of the headlines are filled with predictions that we have overbuilt. In considering the data, it seems to me that the real import is not as a part of GDP, but rather with respect to personal consumption + residential.
For the last four calendar quarters residential investment has averaged 7.83% of the total of personal consumption plus residential expenditures. For the period 1964 to 2004, the comparative level was 6.54%. Thus I compute that the variance from the norm is about 16% rather than the 25% implied by your chart. With annualized residential investment at about $768 Billion, this would indicate that the “excess” residential investment is on the order of $122 billion. This is of course a large number, but it is at about 10% of food cost.
In the years 1964 to 1968, non-durables stood at about 40% of personal consumption + residential investment. For the years 2000 to 2004 this had declined to a tad under 27%. Most of non-durables is food and clothing, and a 13% decline is equivalent to 1,250 billion annually.
The offset is that most of the savings from less spending on non-durables has been spent on services. Spending on services neared a top of about 54% of personal consuption + residential in 1993, but non-durables stood at about 30% at that time and have since declined to about 26.5%.
As a hypothesis, consider that the consumer funds saved by lower cost non-durables (imported from China) has been invested in housing.
Faith Popcorn’s defined trends for the ’90s included cocooning, withdrawing from society into the home, and the improvement of that home as a significant objective. While higher interest rates are sure to bring some hesitation to residential investment, perhaps the data reflects a significant change in lifestyle rather than a binge of excess building.
Bill
The inventory of unsold homes is real but I don’t believe the latest report of new home sales is accurate. The US appears to be following Australia into a period of declining construction. Your residential investment chart is ominous.
Years ago, a slowdown in housing and autos would have been more than enough to drive the economy to recession. However, it makes sense that the US should enjoy a few years of a strong business economy to counter a slowdown in consumer spending.
The inch worm pace of the world wide short interest rate bumps suggest that this business cycle could become the longest on record. The business expansion phase could last another 5 years or more? It may take several more interest rate bumps around the world just to “head gold off at the pass”!
Cal Morton: I think we have to consult Tufte to get a better answer on the question of appropriate normalization. But to the extent that we are dealing here with net exports rather than consumption per se, perhaps the problem is mitigated.
Brad Setser: Excellent points as usual. Given the recent data on income and spending, I’m inclined to side with the view that the deterioration in non-oil net exports will continue after a brief hiatus.
Bill Ellis: This is an intriguing hypothesis. I haven’t heard this conjecture below. But I suspect a far more powerful force spurring investment in residential housing has been the decline in real interest rates (to below zero), combined with expectations of ever continuing capital gains.
The lower cost of nondurables (e.g., imported from China) should have spurred additional spending on nondurables (remember offsetting income and substitution effects).
In other words, the maths are interesting, but shares must add up to 100%, so the challenge is explaining why the reallocation is toward housing, and not to other sectors.
Jack Miller: I’m not very much into forecasting — so you may very well be right that the expansion will continue for quite a while. In fact, my prediction that net exports will continue to deteriorate is consistent with this view. What gives me pause for thought is how close the yield curve is to inverting, as noted by Jim Hamilton in his recent post:
https://econbrowser.com/archives/2005/11/inverted_yield.html
Menzie:
There is no doubt that low interest rates spurred residential sales, and the expectation of appreciation of realty has been there forever. However, one of my life lessons is that a straight line drawn through any two data points, when projected far enought, always points in the wrong direction 🙂
Bill
Bill Ellis: We’re in agreement — expectations need not be unbiased. I’m guessing expectations of capital gains in housing have had a large extrapolative component (extrapolating from what I’ve learned about forex expectations measured by survey data).
An interesting academic paper would involve checking to see if anybody had collected survey data on expectations of housing price gains, and to (ex post) check on the unbiasedness of those expectations. Even more interesting would be identifying the expectations of the marginal (i.e., last in the market, or the house “flippers”) to see how their views evolve leading up to and as the housing boom fades.
If this weeks expected revisions in labor costs are indeed down sharply, the FOMC has already over shot. The curve will invert for a short time while long rates fall; I see no cause for alarm under the circumstances. Central bankers are confused and having a hard time figuring out what to do with strong growth, low core inflation and, perhaps, overstated headline inflation. A month ago, who would have thought the ECB would raise short rates in the face of 8.3% unemployment?