With revised data, when did the last recession begin?
In a recent post, Greg Mankiw cites Hamilton and Chauvet in support of his view that a good argument could be made that the recession of 2001 actually began in 2000. Mankiw writes:
“Back in 2004, Michael Mandel of Businessweek gave me grief for saying that the 2001 recession began in late 2000, rather than at the official NBER date of March 2001. My view (and the view of the nonpartisan CEA staff) was that the data were substantially revised after the NBER committee made their call, and the March 2001 date no longer seemed right in light of the revised data.”
As some readers may recall, the 2004 Economic Report of the President contained this box, which states:
“The National Bureau of Economic Research (NBER) uses a variety of
economic data to determine the dates of business-cycle peaks and
troughs. This task is made more difficult because many of these data
series are subject to revision. For example, on November 26, 2001, the
NBER announced that a recession had begun in March 2001. Since
then, the four data series that the NBER used to determine the timing
of the recession have been revised. The revisions to these series
suggest that the recent recession began earlier than March 2001.
The four series cited by the NBER in their decision about the recent
business-cycle peak were revised as follows:
- Real personal income less transfers:When the NBER dated the
recession, this series showed a generally steady rise throughout
2000 and early 2001. Subsequent revisions reveal that income
peaked in October 2000.
- Nonfarm payroll employment: The data at the time of the recession announcement showed employment growing at a substantial pace in early 2001, with 287,000 jobs added from December 2000 to its peak in March 2001. Revised data show that employment grew less than one-third of this amount in early 2001 and peaked in February 2001.
- Industrial production:The original data used by the NBER showed
that this series peaked in September 2000. Revised data show that
this peak came even earlier, in June 2000.
- Manufacturing and trade sales: Original data showed a peak in
August 2000; the most recent data show a peak in June 2000.Thus, the revised data show that the latest peak among the four
series was February 2001, with some series peaking considerably
earlier. Moreover, another data series, which the NBER has recently
announced it will incorporate into its business-cycle dating process,
also shows a peak before March 2001: monthly GDP reached a high
point in February 2001, according to the most recently available
estimates computed by a private economic consulting firm.
While some arbitrariness in determining the date on which a recession began is inevitable, revisions since the NBER made its decision for the most recent recession strongly suggest that the business-cycle peak was before March 2001. The median date of the peak for the five series discussed here is October 2000. Other data support the notion that economic activity had slowed sharply or even begun to decline by this point, including the stock market, business investment, and initial unemployment claims. For these reasons, the analyses throughout this chapter (including the charts that compare this recession to past recessions) use the fourth quarter of 2000 as the peak of economic activity and the start of the recession.
In October 2003, the NBER announced that it would defer consideration of whether the latest business-cycle peak should be revised until the results of the coming comprehensive revision of the National Income and Product Accounts were released. The major results of this revision were announced in December 2003, but the monthly manufacturing and trade sales data and some of the detail needed to estimate monthly GDP had not been released at the time this Report went to press.”
First let me make the observation that while Mankiw prefers the multivariate Markov Switching results in Table 6 of Hamilton-Chauvet, it is by no means the only set of estimates in the paper. Table 8, using the recursive estimation methodology indicates a March 2001 recession date — exactly the determination of the NBER Business Cycle Committee. (Caveat: We’ll have to wait for Jim to tell us which one he prefers — these are solely my views I’m reporting.) Indeed, using a similar methodology, Piger and Chauvet find that the recursive methodology identies the beginning of the 2001 recession in 2001q2 (according to real GDP) and September 2001 (payroll employment). (Using the full sample methodology retrieves dates in 2000 similar to those noted by Mankiw.)
In any event, we now have series that have been revised several times (see this post on data revisions) so that they are in final form. What do these data say? To answer this question, I refer first to what the NBER Business Cycle Committee states are the variables of importance:
“In choosing the dates of business-cycle turning points, the committee follows standard procedures to assure continuity in the chronology. Because a recession influences the economy broadly and is not confined to one sector, the committee emphasizes economy-wide measures of economic activity. The committee views real GDP as the single best measure of aggregate economic activity. In determining whether a recession has occurred and in identifying the approximate dates of the peak and the trough, the committee therefore places considerable weight on the estimates of real GDP issued by the Bureau of Economic Analysis of the U.S. Department of Commerce. The traditional role of the committee is to maintain a monthly chronology, however, and the BEA’s real GDP estimates are only available quarterly. For this reason, the committee refers to a variety of monthly indicators to determine the months of peaks and troughs.
The committee places particular emphasis on two monthly measures of activity across the entire economy: (1) personal income less transfer payments, in real terms and (2) employment. In addition, the committee refers to two indicators with coverage primarily of manufacturing and goods: (3) industrial production and (4) the volume of sales of the manufacturing and wholesale-retail sectors adjusted for price changes. The committee also looks at monthly estimates of real GDP such as those prepared by Macroeconomic Advisers (see http://www.macroadvisers.com). Although these indicators are the most important measures considered by the NBER in developing its business cycle chronology, there is no fixed rule about which other measures contribute information to the process.” [emphasis added]
Below are figures for the first three key variables: real GDP, payroll employment (with civilian employment based on the household survey thrown in for good measure), and real personal income less transfers. Gray shading indicates the recession dates according to the NBER.
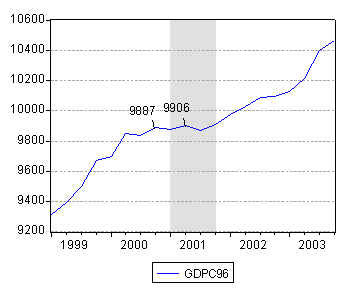
Figure 1: Real GDP in billions of chained 1996$, SAAR. Source: BEA via St. Louis Fed FRED.
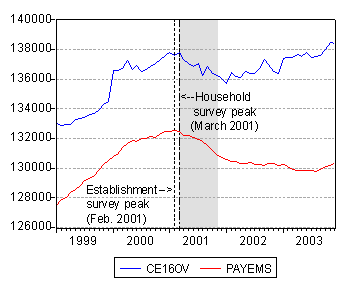
Figure 2: Payroll employment (red line) and civilian employment (over 16) (blue line), in thousands, seasonally adjusted. Source: BLS via St. Louis Fed FRED.
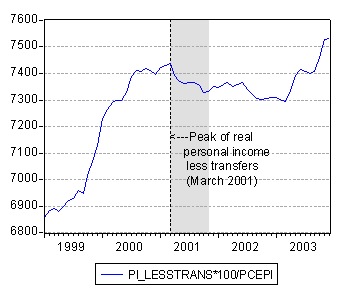
Figure 3: Personal income less transfers, in billions of 2000Ch$ (using PCE deflator), seasonally adjusted. Source: BEA via St. Louis Fed FRED and author’s calculations.
The peak for real GDP could be 2000q4 or 2001q2. The “sawtooth” pattern makes a determination difficult; John Kitchen’s “quarterly variation” growth measure first goes negative in 2001q1, while his “underlying growth” measure hits its trough in 2001q4. Payroll employment peaks in February 2001 (civilian employment in March 2001). Personal income less transfers peaks in March 2001. What about the auxiliary variables of interest, industrial production and real sales? (Note: I don’t have access to Macroeconomic Advisers’ monthly GDP series — contributions welcome!)
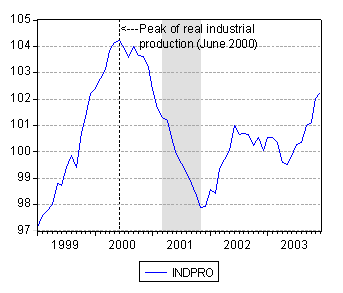
Figure 4: Industrial production, seasonally adjusted. Source: St. Louis Fed FRED.
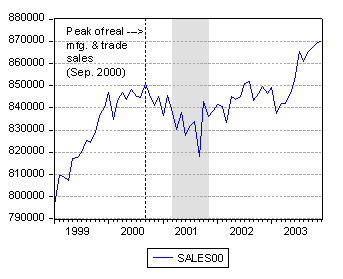
Figure 5: Real sales of manufacturing and trade, in billions of 2000Ch$, seasonally adjusted. Source: BEA NIPA Supplementary Table 2BU.
The peak dates for these two less heavily-weighted series are June and September 2000 respectively.
So, while I think reasonable people can disagree on the starting point, for me, a revisiting of the data tells me the recession of 2001 took place in…2001.
[Addition, 8/19/06 11:20am Pacific]
Courtesy of Spencer England, I can now plot real monthly GDP as estimated by Macroeconomic Advisers:
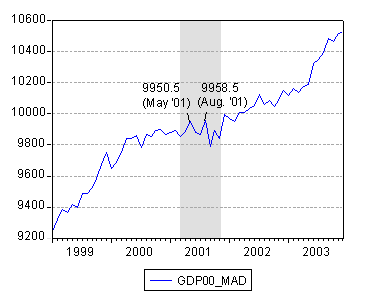
Figure 5: Monthly index of real GDP, in billions of 2000Ch$, SAAR. Source: Macroeconomic Advisers via Spencer England.
The graph confirms Rex’s comment below that there are two peaks, solidly in the NBER recession period, both in 20001. Whether this plateau is consistent with one’s view of what defines a recession, I leave up to the reader. (Recall, however, NBER does not place central importance on the monthly GDP index.)
Technorati Tags: recession,
GDP,
payroll employment,
industrialproduction,
sales, and
personal income.
What else could we expect from Mankiw?
While the official date may be March 2001, what does that tell us? We know that it takes time for policy changes and events to actually effect the economy. I believe that most would recognize that decisions made today by the FED, by congress, and the administration will take 6 months or longer to begin to show up in the numbers. So what happened in 2000 to cause the 2001 recession?
All business cycles have a down side. During the good times, more and more people think the good times will never end. Both businesses and persons bocme overextended on credit, purchases, hiring, etc. Government, meantime, starts doing something to kill the golden goose, either through fiscal or monetary policy.
Recessions cause some rationality to be restored and then the whole cycle begins again.
The key here is that you must realize, the good times always end.
Patch,
I know it is generally accepted to say that the good times must always end, but I simply do not believe that is true. The good times are brought to an end by intervention. You mention the problem in your post: Government, meantime, starts doing something to kill the golden goose….
I am an avid free market economist in large part because I believe that the free market will cause market declines to be isolated to small segments of the economy for limited periods of time. When macroeconomic mistakes are made they effect the entire economy which often includes the entire world especially when made by the US.
It is impossible for any one person, or even an educated small group of people, to know what the market as a whole knows; therefore, macroeconomic decisions that do not fail are more often than not simply aberrations, a fortunate accident.
I know this goes against the grain of many macroeconomists because they love the game, but what we must realize is that the game is fine until the players begin to move the game into the policy arena. When that happens the real ruler of the economy becomes the Law of Unintended Consequences.
It looks like real monthly GDP (from MacroEconomics Advisers) had two peaks in 2001: May 2001 at $9.951 trillion and in August at $9.959 trillion after a sharp dip to $9.851 trillion in March.
Here are the monthly figures:
2000 – Jul 9785.290;
2000 – Aug 9869.769;
2000 – Sep 9854.769;
2000 – Oct 9896.356;
2000 – Nov 9898.552;
2000 – Dec 9868.325;
2001 – Jan 9880.813;
2001 – Feb 9894.910;
2001 – Mar 9851.390;
2001 – Apr 9889.940;
2001 – May 9950.500;
2001 – Jun 9877.635;
2001 – Jul 9866.730;
2001 – Aug 9958.517;
2001 – Sep 9788.344;
2001 – Oct 9895.429;
2001 – Nov 9839.511;
2001 – Dec 9995.790.
So why this big pi**ing match about whether the recession started in October 2000 vs. March 2001? Could it really make all that much difference? Well, only to those obsessed with pinning the blame on either Clinton or Bush. Republicans have insisted on saying that everything bad in the economy that has happended since 2001 is due to the “Clinton” recession. As JDH has shown, you rarely know for sure whether you are actually in a recession until after the fact, and in this case that was mid-2001. The real debate should be about the effectiveness of various ways of responding to that challenge since 2001.
Joseph: Given all the current discussion of recession (e.g., see today’s NYT article on auto sales), I think that it is useful to define what is or isn’t a recession. In this respect, I think Mankiw’s point is well taken — reasonable people can disagree on what constitutes “…a significant decline in economic activity spread across the economy, lasting more than a few months…”. I’ve seen assertions that a recession is 2 consecutive quarters of negative GDP growth, and even 3 consecutive quarters (a new one on me). In an era where potential GDP is growing faster than in the 1970-90 period, does the reliance on real GDP growth still make sense (as attested to in the pattern shown in Figure 5)? All these are questions that I think are important irrespective of which Presidential term a particular recession falls in.
Greg Mankiw takes a (late) shot at me
Greg Mankiw, eminent Harvard economist and textbook author, just took a shot at an article I wrote two years ago: Back in 2004, Michael Mandel of Businessweek gave me grief for saying that the 2001 recession began in late 2000,…
Sorry, I guess I was just responding to much of the discussion in the popular press.
It seems that a recession is in the eyes of the beholder. For wage earners it is the decline in payroll employment. For businessmen it is the decline in production and sales. For investors, it is a decline in the stock market.
I believe the actions of the FED in 2000 were much more related to the 2001 recession than who, or which party, was in the White House. Greenspan kept interest rates high even in the face of indicators showing the economy headed for recession. We talk about the Greenspan standard, what about the Greenspan recession.
Talk is Cheap, But Is It Informative?
Jeremy Piger reviews research on the reaction of financial markets to non-quantitative written and oral Fed communications, and, separately, provides estimates of recession probabilities for the U.S.: Is All That Talk Just Noise?, by Jeremy Piger, Mone…